Coca-Cola FEMSA Investor Presentation

Page created by Ted Larson
 
CONTINUE READING
Coca-Cola FEMSA Investor Presentation
Coca-Cola FEMSA
Investor Presentation
Coca-Cola FEMSA Investor Presentation
Disclaimer
FORWARD-LOOKING STATEMENTS
This presentation contains “forward-looking statements”. These forward-looking statements relate to Coca-Cola FEMSA, S.A.B. de C.V., its
Subsidiaries (“KOF”), and their businesses and are based on KOF management’s good faith expectations regarding KOF and its businesses. Forward
looking statements involve known and unknown risks, uncertainties and other factors, many of which are beyond KOF’s control and which may
cause the actual results, performance or achievements of KOF and its businesses to be materially different from those expressed or implied by the
forward-looking statements contained herein or in oral statements made by members of KOF’s management. There can be no assurance that the
results and events contemplated by the forward-looking statements in this presentation will in fact occur. These forward-looking statements are
based on numerous assumptions regarding KOF’s present and future business strategies and the environment in which KOF operates and are not a
guarantee of future performance. Therefore, recipients should not place undue reliance on them. Forward-looking statements speak only as of the
date they are made. KOF undertakes no obligation to update or revise any forward-looking statement, whether as a result of new information, future
events or otherwise.

CONFIDENTIALITY
The nature of all the information in this presentation is privileged and confidential and belongs to KOF. By electing to view this information, you
represent, warrant and agree that you will not copy, take away, record or otherwise attempt to re-transmit this information, in whole or in part,
directly or indirectly to any other persons (whether within or outside your organization/firm). Distribution of this information to any persons other
than the person to whom this information was originally delivered and such person’s advisors is unauthorized and any reproduction of these
materials, in whole or in part, or the divulgence of any of its contents is prohibited. By attending this presentation, you are agreeing to be bound by
the foregoing restrictions and to maintain absolute confidentiality regarding the information disclosed in these materials.

ADDITIONAL INFORMATION AND WHERE TO FIND IT
Documents filed electronically by KOF with the Securities and Exchange Commission’s (“SEC”) are available to the public on the Internet at the SEC’s
website at www.sec.gov and at our website at www.coca-colafemsa.com. Free copies of all of KOF’s filings with the SEC may also be obtained by
directing a request to:
                                                                                                                               INVESTOR RELATIONS
COCA-COLA FEMSA
Mario Pani # 100, Col. Santa Fé Cuajimalpa 05348, México City, México                                                          kofmxinves@kof.com.mx
Coca-Cola FEMSA Investor Presentation
Agenda

1)   Company Overview

2) Key Investment Highlights

3) COVID 19 & Sustainability Strategy

4) Financial Summary

A) Appendix
Coca-Cola FEMSA Investor Presentation
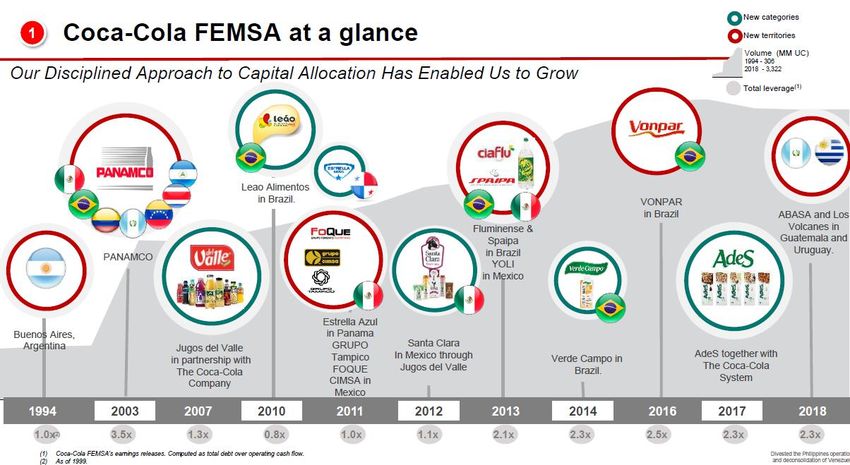
Coca-Cola FEMSA at a Glance
                                               Largest Coca-Cola Franchise Bottler in the World by Volume, selling 1 out of every 9 Coca-Cola products in the world

                                                                                                                                                                                        Attractive Regions
       Largest franchise bottler of Coca-Cola trademark beverages in
                                                                                                                                                                                                                           Strategic Partner to The Cola-Cola
         the world in terms of volume
                                                                                                                                                                                                                          System Representing 11.3% of Global
                                                                                                                                                                                                                                       Volume(4)
       We are a multinational, multi-category beverage leader, serving                                                                                                                                           (8)                                            +3.2bn
         over 265 million people and 1.9 million points of sale through 49                                                                                                                                                                                     Unit Cases(3)

         plants and 268 distribution centers across 9 countries.                                                                                                                                                                                               Carbonated Soft Drinks
                                                                                                                                                                                                                                                              Coca-Cola Brands Market
                                                                                                                                                                                                                                                                     Position(6)

    Figures in Ps. Mm               2017            2018              2019          2020     (3)   2020 US$mm    (2)
                                                                                                                                                                                                                                                                                    1st
    Total Revenues              $    183,256    $   182,342     $     194,471   $    183,615       $     9,231
    Gross Profit                $     83,508    $    83,938     $      87,507   $     82,811       $     4,163                                                                                                                                                                      1st
    Gross Margin                       45.6%          46.0%             45.0%          45.1%             45.1%
    Total Debt (1)              $     83,360    $    81,805     $      69,977   $     87,478       $     4,398                                                                                                                                                                      1st
    Cash & Cash Equivalents     $     18,767    $    23,727     $      20,491   $     43,497       $     2,187
                                                                                                                                                                                                                                                                                    1st
    Operating Cash Flow         $     36,292    $    35,456     $      37,148   $     37,345       $     1,878
                                                                                                                                           Volume Mix
                                                                                                                                                                                                                                                                                    1st
                                                                                                                        (Figures as of 2020 )               6.2% Still
                                                                                                                                                                                                                                                                     Central        1st
                                                                                                                                                                                                                                                                    America(7)
                                        Shareholder Structure                                                                                              14.3% Water

                                                                                                                                           79.5%

                   Voting: 56.0%                     Voting: 32.9%                      Voting: 11.1%                        Sparkling                                                                                                                +80,000 Employees(5)
                  Economic: 47.2%                   Economic: 27.8%                   Economic: 25.0%

                                                                                                                       (1)   Includes Bank loans and notes payable, current and non-current portion. Includes the effect of derivative financial instruments on the non-current portion.
                                                                                                                       (2)   Converted at FX rate 19.89 MXN to US$ as of December 31, 2020
                                                                                                                       (3)   Computed as of FY2020
                                                                                                                       (4)   The Coca-Cola Company and KOF filings.
2                                                                                                                      (5)   Coca-Cola FEMSA filings.
                                                                                                                       (6)   Market position by volume. Euromonitor as of 20120
                                                                                                                       (7)   Comprised of Guatemala, Nicaragua, Costa Rica and Panama.
                                                                                                                       (8)   Operations in Venezuela through KOF’s investment.
Coca-Cola FEMSA Investor Presentation
Our footprint
                              A geographically diversified bottler, ideally placed to capture its many opportunities

                 Mexico & Central America                                                                 South America

~108.5 million consumers                                                          ~157.3 million consumers
~1.1 million points of sale                                                       ~.9 million points of sale
~ 9.8 bn transactions                                                             ~7.6 bn transactions
~1.9 bn unit cases                                                                ~1.3 bn unit cases
~US$5.4 bn in Revenues                                                            ~US$3.9 bn in Revenues
23.3% Operating Cash Flow                                                         16.2% Operating Cash Flow
     Mexico represents 54% of our                                                      Brazil represents 26% of our
     total volumes                                                                     total volumes

 Accelerating performance in the division:                                    Accelerating performance in the division:
   Expand Universal Bottle and Refillables in new                                Affordability through Returnables and Magic Price points
    channels
                                                                                  Acceleration of omnichannel digital strategy
   Recent launch of Topo Chico Hard Seltzer
                                                                                  Focus in channel strategy and execution
   Become market leader in hydration, nutrition
    and energy                                                                    Profitable portfolio diversification

   Effective cost and expense controls
Coca-Cola FEMSA Investor Presentation
Agenda

1)   Company Overview

2)   Key Investment Highlights

3) COVID 19 & Sustainability Strategy

4) Financial Summary

A) Appendix
Coca-Cola FEMSA Investor Presentation
Our key investment highlights and strategy remain our long-term guide

          STRATEGIC PARTNER TO                                   CONSUMER-CENTRIC
                                        MARKET LEADERSHIP
          COCA-COLA COMPANY.                                     BUSINESS MODEL
                                        SUPPORTED BY STRONG
          KOF IS THE LARGEST                                     ANCHORED BY A DIFFICULT
                                        BRANDS AND CONTINUOUS
          FRANCHISE BOTTLER IN THE                               TO REPLICATE COMMERCIAL
                                        INNOVATION ADDRESSING
          WORLD                                                  CAPABILITIES AND
                                        CONSUMER DEMANDS
                                                                 DISTRIBUTION NETWORK

        TRACK-RECORD OF              EXPERIENCED                STRONGLY COMMITTED TO
        DELIVERING STRONG FREE       MANAGEMENT TEAM            SUSTAINABILITY GOALS AND
        CASH FLOW GENERATION                                    FOCUSED IN IMPLEMENTING A
        WITH A DISCIPLINED                                      POSITIVE ENVIRONMENTAL
        APPROACH TO LEVERAGE                                    CHANGE ACROSS THE ENTIRE
                                                                VALUE CHAIN
Coca-Cola FEMSA Investor Presentation
Strategic Partner to The Coca-Cola Company and the Largest
1                    Franchise Bottler in the World by Volume                                                                                    2                  Presence in Markets with Long-term Consumption Tailwinds
                                                                                                                                                                                                 Argentina & Uruguay
    (Volume as of 2020 in mmUC(1))                                                                                       KOF Sells ~11% of The                                      Colombia
                                                                                                                         Coca-Cola Company                                                  (3)
             EBITDA
                                                                                                                        (“KO”)’s global volume                             Central America 7.8%
          Margin: 20.3%
                                                                                                                                                               2020 Volume                    7.1% 5.3%
               3,284                             (2)
                                        2,895                                                                                                                   Breakdown                                 53.6% Mexico
                                                                  2,155
                                          618                                              2,136                                                                                             26.3%
                                                                                                                                                                                     Brazil
                                         2,277                                                                        837
                                                                                                                                    458

                                                                                                                                                        Soft Drinks Industry Growth vs GDP                     Soft Drinks YoY Growth(3)     Real GDP Growth(4)

                                                                                                                                                                               8.3%
                                                                                                                                                                                                                     7.1%             6.6%          7.2%
                                                                                                                                                                                                       6.0%

                                                                                                                                                           Mexico
                                                                                                                                                                                               4.4%
     Mutually beneficial relationship dating back for 25 years, providing KOF:                                                                                                 2.9%                    2.6%          2.1%             2.2%
                                                                                                                                                                                               3.3%                                                -0.3%

                           PREMIUM BRANDS                                                                 DIVERSIFIED PORTFOLIO                                                2014            2015    2016         2017              2018          2019

                                                                                                                                                                                                                                      8.9%          9.9%
                                                                                                                                                                              14.5%            7.6%    7.1%         7.3%

                                                                                                                                                           Brazil
                            COLLABORATION                                                                 SUSTAINABILITY
                                                                                                                                                                               0.5%                                  1.3%             1.3%          1.1%
                                                                                                                                                                                               -3.5%   -3.3%
                                                                                                                                                                               2014             2015    2016        2017              2018          2019

    ____________________
    (1)   MMUC: Million Unit Cases. Each unit case is 24 eight-ounce servings of finished beverage equivalent to 5.678 liters.                   (4)   Source: Euromonitor. MSP sales value.
    (2)   Volume pro-forma considering the proposed acquisition of Coca Cola Amatil by CCEP                                                      (5)   Economist Intelligence Unit.
5   (3)   Comprised of Guatemala, Nicaragua, Costa Rica and Panama.
Coca-Cola FEMSA Investor Presentation
3                      Market Leadership Supported by a Portfolio of
                            Brands and Continuous Innovation                                  4                   Consumer-centric Business Model
                                                                                                              Strongly Committed to Sustainability Goals
                                           Coca-Cola Brands
                                                                                                   Powerful consumer-centric business model

    5 World Best                                                      The Coca-Cola Logo is

       Brand                                                           Recognized by
                                                                                      (1)
                                                                      94% of the world
          (Interbrand 2019)
                                                                                                                                              Digital tools improving
                                                                                                                                                   service level &
                                                                                                                                                 efficiencies in our
                                                                                                                                             commercial service and
                                                                                                                                                 distribution model

           Carbonated soft         Non-Carbonated      Energy and          Bottled
               Drinks                Soft Drinks         Sports            Water

                                                                          Highly                            Our performance has granted us recognition amongst
                                                         Highly
                Leader                  Leader                                                                           top Sustainability Raters
                                                       Competitive      Competitive

                      Portfolio +300 annual launches, including +100 in Brazil

                                                                                                     First Mexican company to receive the approval of the Science Based
    Driven by our strict focus on our consumers, we are consolidating a tailored
                                                                                                  Targets Initiative (SBTi) for its greenhouse gas (GHG) emissions reduction
          total beverage portfolio to satisfy evolving tastes and lifestyles
                                                                                                                                       targets

6   (1)    As per The Coca-Cola Company website.
Coca-Cola FEMSA Investor Presentation
Track-Record of Delivering Strong Cash Flow
5                                   with a Disciplined Approach to Leverage                                                                                             6                           Experienced Management Team
                                                                                                                                                                                Years at KOF
    (Figures in USD MM)
                                                                                                                                                                                          +26                              +3                              +8
                              2,186.7
                                        1,928.6                                                                             1,971.2
     Operating Cash Flow(1)

                                                    1,815.2                             1,838.9           1,801.3                             1,877.6
                                                                      1,717.7
                                                                                                                                                                                   John                         Constantino                       José Ramón
                                                                                                                                                                                Santa Maria                        Spas                            Martínez
                                                                                                                                                                                    CEO                             CFO                              CAO
                                                                                                                                                                                                          +3                                 +34                           +22

                                                                                                                                                                                                Karina Paola                     Rafael Alberto                   Rafael
                               2013      2014         2015              2016              2017              2018              2019              2020                                               Awad                             Suarez                        Ramos
                                                                                                                                                                                                    HRO                               ITTO                         SCEO
                                                                                                                                                                                          +23                             +27                              +6
    (Figures in USD MM)

                                                                      3,873.5
                              3,453.1   3,605.7                                         3,494.9
                                                                                                                                                                            Washington Fabricio                  Ian Marcel                   Eduardo Guillermo
                                                    2,837.8                                               2,892.9                                                                 Ponce                             Craig                        Hernández
                                                                                                                            2,641.7                                              COO - Mexico                     COO - Brazil                     COO - LatAm
     Net Debt(2)

                                                                                                                                              2,121.4
                                                                                                                                                                                   Resilience                           Discipline                         Commitment
                                                                                                                                                                             Stable profitable                 Transformation driving              Strong track record of
                                                                                                                                                                              performance                        efficiencies and growth              management and
                                                                                                                                                                             Leadership position               Opportunistic consolidator           governance
                                                                                                                                                                              across LatAm                      Disciplined and returns-            Best in class approach to
                                                                                                                                                                             Ongoing value chain                oriented approach                    sustainability and societal
                               2013      2014         2015              2016              2017              2018              2019              2020                          optimization                                                            needs

    ____________________
    Exchange rate for 2013: 13.0765, 2014: 14.718, 2015: 17.2065, 2016: 20.664, 2017: 19.7354, 2018: 19.6829, 2019: 18.8452, 2020: 19.89
    (1)   Operating cash flow = operating income + depreciation, amortization & other operating non-cash charges.
7   (2)   Includes Bank loans and notes payable, current and non-current portion. Includes the effect of derivative financial instruments on the non-current portion,
          less cash and cash equivalents.
Agenda

1)   Company Overview

2)   Key Investment Highlights

3)   COVID 19 & Sustainability Strategy

4) Financial Summary

A) Appendix
COVID-19 Strategy – KOF’s 5 C’s Program Key Actions
                               Guiding our business through short-term operating disruptions while ensuring execution of our long-term goals

               Collaborators                    Clients                        Consumers                       Communities                       Cash Flow

                                                                          Leverage our direct to
                                       Remain close to our clients                                       Help communities in need           Implement measures to
       Preserve their safety and                                        consumer channels while
                                      and help them stay open in a                                        through different social       strengthen our balance sheet
             well-being                                                    offering unmatched
                                                safe way                                                        initiatives                and protect our cash flow
                                                                               affordability

                                                                       Returnables and “magic”         Transporting medical             US$ ~500 MM short-term
                                      Implementation of omni-                                           supplies, contributing to the     financing, current cash &
                                                                        price
                                       channel strategies (B2B                                           construction of alternative       cash equivalents balance of
     Reinforced health,               platforms, contact centers,
                                                                       Reinforcing our direct to        health centers, and               Ps. 2.5bn(1)
      sanitation and hygiene           and voice over IP services).
      protocols and deployment                                          home routes (+500k homes         acquiring medical
      of protective equipment                                           in Mexico)                       equipment                        Partially reduced and
                                      Protective screens                                               Donated + 3.8 million liters      postponed CAPEX, focusing
                                       donation to support their       Digital channels growing         of beverage                       on immediate needs for
                                       safe reopening.                  +75.5% YoY B2C growing                                             business continuity
                                                                        importantly

    ____________________
8   (1) As of 3Q’20.
KOF’s Strategy Yielding Successful Results as Demonstrated by 2020
Performance

      Resilient Volume Performance                                                      Ability to Mitigate Headwinds         Strong Margins
                                    December 2020                                                                                 December 2020

                (4.3%)(1)                                                (4.0%)(1)          Impact was mostly   mitigated   +120bps Operating Cash
            GDP Growth 2020                                           GDP Growth2020
                (8..5%)(2)                                               (6.8%) (2)        driven by our countermeasures         Flow Margin      (1)

                                             (2.5%)(1)
                  1.9%(1)                                               (3.9%)(1)
            GDP Growth 2020                                           GDP Growth 2020
                 (4.1) (2)                                                (2.0%)(2)

      Boost to Affordability Strategy                                                     Strong Liquidity Position         Resilient and Effective
                                   December 2020                                                                              Cash Conversion

               Full Year Refillables growth                                                 with Ps. 43bn of cash on          +12% YoY Cash from
                    +~7 % vs PY in Mexico                                                        hand as of 2020(1)          operations despite the
                    +~8 % vs PY in Brazil                                                                                   challenging environment
                                                                                                                                   Ps. 35.1bn(1)

    ____________________
    Source: Company filings.
9   (1) Coca-Cola FEMSA FY’20 filings.
    (2) KOF Corporate Treasury based on external analyst estimates.
Sustainability is a KOF’s Business enabler
                                    We have delivered on our 2020 goals and on track to deliver our 2030 world without waste goals

                     Climate Change                                             Water Stewardship                                            Circular economy

 •       We have accomplished 80%                             •    We improved our water use ratio                      •      We used 29% of recycled materials
         coverage of our global bottling                           to 1.49 liters of water per liter of                        in our PET packaging beating our
         operation’s energy requirements.                          beverage produced.                                          2020 goal of 25%.
                                                              •    From 2010 through 2019 we
 •       In 2019, we reduced our energy                                                                                 •      We collected more than 50% of the
                                                                   decreased our absolute water
         consumption by 12% resulting in                                                                                       bottles that we put into the
                                                                   consumption by 22.5%.
         US$8.15 million total energy                                                                                          market, well positioned to achieve
         savings.                                                                                                              our 2030.

                     Clean Energy                                              Water Efficiency                                      PET packaging materials
                 % of energy from clean sources                          Liters of Water per Liter of Beverage                     % of recycled materials in our PET packaging
                                                    80                                                                                                                            29.0
                                              71                                                                                                                       23.7
                                                                  1.72                                                                        19.8    21.2    20.8
                                      50                                       1.65        1.58
                              38                                                                      1.52       1.49                 14.6
                      29                                                                                                    11.6
            19
     9

 2014      2015      2016    2017    2018    2019   2020          2016         2017       2018        2019       2020   2014          2015    2016    2017    2018     2019       2020

10
                            We aim to simultaneously create economic, social and environmental value
Agenda

1)   Company Overview

2)   Key Investment Highlights

3) COVID 19 & Sustainability Strategy

4)   Financial Summary

A) Appendix
Debt Maturity Profile as of December 31st, 2020
                                                        Pro Forma Debt Profile(1)                                                                                    Credit Ratings(1)

                Debt mix by Currency                                               Debt mix by Rate                                                                  BBB+                   A-                      A2

                                                                                                                                                                                                                             Dr.Pepper
                                                                                                                                                                                                                  Heineken
                               Other:3%

                                                                                                                                                                                            ABInbev

                                                                                                                                                                                                       Hellenic
                                                                                                                                                                                   Amatil
                                                                                                                                                                          Swire

                                                                                                                                                                                                                                         COKE
                BRL:11%

                                                                                                                                       Pepsi

                                                                                                                                                              CCEP
                                                                                                                                                      Arca
                                                                                Float: 20%

                                                                                                                                  KO
                                                                                       Float: 8%
            COP:1%
                                                                                                                             A1
                  USD:27% MXN:MXN:57%
                               64%                                                       Fix: 80%                            A2
                                                                                          Fix: 92%                           A3
                                                                                                                             Baa1
                                                                                                                             Baa2
                                                                                                                             Moody’s Ratings
                                                                                                   Pro Forma Debt Maturity Schedule
                                                                                                                                                                                  1,250
             COVID loans payed in October (USD ~385 MM)                                                  Total Debt W/O       hedges
                                                                                                                                                                                                      705
                                                                                                         US$ (MM) 4,618(2)
             Green Bond issuance                                                                                                                                                                                             600

                                       402                                                                                                     378
                                                                             335                          345
            234
                                                                                                                              136                            134
                                                                   82
                                                                                           16
           2020
     ____________________
                                     2021                       2022         2023         2024            2025               2026              2027          2028                 2030                2032                   2043
     Source: Coca-Cola FEMSA filings
17   (1)   Moody’s ratings.
     (2)   Total debt excluding COVID loans payed in october, US$ 4,233 MM
Leverage Evolution
            Gross Debt / LTM EBITDA
            Net Debt/ EBITDA

          Cash
          KOF’s Net Debt                                               2.56                               2.52
                                          2.13      2.10                        2.16     2.22                      2.25
                                                              2.06                                1.94
  (USD MM)
                                                                       2.37
                  1.07                              1.79                        1.75
                                                              1.61                       1.60
                                           1.52                                                   1.41             1.31
                                                                                                          1.13

                                          4,663                        4,380    4,446
                  0.22                              4,253                                                 4,308
                                                                                         4,098
                                          1,330               3,767     333     846               3,729           3,836
                                                     619
                                                              824                        1,140
                                                                                                  1,015   2,187   1,594
                   2,308
                                                    3,634              4,047    3,600
                                          3,333               2,943                      2,959
                   1,833                                                                          2,714
                                                                                                          2,121   2,242
                     475
                    2012                  2013      2014      2015     2016     2017     2018     2019    2020    2021 E

EBITDA(1)                  2,159            2,193     2,030    1,828    1,708    2,062    1,847   1,924   1,877   1,707
MXN (EOP)                  13.01            13.08     14.72    17.21    20.66    19.74    19.68   18.85   23.26   22.63
BRL (EOP)                   2.04             2.34      2.66     3.90     3.26     3.31     3.87    4.03    5.35    5.25

    ____________________
    (1)   Excludes Venezuela since 2014
                                                                                                                           17
Consolidated Financial Summary                                                                                                                         USD.mm (1)

                                          Total Revenues                                                                                               Gross Profit                                Operating Income

Volume         3,318                    3,322                     3,369                       3,284                                                                         Gross Mg                                        EBIT Mg

                                                                10,319                                                                                              4,643                         1,292                    1,269
          9,286                       9,264                                                 9,231                               4,231               4,265                   4,163
                                                                                                                                                                                       965                     954

                                                                                                                                 45.6%              46.0%           45.0%   45.1%

                                                                                                                                                                                                   13.9%                   13.7%
                                                                                                                                                                                       10.3%                    9.2%

           2017                        2018                       2019                       2020                                2017               2018            2019    2020       2017       2018         2019        2020
                                   Capital Expenditures(2)                                                                                             Total Debt(3)                           Cash and Cash Equivalents

  % of      7.0%                         6.0%                       5.9%                       5.6%
revenue (4)

               655                                                                                                              4,224               4,141                   4,398                                          2,187
                                                                   608
                                        562                                                   520                                                                   3,713                         1,205
                                                                                                                                                                                                               1,087
                                                                                                                                                                                       951

           2017                        2018                       2019                       2020                                2017               2018            2019    2020       2017       2018         2019        2020
         ____________________
         (1)     Figures calculated in USD using an exchange rate of 19.7354 for 2017, 19.6829 for 2018, 18.8452 for 2019 and 19.89 for 2020
         (2)     Includes acquisitions of long-lived assets minus proceeds from sale of long-lived assets plus acquisitions of intangible assets.
         (3)     Includes Bank loans and notes payable, current and non-current portion.
         (4)     Computed as capital expenditures over total revenues.
Agenda

1)   Company Overview

2)   Key Investment Highlights

3) COVID 19 & Sustainability Strategy

4)   Financial Summary

A) Appendix
KOF was able to leverage on its environmental and sustainability commitments and
achievements to successfully place its first Green Bond in the market
On August 26th, 2020, we priced USD 705MM in the Yankee market with the Green Label recognition
   The transaction represents the lowest ever coupon printed by a Latam issuer in the 10 – 12 yrs range
   Largest corporate Green Bond in Latin America and First ever Mexican Corporate Green Bond
KOF was able to achieve the Green Bond feature in record time (4 weeks) given its commitment towards Sustainability ever since the Company was created:
   First Mexican Company to have science-based targets, with clear action plans
   Pioneer in the use of recyclable packages, with one of the highest packaging collection rates (~50% of KOF’s main markets)
   7 year old member of some of the most relevant and recognized sustainable indexes such, as Dow Jones Sustainability and FTSE4Good

  For KOF, sustainability is an essential component of our business that allows us to maximize value for our stakeholders. Therefore, we encompass our sustainable
 efforts to communicate our strategy to “ESG-investors” in the following three categories:
                                                                                                                                         1
                                                                                                                                         1
                                                                                                                                     1
                                                                                                                                     0

              Climate Change                                              Water Stewardship                                       Circular economy
 We align our efforts to the Paris Agreement                    We focus on our operational water use                    Waste management and recycling of
 goal of preventing global temperature from                   efficiency and we help our communities to                 polyethylene terephthalate (PET) bottles
              rising above 2oC                                               access water

                Electric vehicles acquired for                             Water usage efficiencies                                Recycled resin purchases
                our fleet                                                  (1.5lt per 1lt. produce)                                for our PET packages
Consolidated Financial Summary
(Figures in Ps.mm, unless otherwise stated)
                                                                                                                                            2017           2018          2019            6M'19         6M'20          2Q'20 LTM
                                                                                                                                                                                                                               (1)
Income Statement
Total revenues                                                                                                                                183,256        182,342       194,471          94,444        88,341          188,368
 YoY Growth                                                                                                                                     16.6%         (0.5%)            6.7%                       (6.5%)
Cost of goods sold                                                                                                                            (99,748)       (98,404)     (106,964)         (51,349)     (48,593)         (104,208)
Gross profit                                                                                                                                   83,508         83,938        87,507          43,095        39,748            84,160
 Gross Margin                                                                                                                                  45.6%          46.0%         45.0%           45.6%         45.0%             44.7%
Operative expenses                                                                                                                            (58,044)       (57,924)      (60,537)        (29,963)       (28,132)        (58,706)
Other (expenses) income                                                                                                                        (31,357)        (1,881)      (2,490)          (1,041)        (1,512)         (2,961)
Interest expenses                                                                                                                                (8,777)      (7,568)       (6,904)         (3,475)        (4,691)          (8,120)
Interest income                                                                                                                                      791        1,004        1,230              551            556           1,235
Foreign exchange gain (loss), net                                                                                                                   788          (277)        (330)            (199)           493             362
Gain (loss) on monetary position for subsidiaries in hyperinflationary economies                                                                  1,590            212          221             (30)           175             426
Market value gain (loss) on financial instruments                                                                                                   246          (314)        (288)               1            -              (289)
Income (loss) before income taxes                                                                                                               (11,255)       17,190       18,409           8,939          6,637           16,107
Income taxes                                                                                                                                     (4,184)      (5,260)       (5,648)          (2,519)       (2,091)         (5,220)
Share of the profit of associates and joint ventures accounted for using the equity method, net of taxes                                              60         (226)         (131)            (64)          (143)           (210)
Net income (loss) for continuing operations                                                                                                    (15,379)        11,704       12,630           6,356          4,403          10,677
Net income (loss) for discontinued operations                                                                                                     3,725         3,366          -               -               -               -
Consolidated net income (loss)                                                                                                                  (11,654)      15,070        12,630           6,356          4,403          10,677

Other Key Metrics
Capital expenditures                                                                                                                           12,802         10,891            11,415       3,672         3,669            11,412

Balance Sheet
Cash and cash equivalents                                                                                                                       18,767        23,727        20,491          23,486        41,473           41,473
Total debt                                                                                                                                    83,360          81,805        69,977          75,589         91,286           91,286
Net Debt (3)                                                                                                                                   64,593         58,078        49,486           52,103       49,813           49,813
Total Equity                                                                                                                                  140,710        131,750       129,685          129,190      125,883          125,883
Book Capitalization                                                                                                                          205,303         189,828        179,171         181,293      175,696          175,696

     ____________________
     Source: Coca-Cola FEMSA filings.
     (1) Computed as 2019 less 3QM19 plus 3Q’20.
20   (2) Includes acquisitions of long-lived assets minus proceeds from sale of long-lived assets plus acquisitions of intangible assets.
     (3) Includes Bank loans and notes payable, current and non-current portion.
You can also read