The influences of climate drivers on the Australian snow season
←
→
Page content transcription
If your browser does not render page correctly, please read the page content below
Pepler et al. Australian Meteorological and Oceanographic Journal (2015) 65:2

          The influences of climate drivers on the
                   Australian snow season
                                     Acacia S. Pepler, Blair Trewin and Catherine Ganter
                                               Climate Information Services, Bureau of Meteorology

                                       (Manuscript received November 2014; accepted November 2015)

                             The El Niño-Southern Oscillation (ENSO), Indian Ocean Dipole (IOD), and
                             Southern Annular Mode (SAM) are all widely recognised as having significant
                             impacts on rainfall and temperatures in southeastern Australia, particularly dur-
                             ing winter and spring. However, there has been little analysis of the year-to-year
                             impact of these climate drivers on Australian snow depths. This paper aims to
                             address this gap, identifying a strong decrease in snow cover throughout the
                             winter season during years of El Niño or positive SAM, with significant changes
                             in late winter and spring snow cover related to the state of the Indian Ocean Di-
                             pole. Temperatures are identified as the most important factor in determining
                             the seasonal maximum snow depth, with important implications for future snow
                             cover as a result of a strong warming trend.

Introduction
The Australian Ski Areas Association estimates that the ten mainland ski resorts in Australia increased the combined Gross
Domestic Product of New South Wales and Victoria by $1.5 billion, generating $350 million in taxation revenue and more
than 14,000 jobs (ARCC 2012). However, snow is relatively rare in Australia, with less than 5000 km 2 (0.15%) of the
mainland experiencing regular snow cover for more than a month each year, and an average maximum natural snow cover
depth of just 195 cm at Spencers Creek (1830 m), which is close to the highest elevations of existing ski fields. This results
in a high sensitivity of the Australian ski resorts to interannual variations in snow cover, with a strong and statistically sig-
nificant relationship between the number of ski days per year and natural snow depth (Pickering et al. 2010).

The low elevation of Australia’s snow fields and the strong background warming in the Australian climate (CSIRO 2014)
have motivated a number of studies of how snow occurrence is changing. Nicholls (2005) identified a 10% decline in an-
nual maximum snow depth between 1962 and 2002, with the largest decline in spring (40%), while Davis (2013) identified
that the average annual maximum snow depths were 15% lower than the 1961-1990 average during 2001-2010. This de-
cline has occurred despite no significant changes in the average precipitation at nearby stations (Davis 2013) or the fre-
quency of extreme precipitation events (Fiddes et al. 2014a), and appears primarily related to enhanced warming over the
alpine region. The larger trends in spring come as a result of this season being more marginal, with the warming trend
bringing forward the shift of snow accumulation to snow loss.

Hennessy et al. (2003, 2008) project that annual snow depth declines will continue, with the total area experiencing at least
60 days of snow cover expected to decrease by 17.5-60.3% by 2020 and 38.1-96.3% by 2050, relative to 1990 levels. The
length of the ski season (days > 50 cm) is also projected to decline by at least 30% by 2050 under the low-emissions sce-
nario at low altitude ski resorts, necessitating significant further investment in snowmaking capacity in even the most “op-
timistic” scenarios. More recently, Bhend et al. (2012) projected a 30-70% decline in annual maximum snow depth rela-
tive to 1990 levels by 2050 at Falls Creek and Mt Hotham, the major alpine resorts in Victoria, under a low-emissions sce-
nario; the average maximum snow depth declines to 15-20 cm under the most severe projection for the high emissions
scenario. Observed snow cover in the years since these projections were made add to the confidence of future projections,
with only one year between 2005-2014 recording above-average peak snow depths at Spencers Creek and particularly poor
ski conditions in 2006.

Corresponding author address: Acacia Pepler, NSW Regional Office, Bureau of Meteorology.
Email: a.pepler@bom.gov.au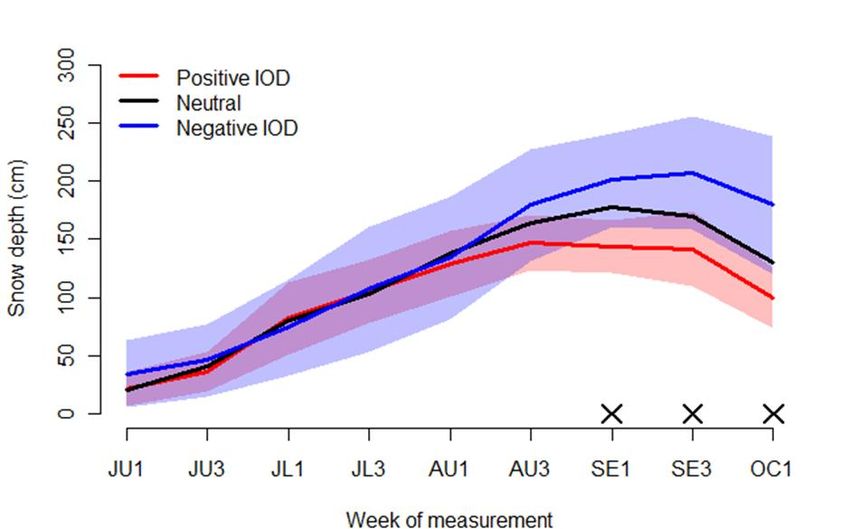
Pepler et al. Influence of climate drivers on the Australian snow season                                                   196

There is a strong understanding of the influence of major climate drivers on southeast Australian rainfall and temperatures.
Both El Niño and positive IOD events are associated with decreases in rainfall, with drought conditions in southeast Aus-
tralia (including the Snowy Mountains) most likely during years where both drivers occur in concert (e.g. McBride and
Nicholls 1983, Risbey et al. 2009, Ummenhofer et al. 2009). El Niño is also associated with increased maximum tempera-
tures in late winter and spring, but lower minimum temperatures at lower elevations owing to clear skies and lower soil
moistures (e.g. Nicholls et al. 1996, Power et al. 1998, Jones and Trewin 2000). The positive phase of the Southern Annu-
lar Mode (Hendon et al. 2007) is also associated with decreased winter rainfall in parts of southeast Australia and in-
creased spring rainfall along the southeast coast. The alpine region lies between these two regions, which causes some
uncertainty in projected precipitation impacts. However, in spring positive SAM is also associated with cooler daytime
temperatures across much of southeastern Australia, which could favour increased snowfall later in the season.

Despite this understanding there has been limited investigation of how these drivers might impact Australian snowfall and
the ski industry. Budin (1985) identified that five of the eight El Niño years between 1935 and 1984 were associated with
very low snow depths, although correlations with the SOI were generally weak (as observed more recently by Fiddes et al.
2014b). While few later studies have investigated this relationship, it has been generally assumed that neutral ENSO and
negative IOD are the best conditions for snow, with El Niño years too dry, while La Niña tends to be too warm, particular-
ly overnight. In this paper, we seek to build on the early study by Budin (1985), as well as observed relationships between
snow depths and mean sea level pressure to the south of Australia (Budin 1985, Nicholls 2005) to review the relationship
between the Australian snow season and three key climate drivers – ENSO, the IOD, and SAM.

Data
The most reliable measurements of Australian snow have been maintained by Snowy Hydro Ltd, with weekly snow depths
measured at three unaltered sites in the New South Wales Snowy Mountains since 1954, available at
http://www.snowyhydro.com.au/water/snow-depths-calculator/. The most prominent of these is the highest elevation site,
Spencers Creek, which is at an altitude of 1830 m, similar to that of the major ski resorts of the area such as Perisher Val-
ley and Charlotte Pass. From this data, we obtained fortnightly snow depths, maximum snow depth, and season length
(weeks > 50 cm). We also calculated the seasonal and June-September “snow depth-days”, which can be considered the
integral of the snow-depth curve – for each observation this is the number of days between observations multiplied by the
average depth of the observations, summed up over the season.

Data was also available for Deep Creek (1620 m) and Three Mile Dam (1460 m). The annual snow depth-days at these
sites had correlations of +0.88 and +0.78 with Spencers Creek values, with correspondingly similar relationships between
snow depth days and climate influences. However, due to their elevation the snow season is substantially shorter, with
only one in three years measuring maximum snow depths of at least 50 cm at Three Mile Dam. For this reason the paper
will focus wholly on the more rigorous results from Spencers Creek, which better matches the conditions experienced by
the alpine regions of southeast Australia and the major winter sports resorts. However, it is important to note that the major
resorts of Thredbo, Mt Hotham, Mt Buller and Falls Creek all have substantial areas of terrain below 1600 m in altitude,
with a maximum elevation of 1565 m at Mt Baw Baw; these lower altitude snow areas may be more heavily impacted by
snowfall variability than Spencers Creek.

There are no comparable snow depth data sets for the Victorian mountains, with the best available data (Fiddes et al.,
2014a) starting in the 1980s, and hence this study will focus on the New South Wales data. While Victorian seasonal snow
depths would be expected to be closely correlated with those in New South Wales, extension of these results to Victoria
should be done with some caution, particularly as the weather systems that produce the majority of snowfall may differ
across the ranges.

ENSO and IOD state (Table 1) were drawn from the years listed on the Bureau of Meteorology’s website 1 as well as recent
IOD declarations. These are based on a combination of atmospheric and oceanic indicators, with IOD classifications since
1958 drawn from Saji and Yamagata (2003). Note that these classifications do not reference the start date of the event; in
some cases, the ENSO or IOD event may not have become established until spring, and would be expected to have a
weaker impact on the winter season.                The Southern Oscillation Index (SOI) was obtained from
http://www.bom.gov.au/climate/current/soi2.shtml, while SAM was represented using the Marshall (2003) index due to its
longer period of record (1957-present), retrieved from http://www.nerc-bas.ac.uk/icd/gjma/sam.html. Both the SOI and

1
    http://www.bom.gov.au/climate/enso/enlist/, http://www.bom.gov.au/climate/IOD/positive/, etc.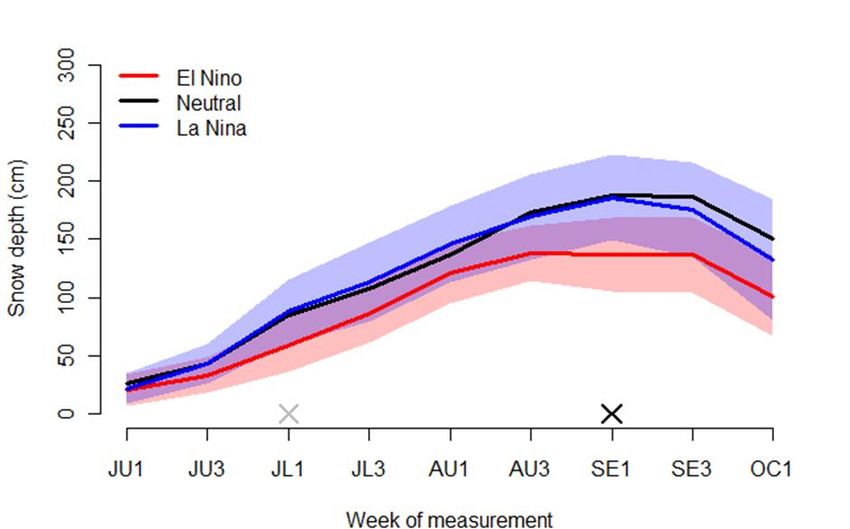
Pepler et al. Influence of climate drivers on the Australian snow season                                                                                            197

SAM were averaged over the snow season June-September for seasonal correlations, with statistical significance calculat-
ed using a Student’s t-test and assessed at the 95% level.

Daily temperature data have been retrieved from the Cabramurra temperature station from 1962-2013. This station record
is of high quality and has been homogenised to remove non-climate/weather factors in the record (Trewin 2013). This sta-
tion is the only long-term station in the alpine region of Australia and has been frequently used for similar studies
(Nicholls 2005, Davis 2013). The Cabramurra results may not be fully representative of the alpine regions further south;
Cabramurra is a very exposed site on the western side of the ranges, and its July daily minimum temperatures are less well-
correlated with more sheltered sites on the eastern side of the Great Dividing Range (0.76 at Perisher Valley, 0.65 at Char-
lotte Pass, 0.55 at Thredbo Village 2) than might be expected from their close proximity. (Unfortunately, none of those
three sites have sufficiently long or complete temperature data sets to enable their own relationships with climate drivers to
be independently assessed). Daily 9am wet bulb temperature data has been retrieved from the Omeo weather station, 40
km from the Falls Creek alpine resort; however, these data are unhomogenised and may have systemic issues.

Table 1             Table 1. List of years by Bureau of Meteorology ENSO and IOD classification, 1958-2013. Note that 1954-
                    1956 are La Niña years and 1957 El Niño; no IOD information is available for these years.

                                       pIOD                                   Neutral                                  nIOD
                                       1963, 1972, 1977, 1982,                1965, 1969, 1987, 1991,
              El Niño                                                                                                  1993
                                       1994, 1997, 2006                       2002, 2009
                                                                              1959, 1962, 1966, 1968,
                                                                              1976, 1978, 1979, 1980,
                                                                                                                       1958, 1960, 1989, 1992,
              Neutral                  1961, 1967, 1983, 2012                 1981, 1984, 1985, 1986,
                                                                                                                       1996, 2013
                                                                              1990, 1995, 2001, 2003,
                                                                              2004, 2005
                                                                              1970, 1973, 1988, 1998,                  1964, 1971, 1974, 1975,
              La Niña                  2007, 2011
                                                                              1999, 2000, 2008                         2010

The average rainfall across three high-quality sites (Lavery et al. 1992) southwest of the Snowy Mountains (Mitta Mitta,
Whitlands and Beechworth) has been used as a proxy for regional precipitation. These sites have a stronger relationship
with maximum snow depth than either the district average rainfall derived from the AWAP gridded product (Jones et al.
2009) or alpine rainfall stations such as Perisher Valley. This reflects issues with gridded datasets in areas of high topogra-
phy, with few high-altitude stations available before the 1990s (Jones et al. 2009), as well as issues with accurate precipita-
tion measurements at alpine sites when it falls as snow. It is not unusual for rain gauges to suffer blockages in winter due
to the accumulation of ice and snow, while wind-blown snow creates additional complication for the use of the alpine rec-
ords. The combination of the maximum temperature and precipitation data allows us to classify each winter as both
wet/dry and warm/cold, based on whether the seasonal values were above/below the 1962-2013 median.

Throughout the paper, significance is assessed using a two-sided t-test, with results reported at the 95% confidence level
unless otherwise stated.

Results
The influence of climate variables on snow depths
Prior to assessing the relationship between snow depth and climate drivers, it is useful to reassess the relationship between
snow depth and both precipitation and temperatures in alpine regions. As previously observed in Nicholls (2005) and Da-
vis (2013), the correlations between maximum snow depth at Spencers Creek and both mean winter maximum temperature
at Cabramurra and alpine-region precipitation are strong and similar in magnitude, reflecting a similar contribution from
both factors. Using the 1962-2013 period from this paper, the correlation coefficients are -0.61 and +0.63 respectively,

2
 Correlations are taken over the period of parallel record between the named sites and the 1962-1999 Cabramurra site. The listed correlations can be compared with those
between Cabramurra and similarly exposed Victorian sites, Falls Creek (0.84) and Mount Hotham (0.83).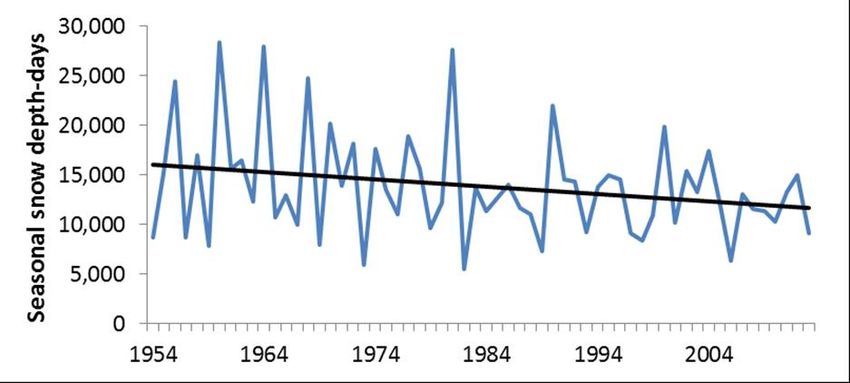
Pepler et al. Influence of climate drivers on the Australian snow season                                                    198

with a weaker correlation between snow depth and minimum temperatures (-0.36). These relationships have been used in
previous papers to derive linear regressions to extend the snow record (Nicholls 2005; Davis 2013).

Both above-average seasonal precipitation and below-average temperatures are necessary prerequisites for heavy snow
seasons (Figure 1); of the 10 years with snow depths greater than 250 cm, all but two had both below-median temperatures
and above-median precipitation, with the remaining two years very close to median for the absent factor (-0.6 mm and
+0.2°C respectively). Warm weather seems to have a slightly stronger impact on seasonal snowfall than below average
precipitation, with average seasonal snow depths of 172 cm during wet, warm years compared to 187 cm during cold, dry
years, although these differences are not significant. Maximum temperatures also have a substantially larger correlation
with the season length (-0.43) than the mean precipitation does (+0.26) , reflecting a particularly strong relationship be-
tween temperature and snow depth in late September and early October, consistent with results in Nicholls (2005).

This result is of particular importance given ongoing warming over the coming century, with 19 of the past 21 years hav-
ing winter temperatures at Cabramurra above the long-term median. The warming trend is most noticeable in September,
where the 2000-2013 average maximum temperature at Cabramurra was a remarkable 2.2°C above the average of all pre-
vious years with data available (1962-1999). The Australia-wide mean maximum temperature was 1.2°C above average
using the same base period. Nation-wide, temperature anomalies during the last decade are higher for September than for
any other month, followed by August, July, and October.

Figure 1            The total number of seasons with Spencers Creek maximum snow depth in various categories for winter
                    mean maximum temperatures and total precipitation above or below the 1962-2013 median. The number of
                    years in each snow depth category is indicated in parentheses; note that the warm/dry and cold/wet combina-
                    tions (N=15) are more common than wet/warm or dry/cold (N=11)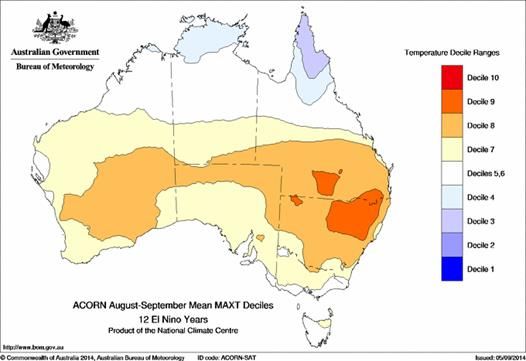
Pepler et al. Influence of climate drivers on the Australian snow season                                                 199

Figure 2            Annual June-September snow depth-days (cm-days) at Spencers Creek, 1954-2013, with a linear trend line
                    shown.

The increase in alpine temperatures is associated with a 10% decline in the average maximum snow depth and a 5% de-
cline in the length of the snow season during the 2000-2013 period relative to 1954-1999, with largest declines in snow
depths in late September (-18%) and early October (-30%). This is particularly evident in a lack of heavy snow seasons in
recent years, with a 10% decline in June-September snow depth-days associated with an absence of any seasons with
depth-days above 20,000 since 1990 (Figure 2). It may also be associated with a shift in the date of peak snowfall; this was
11 days earlier during 2000-2013 than 1954-1999, with 2011 and 2014 the first snow seasons on record to observe peak
snow depths during July.

It is important to note that, as observed in Nicholls (2005), using temperature alone as a predictor tends to overestimate
observed trends, in part because individual heavy snow events are a large contributor to seasonal totals, which depend not
only on the presence of precipitation but also its timing and relationship with prevailing temperatures. These heavy events
may also be less impacted by changing temperatures than lighter snowfall is (Fiddes et al. 2014b). Furthermore, winter
rain events associated with above zero temperatures can decrease snow depths, as observed during the early winter of
2013. However, daily snow depth data is of lower reliability and is only available from ski resorts (Fiddes et al. 2014b),
limiting the potential for analysis of heavy snow events or significant snowmelt events.

The influence of climate drivers on snow depths
As observed in previous studies (Fiddes et al. 2014b), correlations between seasonal SOI and the length of the snow season
are not statistically significant, with only weakly significant correlations between SOI and maximum snow depth (+0.29),
despite strong relationships between ENSO and both rainfall and temperature in southeast Australia (e.g. Risbey et al.
2009, Power et al. 1998). This appears to reflect a distinct nonlinearity in the relationship between ENSO and snowfall –
while the maximum snow depth is, on average, 23% lower during El Niño years than in neutral years, there is little dis-
cernible difference in snow patterns between La Niña and neutral seasons (Figure 3). For this reason, while the decline in
El Niño years relative to neutral years is statistically significant for both maximum snow depth and weekly snow depths
from late August onwards, the difference between El Niño and La Niña years is generally not significant.

The tendency for El Niño years to see less snow is apparent across the snow season but particularly from mid-August on-
wards, with September snow depths 28% lower in El Niño years and early October snow 34% lower, resulting in a 25%
decrease in total snow depth-days. This is consistent with well above average maximum temperatures during the August
and spring of El Niño years in Cabramurra (+ 0.8°C) and much of eastern Australia (Figure 4); the influence of ENSO on
early winter maximum temperatures at Cabramurra is minimal.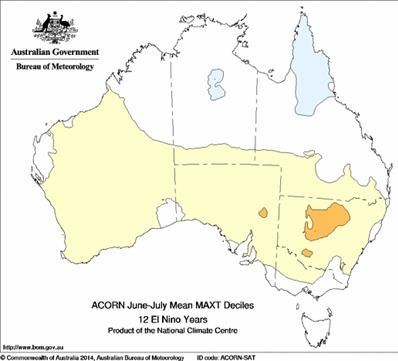
Pepler et al. Influence of climate drivers on the Australian snow season                                                       200

Figure 3            Fortnightly average snow depths in El Niño, La Niña and Neutral years, 1954-2013, with the 90% confi-
                    dence interval about the mean indicated for the El Niño and La Niña periods (as calculated using a t-test). X-
                    axis indicates the week, with JU1 the first week of June, JL3 the third week of July, etc. More precise dates
                    are unavailable as the actual dates of snow measurement differ between years. Grey crosses above the X-
                    axis indicate weeks where the difference between the means in El Niño and La Niña years is statistically
                    significant at the 90% level using a two-sided t-test, with black crosses indicating where the difference is
                    statistically significant at the 95% level.

This is an interesting contrast to results for low elevation sites. In a study of 53 years of snowfall data between 1949 and
2001 at Bukalong (790 metres elevation), near Bombala, Hague and Trewin (2014) found that snowfall was suppressed in
La Niña years, but that there was no clear difference between El Niño and neutral years once two extreme years, 1949 and
1987 (the second of which saw 104 centimetres fall in a single event), were removed from consideration. It is not unex-
pected that low-elevation sites may have different relationships with large-scale drivers than Spencers Creek, with individ-
ual heavy events of much greater importance at lower elevation sites where snow is infrequent. Importantly, while some
years with notable low-elevation snowfalls, such as 2000, have had above-normal seasonal accumulations at Spencers
Creek, others, such as 1965, have been below normal at high elevations. The results in this paper for other drivers can
therefore be applied to high altitude alpine sites only.

The nonlinear impacts of ENSO may be a relatively recent phenomenon. When the database was divided into two 30-year
periods (1954-1983 and 1984-2013), both periods showed declines of 20-30% in peak snow depth in El Niño years. How-
ever, while La Niña years in 1954-1983 had peak snow depths 10% higher than neutral years, during 1984-2014 both La
Niña years (-20%) and El Niño years (-25%) showed similar declines in average maximum snow depths relative to neutral
years. The significantly larger changes in snow depths during La Niña years relative to other periods is an area in need of
further study, and may have serious implications for the future prevalence of “good” snow seasons. However, the short
length of reliable snow records in Australia makes it difficult to examine temporal changes in the ENSO-snow relationship
with any robustness.
Pepler et al. Influence of climate drivers on the Australian snow season 201
Figure 4 Composite June-July (left) and August-September (right) maximum temperature deciles for strong El Niño
years, 1900-2012. For further details and composite plots see
http://www.bom.gov.au/climate/enso/ninocomp.shtml
The Indian Ocean Dipole was found to have slightly stronger relationships with peak snow depth than the SOI by Fiddes et
al. (2014b), with a correlation of -0.35 between the Dipole Mode Index (an index of the IOD) and total snow accumula-
tion. The IOD appears to only have a strong influence on late August and spring snow cover (Figure 5), reflecting the ten-
dency of IOD events to emerge during late winter and early spring. Maximum snow depths with positive IOD are 26%
lower than negative IOD years, but snow depths later in the season are 44% lower (in early October), with snow depths
significantly different from early September onwards. Correspondingly, the total snow depth-days in positive IOD years
are 14% lower than neutral years, and 24% higher in negative IOD years. The IOD is also a major contributor to the most
significant snow years, with 58% of negative IOD years recording at least 200 cm of snow.
Figure 5 As in Figure 3, but for positive, negative, and neutral IOD years, 1958-2013.
Temperature impacts again appear to have a strong influence on snow depths, with August-September temperatures at
Cabramurra 0.8°C above the 1962-2013 average in positive IOD years, and 0.8°C below average during negative IOD
years. In contrast, despite the strong link between both phases of the IOD and winter-spring rainfall across southeast Aus-
tralia (e.g. Risbey et al. 2009), across our three-station series the June-September rainfall during positive IOD years is 36%
lower than neutral years, compared to just a 9% increase in rainfall during negative IOD years.Pepler et al. Influence of climate drivers on the Australian snow season 202
Surprisingly, although Victorian winter-spring rainfall is significantly enhanced with both drivers in the wet phase (e.g.
Risbey et al. 2009), the interaction between ENSO and the IOD has little impact on maximum alpine snow depths (Table
2) or on total snow depth-days (not shown).This may be related to distinctly different nonlinearities in the impacts of these
drivers on maximum temperatures and rainfall, both of which have correlations of ~0.6 with maximum snow depth. While
the combination of La Niña and negative IOD is associated with distinctly lower maximum temperatures than either event
individually, there is no corresponding enhancement of rainfall, while the opposite pattern is observed for the El Ni-
ño/positive IOD combination (larger dry anomalies, no change in temperature anomalies).
Table 2 Average peak snow depth at Spencers Creek (cm) across combinations of ENSO/IOD years, 1958-2013,
based on years in Table1. Results are not shown for groups with less than three years (*). Note that due to
the small sample sizes, none of these means are significantly different from each other or from the all-years
mean at the 95% level.
pIOD Neutral nIOD
El Niño 162.9 168.7 *
Neutral 179.7 208.9 234.3
La Niña * 180.6 240.8
There is a clear, though not significant, decrease in both maximum snow depths and total snow depth-days during La Niña
years in the absence of a negative IOD event. This is largely a result of temperature variations, with an average maximum
temperature anomaly of +0.6°C when La Niña is combined with neutral conditions, or -0.9°C when combined with nega-
tive IOD conditions; the average maximum temperature across all La Niña years is close to average (+0.15°C). It is also
worth noting that the only two years with maximum snow depths below 100 cm (1982 and 2006) featured both El Niño
and positive IOD. Both of these years were extremely dry in the broader region, with 1982 the driest winter in the 1954-
2013 period for the three high quality rainfall sites. Additionally, 1982 and 2006 were the two driest June-September peri-
ods within the years 1954-2013 at seven selected long-term rainfall stations on the northern and western side of the Alps.
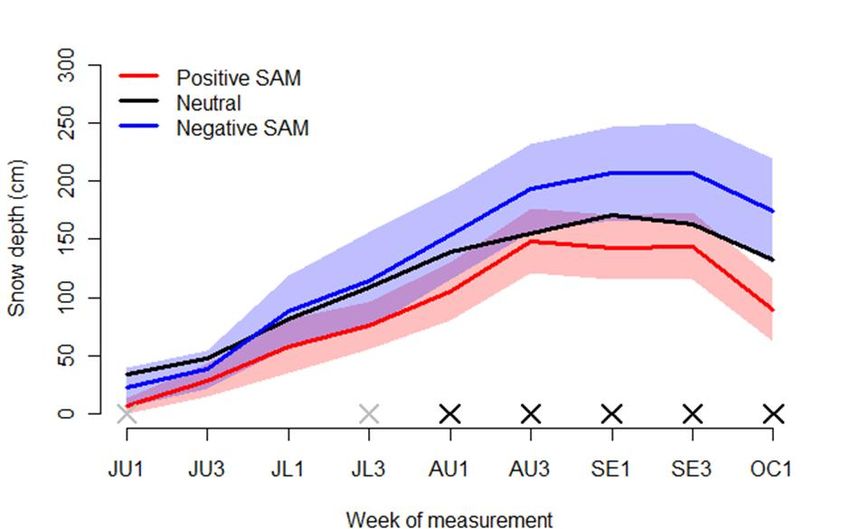
The Southern Annular Mode is closely related to the positioning of the midlatitude westerlies, with positive SAM associ-
ated with decreased rainfall in parts of southeast Australia during the winter months (a southerly shift in midlatitude west-
erlies), as well as increased maximum temperatures during spring (Hendon et al. 2007). The June-September SAM has
statistically significant correlations with the maximum snow depth (-0.42), snow season length (-0.32) and snow depth-
days (-0.41), with strongest correlations during the second half of the season. This is not surprising, as Nicholls (2005)
found a very strong relationship between snow depths at Spencers Creek and seasonal mean sea level pressure to the south
and east of Australia, while Budin (1985) observed very strong relationships between Spencers Creek snow depths and the
mean position of the subtropical ridge.
For consistency with the frequencies of ENSO events and to better allow comparison between the different drivers, we
define a positive (negative) SAM season by average SAM values above (below) 0.7, giving 50% of years classified as neu-
tral years and 25% in each of positive and negative SAM. Using these definitions, the impact of SAM is slightly stronger
than IOD, with average maximum snow cover in positive SAM seasons 32% below that in negative SAM, and total snow
depth-days 42% lower. This difference between the two SAM phases results from a substantial decrease in early season
snow cover in years with positive SAM, and a substantial increase in late-season snow during negative SAM (Figure 6),
with mean snow depth significantly different from early August onwards.
SAM is substantially more variable on a weekly and monthly basis than other climate drivers, with 30% of June-
September periods including both a month with SAM above 1.5 and one with SAM below -1.5 (17% using a threshold of
2), suggesting that fortnightly or monthly SAM may be a better indicator of snow depth changes. However, correlations
between monthly SAM and fortnightly changes in snow depth are only statistically significant during June and early July,
in contrast to the strong relationship between seasonal SAM and late-season snow accumulations, while the difference in
the average fortnightly accumulation between positive and negative SAM months is only statistically significant during the
first week of July.
Despite these observed relationships, no combination of indices is a guarantee of a good or bad snow season. The combi-
nation of strongly positive SAM (+1.5) and positive IOD still resulted in an above-average peak snow depth during 2012Pepler et al. Influence of climate drivers on the Australian snow season 203 (216 cm) despite dry conditions across much of southeast Australia, while a very poor snow year in 1988 (maximum depth 131 cm) featured both a La Niña and negative SAM (-1.78). Figure 6 As in Figure 3, but for JJAS SAM >= 0.7,
Pepler et al. Influence of climate drivers on the Australian snow season                                                   204

Conclusions
The Australian ski industry and alpine environment is highly sensitive to variations in snow cover, with maximum snow
depths at Spencers Creek ranging from 361 cm in 1981 to 85 cm in 2006. Particularly in the context of ongoing declines in
both the maximum snow depth and the ski season length, including a 10% decline in the 2000-2013 maximum snow depth
at Spencers Creek relative to 1954-1999, it is of relevance to assess the climatic factors that affect both peak snowfall and
season duration.

The relative impact of ENSO, IOD and SAM conditions can be easily compared due to the relatively similar frequency of
events, with the SAM state in this paper defined such that 25% of years fall into each of “negative” and “positive” condi-
tions. At Spencers Creek, the seasonal mean Southern Annular Mode has the strongest impact on the snow season. In years
with June-September average SAM greater than 0.7, the maximum snow depth is 32% lower than under negative SAM
and the snow season is four weeks shorter than neutral years, both of which are statistically significant at the 99% confi-
dence level. This is consistent with previous studies such as Nicholls (2005) and Budin (1985), who observed very strong
relationships between seasonal maximum snow depths at Spencers Creek and mean sea level pressure to the south and east
of Australia. The Indian Ocean Dipole also has a significant impact on snow depths during September and early October as
well as on the seasonal maximum depth, but has little impact in the early- to mid-season.

Interestingly, while El Niño is associated with decreases in snow cover throughout the season, there is no discernible im-
provement in the ski season during La Niña years; indeed, in La Niña years without a coincident negative IOD event both
the maximum snow depth and the total snow depth-days decline relative to neutral years. This is likely related to the role
of both precipitation and temperatures in influencing the impact of individual snowfall events, as the increased precipita-
tion during La Niña events may fall as either rain or snow depending on ambient temperatures. This may be a recent phe-
nomenon, with La Niña events during the earlier period 1954-1983 associated with slightly above average maximum snow
depths, and is in need of further research.

To summarise, the interplay between snow depth and climate drivers is significant, but favourable drivers do not necessari-
ly result in above average snowfall. This reflects a strong relationship between annual snow depth maxima and the timing
of individual heavy snow events as well as the type of precipitation which falls (e.g., rain versus snow), with reliable daily
snow data required to better understand this relationship. Importantly, conditions favourable for artificial snowmaking
have different relationships with major climate drivers compared to those desired for natural snow conditions. This there-
fore gives capacity for artificial snowmaking to enhance total snow depths, under conditions which are less favourable for
natural snow falls, potentially providing some buffering for ski industry operators.

Acknowledgments
The authors would like to thank Colin Hackworth and the Australian Ski Areas Association for providing snowmaking
information, as well as David Jones, Paul Gregory, Neville Nicholls and one anonymous reviewer, whose reviews and
comments have significantly improved the quality of this paper.

References
ARCC, 2012. The Economic Significance of the Australian Alpine Resorts: Winter season 2011. Prepared for the Alpine
   Resorts Co-ordinating Council by the National Institute of Economic and Industry Research, Clifton Hill. Available at
   http://asaa.org.au/resources/
Bhend, J., Bathols, J., and Hennessy , K. 2012. Climate change impacts on snow in Victoria. Report for the Victorian De-
   partment of Sustainability and Environment (DSE) by the Centre for Australian Water and Climate Research
   (CAWCR).
Budin, G.R. 1985. Interannual variability of Australian snowfall. Aust. Met. Mag., 33, 145-159
CSIRO, 2014. State of the Climate, 2014. Produced by the Australian Bureau of Meteorology and Commonwealth Scien-
   tific            and          Industrial            Research            Organisation.           Available              at
   http://www.csiro.au/Outcomes/Climate/Understanding/SOC.aspx
Davis, C. J. 2013. Towards the development of long-term winter records for the Snowy Mountains. Aust. Met. Oceanogr.
   J., 63, 303-313
Fiddes, S. L., Pezza, A. B. and Barras, V. 2014a. Synoptic climatology of extreme precipitation in alpine Australia. Int. J.
   Climatol., doi: 10.1002/joc.3970
Pepler et al. Influence of climate drivers on the Australian snow season                                               205

Fiddes, S. L., Pezza, A. B. and Barras, V. 2014b. A new perspective on Australian snow: now and into the future. Atmos.
   Sci. Lett.. doi: 10.1002/asl2.549
Hague, B. and Trewin, B. 2014. An investigation into a 53-year sub-alpine snow record. Bull. Aust. Met. Oceanogr. Soc.,
   27, 65-70.
Hendon, H., Thompson, D. W. J., and Wheeler, M. C. 2007. Australian Rainfall and Surface Temperature Variations As-
   sociated with the Southern Hemisphere Annular Mode. J. Climate, 20, 2452–2467.
Hennessy, K. J., Whetton, P. H., Bathols, J., Hutchinson, M., and Sharples, J. 2003. The impact of climate change on snow
   conditions in Australia. Consultancy report for the Victorian Dept of Sustainability and Environment, NSW National
   Parks and Wildlife Service, Australian Greenhouse Office and the Australian Ski Areas Association. CSIRO Atmos-
   pheric Research, Aspendale. Available at www.cmar.csiro.au/e-print/open/hennes sy_2003a.pdf
Hennessy, K.J., Whetton, P.H , Walsh, K., Smith, I.N., Bathols, J.M., Hutchinson, M.F. and Sharples, J.J. 2008. Climate
   change impacts on snow conditions in mainland Australia and adaptation at ski resorts through snowmaking. Clim. Res.,
   35, 255–70.
Jones, D. A. and Trewin, B. C. 2000. On the relationships between the El Niño–Southern Oscillation and Australian land
   surface temperature. Int. J. Climatol., 20: 697–719. doi: 10.1002/1097-0088(20000615)20:73.0.CO;2-A
Jones, D.A., Wang, W. and Fawcett, R. 2009. High-quality spatial climate data-sets for Australia. Aust. Met. Oceanogr. J.,
   58, 233-248.
Lavery, B., Kariko, A. and Nicholls, N. 1992. A historical rainfall data set for Australia. Aust. Met. Mag., 40, 33-39.
Marshall, G. J., 2003. Trends in the Southern Annular Mode from observations and reanalyses. J. Climate, 16, 4134-4143.
McBride, J., and Nicholls, N. 1983. Seasonal relationships between Australian rainfall and the Southern Oscillation. Mon.
   Wea. Rev., 111, 1998–2004
Nicholls, N., Lavery, B., Frederiksen, C., Drosdowsky, W. and Torok, S. 1996. Recent changes in relationships between
   the El Niño-Southern Oscillation and Australian rainfall and temperature. Geophys. Res. Lett., 23, 3357-60.
Nicholls N. 2005. Climate variability, climate change and the Australian snow season. Aust. Met. Mag., 54, 177–185.
Pickering, C.M. and Buckley, R.C. 2010. Climate response by the ski industry: the shortcomings of snowmaking for Aus-
   tralian resorts. Ambio, 39, 430-8.
Power, S., Tseitkin, F., Torok, S. J., Lavery, B., Dahni, R., and McAvaney, B. 1998. Australian temperature, Australian
   rainfall and the Southern Oscillation, 1910–1992: Coherent variability and recent changes. Aust. Met. Mag., 47, 85–101.
Risbey, J. S., Pook, M. J., McIntosh, P. C., Wheeler, M. C., and Hendon, H. H. 2009. On the remote drivers of rainfall
   variability in Australia. Mon. Wea. Rev., 137, 3233–3253, doi: 10.1175/2009MWR2861.1.
Saji, N. H., and Yamagata, T. 2003. Possible impacts of Indian Ocean dipole mode events on global climate. Clim. Res.,
   25, 151-169.
Trewin, B.C. 2001. Extreme temperature events in Australia. Ph.D thesis, School of Earth Sciences, University of Mel-
   bourne.
Trewin, B.C. 2010. Site location effects on measured precipitation in highly exposed coastal and alpine environments.
   2010 AMOS National Conference, Canberra, 27-29 January 2010.
Trewin, B. 2013. A daily homogenized temperature data set for Australia. Int. J. Climatol., 33, 1510–1529. doi:
   10.1002/joc.3530
Ummenhofer, C. C., England, M. H., McIntosh, P. C., Meyers, G. A., Pook, M. J., Risbey, J. S., Gupta, A. S., and Taschet-
   to, A. S. 2009. What causes southeast Australia’s worst droughts? Geophys. Res. Lett., 36, L04706,
   doi:10.1029/2008GL036801.
You can also read


