Analyst Meeting November 2018 - AWS
←
→
Page content transcription
If your browser does not render page correctly, please read the page content below
Analyst Meeting November 2018

Disclaimer
Forward-looking statement
   This presentation contains information that includes or is based on forward-looking statements within the meaning of the federal securities law that are
   subject to various risks and uncertainties that could cause our actual results to differ materially from those expressed or implied in such statements. Such
   factors include, but are not limited to: weakening of economic conditions that could adversely affect the level of demand for our products; pricing pressures
   generally, including cost-containment measures that could adversely affect the price of or demand for our products; changes in foreign exchange markets;
   legislative and regulatory actions; the failure to satisfy any of the closing conditions of the K2M Group Holdings, Inc. merger agreement, including the
   receipt of any required regulatory approvals or approval by K2M's stockholders of the merger; unexpected charges or expenses in connection with the
   acquisition of K2M; unanticipated issues arising in connection with clinical studies and otherwise that affect U.S. Food and Drug Administration approval of
   new products; potential supply disruptions; changes in reimbursement levels from third-party payors; a significant increase in product liability claims; the
   ultimate total cost with respect to the Rejuvenate and ABG II matter; the impact of investigative and legal proceedings and compliance risks; resolution of
   tax audits; the impact of the federal legislation to reform the United States healthcare system; costs to comply with the European Medical Devices
   regulation; changes in financial markets; changes in the competitive environment; our ability to integrate acquisitions, including the acquisition of K2M;
   and our ability to realize anticipated cost savings. Additional information concerning these and other factors is contained in our filings with the U.S.
   Securities and Exchange Commission, including our Annual Report on Form 10-K and Quarterly Reports on Form 10-Q.

Non-GAAP financial measures
   Organic Sales Growth and Adjusted Net Earnings per Diluted Share as shown in this presentation are non-GAAP financial measures. These adjusted
   financial measures should not be considered in isolation or as a substitute for reported sales growth and net earnings per diluted share, the most directly
   comparable GAAP financial measures. These non-GAAP financial measures are an additional way of viewing aspects of our operations that, when viewed
   with our GAAP results and the reconciliations to corresponding GAAP financial measures, provide a more complete understanding of our business. Refer to
   Appendix A attached to this presentation for the definition of these non-GAAP financial measures and for the reconciliations of non-GAAP financial
   measures to the most directly comparable GAAP measures.

                                                                                                                                                                   2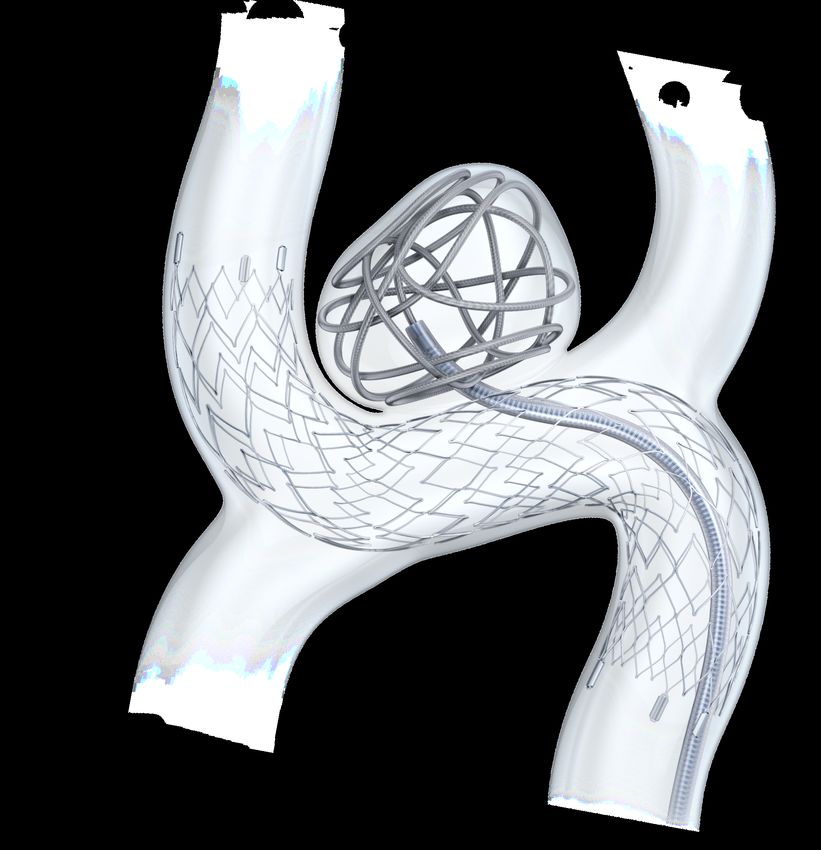
Agenda
                                       Kevin Lobo
  Overview                             Chairman and Chief Executive Officer
                                       Mark Paul
  Neurovascular Physician Panel        President, Neurovascular Division
                                       Guest Speakers:
                                       Alex Coon, MD
                                       Adjunct Professor, Neurosurgery, Johns Hopkins Medical Center
                                       Brian Jankowitz, MD
                                       Assistant Professor, Neurosurgery, University of Pittsburgh Medical Center
                                       Ryan McTaggart, MD
                                       Associate Professor, Radiology, Neurology & Neurosurgery, Warren Alpert
                                       Medical School of Brown University
                                       Dr. Xavier Berling
  Spotlight on: Trauma & Extremities   President, Trauma & Extremities
                                       Gordon Van Ummersen
                                       Vice President & General Manager, Extremities

                                       Andy Pierce
  Spotlight on: Endoscopy              Group President, MedSurg

                                       Guest Speaker:
                                       Martin I. Newman, MD
                                       Plastic Surgeon, Cleveland Clinic Florida
                                       Viju Menon
  CTG Update                           Group President, Global Quality & Operations
                                       Glenn Boehnlein
  Financial Outlook                    Vice President, Chief Financial Officer

  Investor Q&A                         Stryker Leadership Team

                                       Orthopaedics, MedSurg, Neurotechnology & Spine Products
  Product Fair                                                                                                      3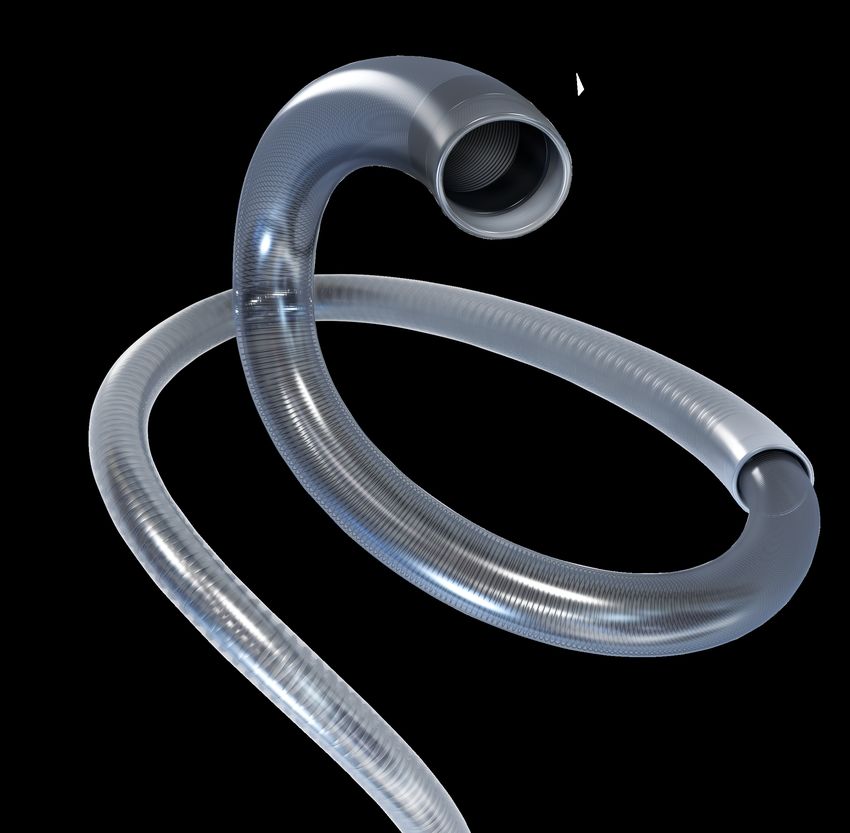
Mission

   Together with our customers,
          we are driven
    to make healthcare better.
Values

     Integrity         Accountability        People         Performance
  We do what’s right   We do what we say   We grow talent     We deliver

                                                                           4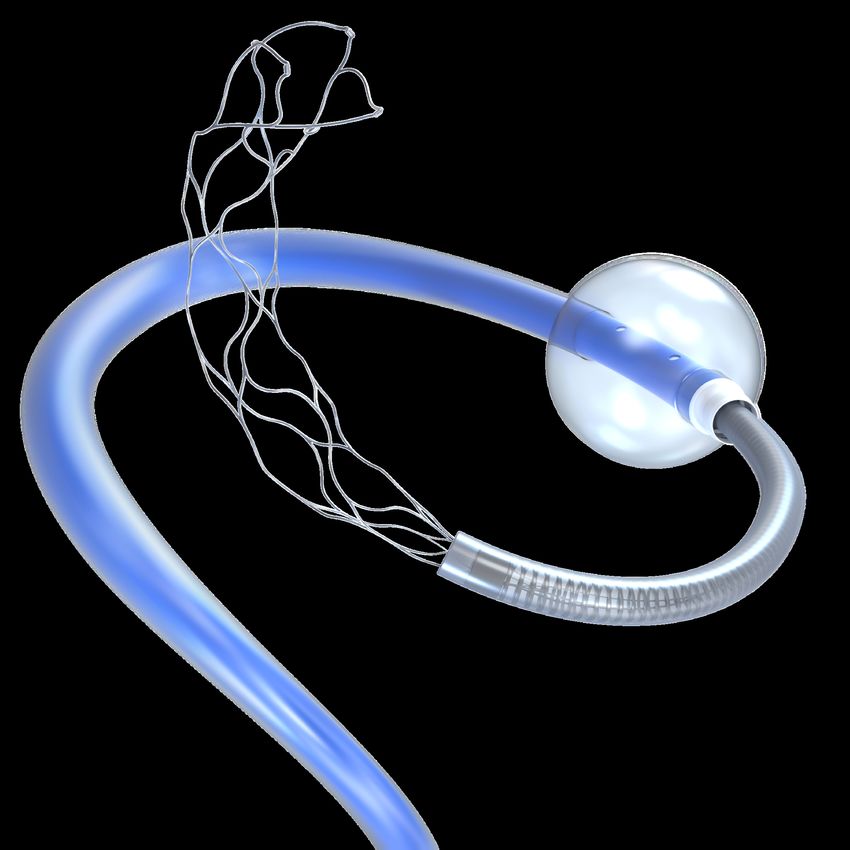
Changes to Stryker Leadership Team

Timothy Scannell                           Andy Pierce                                Bijoy Sagar
President and Chief                        Group President,                           Vice President, Chief
Operating Officer                          MedSurg                                    Digital Technology
                                                                                      Officer

                      Viju Menon                              Spencer Stiles
                      Group President,                        Group President,
                      Global Quality and                      Neurotechnology,
                      Operations                              Instruments and Spine                           5
New division presidents

     Dylan Crotty             Brent Ladd
     President, Instruments   President, Endoscopy

                                                     6
Our company strategy
 Drive market leading growth and achieve category leadership in
 MedSurg Equipment, Orthopaedics, and Neurotechnology/Spine

    Customer focus                     Innovation                   Globalization              Cost transformation
 • Intense customer             • Make healthcare better       • Focus resources, investment   • Drive operational efficiency
   commitment and dedication      through evidence-based         and talent on key global        to reinvest in growth
   through business unit          products and services that     markets                       • Continuously reduce costs
   specialization                 improve outcomes             • Strengthen alignment among      and expand margins to
 • Achieve highest levels of    • Drive growth through           franchises, country teams       optimize shareholder value
   customer engagement            disciplined investment in      and global functions
   through innovative, high       R&D and BD
   quality products and
   collaboration

                                  Talent offense – People and culture
                               Quality first – Top tier products and services
                                                                                                                                7
Diverse global Med Tech leader…

Committed to achieving category                         Neuro Powered
                                                          Instruments

leadership                                                     4%
                                                  Neurovascular CMF
                                                       5%         2%
                                                                            Knees
                                                                            13%
                                                Spine
                                                 6%

#1 or #2 market shares across majority
                                         Sustainability                                Trauma &
                                         Solutions 2%                                 Extremities
                                                                 2017                    12%

of divisions                             Endoscopy             net sales
                                           13%
                                                               $12.4B                     Hips
                                                                                          10%

                                                                                      Other
                                                     Medical                           3%
                                                      16%
                                                                        Instruments
                                                                            14%

                                                                                                    8
Our history of growth
        Net Sales ($B)
                          ~12B+
                         $12.4 B
  $12
 12

  $10
 10

  $8
  8

  $6
  6

  $4
  4

  $2
  2

  00
        1979
        79                   2017
                             2017

                                    9
Strong top line momentum…
Organic sales growth at high end of Med Tech

   • Decentralized operating model – sales, marketing, R&D, and business
     development
   • Strong new product pipeline across our divisions
   • Significant investments in R&D driving industry leadership in many areas
     (e.g., Robotics, 3-D printing, and advanced imaging)
   • Disciplined and active business development to augment internal
     investments
   • 2018 represents another year of accelerating organic sales growth
   • Well positioned to deliver strong top-line growth in 2019+
                                                                                10
… continued focus on driving margin expansion
• Product lifecycle management well underway
• Procurement progress continues
• Progress on shared services
• Modernization of our IT systems is progressing
Combined CTG efforts driving 30-50 basis points of annual operating
margin expansion, despite significant acquisition dilution
11Mergers and acquisitions
Color key:
We continue to enhance our portfolio’s depth and Core business
breadth with strategic mergers and acquisitions. Adjacency
Pending
Synergetics Ivy Sports Invuity, Inc.
USA’s Neuro Medicine,
Portfolio LLC
Concentric Patient Safety Vertebral Compression NOVADAQ K2M Group
Technologies Fracture Portfolio from BD Technologies, Inc. Holdings, Inc.
Berchtold
Holding SafeWire
Restore
CoAlign Muka Surgical LLC, Hygia Health
Orthovita Trauson Innovations, Inc. Metal DBA Instratek Services
2011 2012 2013 2014 2015 2016 2017 2018
Memometal MAKO CHG Sage SafeAir AG
Vexim
Hospital Products
Beds
Surpass Pivot Medical Stanmore Implants Entellus
Worldwide Medical, Inc.
Neurovascular Small Bone Physio-Control HyperBranch Medical
Innovations International Technology, Inc.
12Summary
• 2018 will be another year of strong organic sales & earnings growth
• Confident that we will grow organic sales at the high end of Med Tech in 2019
• Organizational changes position us to deliver continued robust growth
• Healthy new product cadence and M&A execution
• CTG translating into meaningful and sustainable operating margin expansion
• Capital allocation priorities remain unchanged – M&A, Dividends and
Buybacks
13Neurovascular Physician Panel Mark Paul President, Neurovascular Division
Neurovascular physician panel

                      Alexander Coon, MD         Brian Jankowitz, MD              Ryan McTaggart, MD

                         Adjunct Professor        Assistant Professor               Associate Professor
                           Neurosurgery              Neurosurgery           Radiology, Neurology, & Neurosurgery
                      Johns Hopkins University   University of Pittsburgh   Warren Alpert Medical School of Brown
                                                     Medical Center                       University

                                                                                                                    15
Stryker consultants
In the United States, stroke occurs
every 40 seconds
Every 4 minutes ~13% of all
someone dies ischemic strokes
were treated
800,000
strokes per year 2x more women
die from stroke
than breast
cancer
#5 cause of death
Leading cause of disability
National Stroke Association. www.stroke.org. Accessed October 9, 2018.
16Neurovascular strategy
Be the worldwide leader in
Complete Stroke Care
17Neurovascular leadership
2019+
Looking forward
Continued innovation
2011–2018 for growth
Unprecedented growth
Launched 22 Ongoing clinical investment
new devices and market development
Developed the AIS market
2011 around the world
Acquired
by Stryker
18A complementary portfolio
of hemorrhagic products to treat
all types of aneurysms
Target Detachable Coils
Neuroform Atlas Stent
Target Hemorrhagic
Solutions
Guidewires Microcatheters Occlusion Distal access Long sheaths
balloons catheters
19New entry into the
flow diversion market
Surpass Streamline
Flow Diverter
Flow Diverter
Hemorrhagic
Solutions
Guidewires Microcatheters Delivery assist Distal access Long sheaths
catheters catheters
20A comprehensive portfolio
of products to treat acute
ischemic stroke
Trevo XP ProVue Retriever
Trevo
Stroke
Solutions
Guidewires Microcatheters Distal access Long sheaths Balloon guide
catheters catheters
21New entry into the
direct aspiration market
AXS Vecta
Aspiration Catheter
AXS Infinity LS Plus
Long Sheath
Aspiration
Stroke
Solutions
Guidewires Microcatheters Aspiration
pumps
22Neurovascular clinical leadership
HEM AIS ICAD
SCENT trial DAWN trial WEAVE trial
ATLAS study Trevo Retriever
registry
23Stroke therapy awareness programs
every second is critical
Primary Comprehensive
Call 911 stroke center stroke center Stroke team Treatment
The brain ages Market development programs for
3.6 years every hour each phase of patient care, aimed
without treatment1 at decreasing time to treatment
1. Saver JL. Time is Brain—Quantified. Stroke. 2005;37:263-266 24Neurovascular physician panel
Alexander Coon, MD Brian Jankowitz, MD Ryan McTaggart, MD
Adjunct Professor Assistant Professor Associate Professor
Neurosurgery Neurosurgery Radiology, Neurology, & Neurosurgery
Johns Hopkins University University of Pittsburgh Warren Alpert Medical School of Brown
Medical Center University
25Knowing the signs of stroke
can change a life (F.A.S.T.)
Face: Arms: Speech: Time:
Droop on one side, Weakness Slurred speech If one of these symptoms
or uneven smile on one side or difficulty is present, get help.
understanding Time is brain, and every
second counts
Know where to go for treatment.
26Trauma & Extremities Spotlight Dr. Xavier Berling President, Trauma & Extremities
Trauma & Extremities
strategic journey
Trauma & Extremities continues to capture meaningful market share

    Various market spaces

    Multiple product categories

    Different type of customers

 We help rebuild lives through our dedicated services that support our
 customers with comprehensive and advanced product platforms
                                                                         28
Key insights
Ability to demonstrate financial value to the C-suite combined with dedicated
selling capabilities
Level 1 hospital market shares drive Trauma long term leadership
Largest gap for Extremities category leadership is shoulder
29Trauma & Extremities Extremities Update Gordon Van Ummersen Vice President & General Manager, Extremities
US Extremities market overview

    US Extremities market growth           Growth drivers

                                   •   Specialized sales forces

                                   •   Surgeon education programs

                                   •   Next generation implants

                                   •   Site of care shift to
                                       ASC/Outpatient setting

                                                                    31
US Foot & Ankle sales and market
SYK US Foot & Ankle sales performance 2017 Market share
23% CAGR
• Dedicated and focused sales team
• Portfolio filled through organic development and strategic M&A
5 yr Pro Forma CAGR through FY ‘17
32US Shoulder sales and market
SYK US Shoulder sales performance 2017 Market share
44% CAGR
• Solid foundational portfolio built and launched
• Increased branding, commercial focus and educational effort
5 yr Pro Forma CAGR through FY ‘17
33US Shoulder market by procedure
$2,500
Resurfacing
Revision
Hemi-Arthroplasty
$2,000
Total Shoulder Arthroplasty
Reverse Shoulder Arthroplasty
$1,500
$1,000
$500
$0
2014 2015 2016 2017 2018P 2019P 2020P 2021P 2022P 2023P 2024P 2025P 2026P 2027P
$ millions 34US Shoulder portfolio future pipeline
Current platform 2019 launches Future additions
ReUnion TSA
Improved instruments ReUnion Stemless Revision Options
ReUnion RFX
ReUnion RSA ReUnion S Glenoid Solutions
A growing foundation leading to the power of MAKO
35Endoscopy Spotlight Andy Pierce Group President, MedSurg
Performance over time
 Global Endoscopy Sales
  $ Millions
  1,800

  1,600

  1,400

  1,200

  1,000

   800

   600

   400

   200

      0
          1999   2000   2001   2002   2003   2004   2005   2006   2007   2008   2009   2010   2011   2012   2013   2014   2015   2016   2017

                                                                                                                                               37
Key product and service offerings
Endoscopy Communications Sports Medicine
Surgical visualization Infrastructure Sports arthroscopy
MIS and open Booms, lights, Resection, RF, fluid
tables management
Fluorescence Integration Sports implants
imaging agent Audio, video, data Shoulder, knee, hip,
ICG and small joint
Media
management
Media storage and
EMR integration
38Key growth drivers
• MIS Visualization and Fluorescence Imaging leadership
• Facility new build, remodeling and expansion drive OR upgrades
• Focus on Sports Medicine portfolio expansion opportunities
• Focus on geographic expansion opportunities
39Martin I. Newman, MD, FACS
Medical education: Positions:
• Vanderbilt University School of Medicine • Department of Plastic and
Reconstructive Surgery at Cleveland
• Plastic surgery training at New York-
Clinic Florida,
Presbyterian Hospital, Columbia University,
Cornell University, New York, (plastic surgery • Program Director and Head of Clinical
residency), Cleveland Clinic Florida Research for Residency Program
(aesthetic and cosmetic surgery fellowship) • President for the Broward County
and at the University of Miami, Jackson Society of Plastic Surgeons
Memorial Hospital, Miami, FL (general • Former President of the Miami Society
surgery residency) of Plastic Surgeons
• Board Member of the Florida Society of
Publications Plastic Surgeons
• Authored 14 book chapters, over 60
professional journal articles
• Presented over 200 lectures and abstracts on
plastic and cosmetic surgery
• Contributed to 9 television, magazine and
Internet publications
40
Stryker consultantEndoscopy SPY Technology Evolution Martin I. Newman, MD Plastic Surgeon, Cleveland Clinic Florida
Wiki medical school

•   Successful surgery removes a diseased tumor, tissue or
    organ while preserving healthy structures

•   Following removal - remaining structures will survive
    only if their blood supply is adequate

•   Surgeons must assess the viability (blood supply) of the
    remaining structures based on clinic judgment

• With all our training – we are less than 100% accurate at identifying poor blood supply
  (ischemic tissue) with our naked eyes.

                                                                                            42
Understanding the market need
About 1 in 8 women in the U.S.
will get breast cancer in her lifetime.
43
1. Noone AM, Howlader N, Krapcho M, et al. (editors). SEER Cancer Statistics Review, 1975-2015. Table 4.17. National Cancer Institute. Bethesda, MD. Accessed on April 19, 2018. http://seer.cancer.gov/csr/1975_2015/, 2018Understanding the market need
44Understanding the market need
45Understanding the market need
46Mastectomy flap necrosis:
a domino effect
• Skin dies
• Patient Loses Breast - Second Time
• Significant Pain and Suffering
• Extra Operation
• Unplanned Hospitalization
• Loss of DermACELL
• Loss of Silicone Implant
• Costs Double and Triple
47Cost of complications:
breast reconstruction surgery
*Cost-to-charge ratio applied to original data to arrive at cost.
These costs were estimates based on reported charges for Cleveland Clinic, Florida
48Understanding the market need
About
25%
of all breast reconstructions
experience some degree of
mastectomy flap necrosis
49What is the solution?
SPY
technology
30 seconds
ICG Within 30 seconds, ICG
can be visualized on
the skin
Indocyanine Green is • Blood flow can be evaluated
injected thru the IV and
disperses through the • Action can be taken
circulatory system • Problems addressed
https://www.smh.com.au/healthcare/nipplesaving-machine-spy-elite-helps-doctors-perform-safer-reconstructive-breast-cancer-surgery-20171004-gyu2e3.html
https://diepcjourney.com/2016/06/21/1836/ 5051
What is the solution?

SPY Elite
   • Current market leader in open fluorescence imaging
   • 10+ years of history

SPY PHI (portable handheld imager)
   • Next generation product
   • Every surgeon, every patient

                                                          52
CTG Update Viju Menon Group President, Global Quality & Operations
Cost Transformation for Growth (CTG)
program goals
                                                                                    Above market top line growth
                                                                             …and sustainable margin expansion

Year 3 of our CTG Program designed to                  Stryker operating margin %

enable long-term leveraged growth                                                                                                Strategic plan

3 guiding principles:

                                          CTG Impact
  • Significantly reduce structural and
    non-value-added costs

  • Continue to reinvest in innovation                                      CTG to drive:
    and expand growth platforms                                       30-50 bps / year annually

  • Generate shareholder value
                                                         2012       2013      2014     2015   2016   2017   2018   2019   2020       2021

                                                                                                                                            54
Key initiatives to drive CTG
Product Life Cycle Shared Services
Management (PLCM)
Global Operating
Plant Network Model &
Optimization Organizational Design
Cost
Transformation
for Growth
(CTG)
Supply Chain Indirect
Optimization Procurement
Direct Sourcing Global ERP
Confident in achieving 30 – 50 bps per year in op margin expansion
55Financial Outlook Glenn Boehnlein Vice President, Chief Financial Officer
Long term sustainable growth
model
                          •   Focused market approach (developed and emerging)
                          •   Power products/brands
           Sales Growth   •   Diversified portfolio
                          •   Opportunistic M&A strategy

   EPS                    • COGS reduction
  Growth      Operating   • SG&A leverage
              Leverage    • Balanced R&D investment

                          •   Tax
            Financial     •   Debt management
            Efficiency    •   Share repurchases
                          •   Dividend growth

                                                                                 57
Committed to growth at the
high end of Med Tech
8.0% 7.6%
Organic Sales Growth (constant currency) 7.1%
7.0%
6.4%
6.1%
6.0% 5.8%
~5.5%
5.1%
5.0% 4.8%
4.6%
4.2%
4.0%
3.0% 2.8%
2.4%
2.0%
1.0%
0.0%
2013 2014 2015 2016 2017 2018 Q3 YTD
Med Tech Market* Stryker
*Med Tech market growth is based on Company research of 20 companies 58Committed to delivering
leveraged earnings
14.0% 13.3%
12.5%
11.9%
12.0%
11.7%
10.0%
8.2%
8.0% 7.5%
7.1%
6.1% 6.4%
5.8% 7.0%
6.0% 5.3%
5.1%
4.4%
4.0%
2.0%
0.0%
2013 2014 2015 2016 2017 2018 Guidance
Organic Sales Growth (constant currency) Adj EPS Growth
Note: 2018 adj EPS growth and organic sales growth corresponds to 2018 full year guidance 59Capital deployment strategy
M&A to drive sales growth
and innovation
Focused on driving sales growth in core and adjacent markets
Dividend growth
Dividend CAGR of 15% since 2010
Share repurchases
Baseline focus of repurchases to offset dilution
2018 Capital Deployment
Significant M&A driving growth: K2M (pending), Entellus, HyperBranch, Invuity
60Long term sustainable growth
targets
Sales growth at the high end of Sales Growth
Med Tech, which allows us to
drive…
EPS
30 to 50 basis points of annual Growth Operating
operating margin improvement Leverage
over 5 years
Minimum EPS growth of 9% Financial
annually Efficiency
61Stryker Corporation or its divisions or other corporate affiliated entities own, use or have applied for the following trademarks or service marks: AXS Infinity LS, AXS Vecta, Berchtold, CHG Hospital Beds, Complete Stroke Care, Concentric, Entellus Medical, HyperBranch Medical Technology, Inc, Instratek, Invuity, K2M, Mako, Memometal, Muka, Neuroform Atlas, NOVADAQ, Orthovita, Physio-Control, ReUnion, SafeAir, SafeWire, Sage Products, Small Bone Innovations, Stanmore, Stryker, Surpass Streamline,Target, Surpass, Together with our customers, we are driven to make healthcare better., Trauson, Trevo, Vexim. All other trademarks are trademarks of their respective owners or holders.
Appendix A
We supplement the reporting of our financial information determined under accounting principles generally accepted in the United States (GAAP) with certain non-GAAP
financial measures, including percentage organic sales growth and adjusted net earnings per diluted share (Diluted EPS). We believe that these non-GAAP financial measures
provide meaningful information to assist investors and shareholders in understanding our financial results and assessing our prospects for future performance. Management
believes percentage organic sales growth in constant currency and adjusted net earnings per diluted share are important indicators of our operations because they exclude
items that may not be indicative of or are unrelated to our core operating results and provide a baseline for analyzing trends in our underlying businesses. Management uses
these non-GAAP financial measures for reviewing the operating results of reportable business segments and analyzing potential future business trends in connection with our
budget process and bases certain management incentive compensation on these non-GAAP financial measures.

To measure percentage organic sales growth, we remove the impact of changes in foreign currency exchange rates, acquisitions and the impact of the adoption of ASC 606(1),
which affect the comparability and trend of sales. Percentage organic sales growth is calculated by translating current year results at prior year average foreign currency
exchange rates excluding the impact of acquisitions and the adoption of ASC 606(1). To measure earnings on a consistent and comparable basis, we exclude certain items from
reported net earnings per diluted share, such as charges for acquisition and integration-related activities, the amortization of purchased intangible assets, restructuring-related
and other charges, costs to comply with European Medical Devices Regulation, Rejuvenate and other recall-related matters, regulatory and legal matters and tax matters, which
affect the comparability of operating results and the trend of earnings.

Because non-GAAP financial measures are not standardized, it may not be possible to compare these financial measures with other companies' non-GAAP financial measures
having the same or similar names. These adjusted financial measures should not be considered in isolation or as a substitute for reported sales growth and net earnings per
diluted share, the most directly comparable GAAP financial measures. These non-GAAP financial measures are an additional way of viewing aspects of our operations that, when
viewed with our GAAP results and the reconciliations to corresponding GAAP financial measures, provide a more complete understanding of our business. We strongly
encourage investors and shareholders to review our financial statements and publicly-filed reports in their entirety and not to rely on any single financial measure.

We are unable to present a quantitative reconciliation of our expected net earnings per diluted share to expected adjusted net earnings per diluted share as we are unable to
predict with reasonable certainty and without unreasonable effort the impact and timing of restructuring-related and other charges, acquisition-related expenses and fair value
adjustments to inventory and the outcome of certain regulatory, legal and tax matters. The financial impact of these items is uncertain and is dependent on various factors,
including timing, and could be material to Stryker’s Consolidated Statements of Earnings.

(1)We adopted Accounting Standards Update 2014-09, Revenue From Contracts with Customers, as well as related amendments (ASC 606), issued by the Financial Accounting
Standards Board on a modified retrospective basis, effective January 1, 2018. The impact of the adoption of ASC 606 related primarily to the reclassification of certain costs previously
presented as selling, general and administrative expenses to net sales.

                                                                                                                                                                                            63
Reconciliation of reported sales growth to
organic sales growth
Nine Months
September 30, Years Ended December 31,
2018 2017 2016 2015 2014 2013
Reported Net Sales Growth 9.3% 9.9% 13.9% 2.8% 7.3% 4.2%
Less: Foreign Currency Exchange 0.9 0.1 (0.4) (4.2) (1.0) (1.7)
Less: Acquisitions 1.8 2.7 7.9 0.9 2.5 0.8
Less: ASC 606 Adoption (1.0) - - - - -
Organic Sales Growth 7.6% 7.1% 6.4% 6.1% 5.8% 5.1%
64Reconciliation of net earnings per diluted share to
adjusted net earnings per diluted share
Millions of Dollars, Except Per Share Amounts
Years Ended December 31,
2017 2016 2015
Net Earnings Effective Tax Rate Diluted EPS Net Earnings Effective Tax Rate Diluted EPS Net Earnings Effective Tax Rate Diluted EPS
Reported $ 1,020 50.6% $ 2.68 $ 1,647 14.3% $ 4.35 $ 1,439 17.1% $ 3.78
Acquisition and integration-related charges (a)
Inventory stepped-up to fair value 20 (0.1) 0.05 23 0.4 0.06 4 0.1 0.01
Other acquisition and integration-related 31 0.2 0.09 77 0.1 0.20 20 0.2 0.05
Amortization of purchased intangible assets 250 3.0 0.67 221 2.2 0.59 147 1.5 0.39
Restructuring-related and other charges (b) 155 0.4 0.41 98 0.3 0.26 97 0.7 0.26
Rejuvenate and other recall-related matters (c) 131 0.7 0.34 127 0.1 0.34 210 2.0 0.55
Regulatory and legal matters (d) 25 0.4 0.06 (7) (0.2) (0.02) (46) 0.1 (0.12)
Tax Matters (e) 833 (39.6) 2.19 8 0.1 0.02 78 (4.4) 0.20
Adjusted $ 2,465 15.6% $ 6.49 $ 2,194 17.3% $ 5.80 $ 1,949 17.3% $ 5.12
Weighted-average diluted shares outstanding (in millions) 380.1 378.5 380.9
(a) Charges represent certain acquisition and integration-related costs associated with acquisitions.
(b) Charges represent the costs associated with certain restructuring-related activities associated with workforce reductions and other restructuring-related activities.
(c) Charges represent changes in our best estimate of the minimum end of the range of probable loss to resolve the Rejuvenate recall and other recall-related matters.
(d) Our best estimate of the minimum of the range of probable loss to resolve certain regulatory or other legal matters and the amount of favorable awards from settlements.
(e) Benefits and charges represent the accounting impact of certain significant and discrete tax items, including adjustments related to the Tax Cuts and Jobs Act of 2017.
65Reconciliation of net earnings per diluted share to
adjusted net earnings per diluted share
Millions of Dollars, Except Per Share Amounts
Years Ended December 31,
2014 2013 2012
Net Earnings Effective Tax Rate Diluted EPS Net Earnings Effective Tax Rate Diluted EPS Net Earnings Effective Tax Rate Diluted EPS
Reported $ 515 55.6% $ 1.34 $ 1,006 17.0% 2.63 $ 1,298 23.9% $ 3.39
Acquisition and integration-related charges (a)
Inventory stepped-up to fair value 15 0.5 0.04 21 0.1 0.06 13 - 0.03
Other acquisition and integration-related 50 0.7 0.13 51 0.3 0.13 24 0.3 0.06
Amortization of purchased intangible assets 133 1.1 0.35 98 0.4 0.26 88 0.3 0.23
Restructuring-related and other charges (b) 78 1.1 0.20 46 0.3 0.12 59 0.1 0.15
Rejuvenate and other recall-related matters (c) 628 (3.1) 1.65 460 2.0 1.20 133 - 0.35
Regulatory and legal matters (d) - - - 63 (0.6) 0.17 33 (0.5) 0.09
Donations - - - 15 0.3 0.04 - - -
Tax Matters (e) 391 (33.6) 1.02 (46) 2.9 (0.12) - - -
Adjusted $ 1,810 22.3% $ 4.73 $ 1,714 22.7% 4.49 $ 1,648 24.1% $ 4.30
Weighted-average diluted shares outstanding (in millions) 382.8 382.1 383.0
(a) Charges represent certain acquisition and integration-related costs associated with acquisitions.
(b) Charges represent the costs associated with certain restructuring-related activities associated with workforce reductions and other restructuring-related activities.
(c) Charges represent changes in our best estimate of the minimum end of the range of probable loss to resolve the Rejuvenate recall and other recall-related matters.
(d) Our best estimate of the minimum of the range of probable loss to resolve certain regulatory or other legal matters and the amount of favorable awards from settlements.
(e) Benefits and charges represent the accounting impact of certain significant and discrete tax items, including adjustments related to the Tax Cuts and Jobs Act of 2017.
66You can also read