The water footprint of Arabica and Robusta coffee bean production in South America
←
→
Page content transcription
If your browser does not render page correctly, please read the page content below
The water footprint of Arabica and Robusta
coffee bean production in South America
The consequences of climate change on the feasibility of the South American
continent for coffee production

                                                            Bachelor’s project 2020/2021
                                                            Name: Marly Visser
                                                            Student number: S3751767
                                                            Coordinator: G. Mallon
Abstract
Climatic changes such as rising temperatures and changing precipitation patterns have
had a global influence for the past number of decades. These changes also relate to
agricultural production. With the influence of these climatic changes of the past decades,
the production of the Arabica and Robusta coffee bean in South America is also at risk.
Higher temperatures and changing precipitation patterns lead to uncertainties regarding
water usage. The water footprint is used to determine the ratio between rainwater and
irrigation water for crop production. To see how climatic changes over the past number of
decades have already influenced blue water usage, a regression analysis was performed
using climatic data by the IPCC combined with an index for calculating blue water usage
by Arabica and Robusta coffee beans. With the current climatic changes, the ratio
between blue and green water will shift to blue water as more ground- and surface water
is required to irrigate coffee beans in order to sustain production. This can lead to issues
of water scarcity and to overcome this, the production of these crops on the South
American mainland may need to shift to other regions on higher altitudes and local
farmers may need to differentiate and grow different kinds of crops more suitable to the
adapted climate. However, moving coffee bean production elsewhere can have serious
socio-economic and ecological consequences. Farmers differentiating to other types of
agricultural production can lead to a loss of jobs. Moreover, issues of water scarcity can
lead to higher food prices contributing to the threat of loss of local food security.

                                                                                           2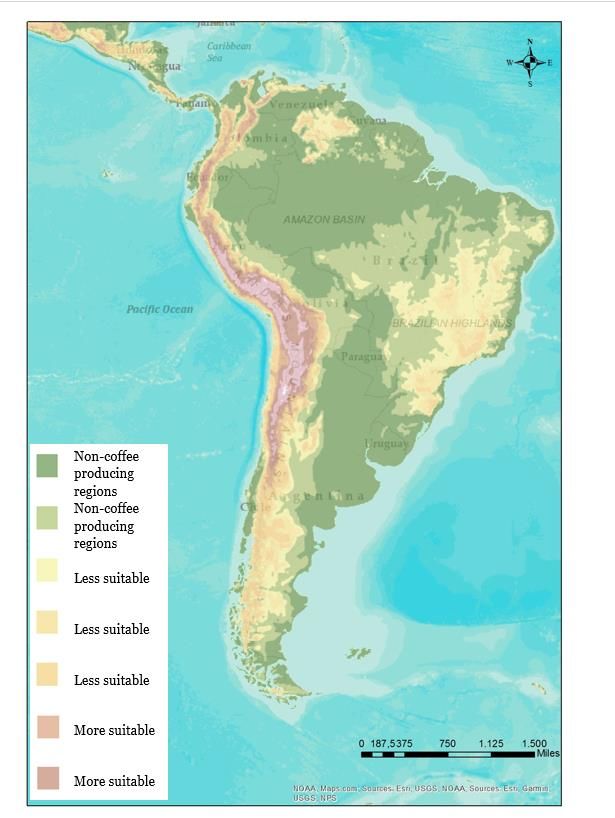
Table of contents
1. Introduction…………………………………………………………………………………………………….…4
   1.1 Background…………………………………………………………………………………………………..4
   1.2 Research problem………………………………………………………………………………………….5
   1.3 Structure………………………………………………………………………………………………………6
2. Theoretical Framework……………………………………………………………………………………....7
   2.1 Literature review…………………………………………………………………………………………..7
   2.2 Conceptual model……………………………………………………………………………………..…12
3. Methodology…………………………………………………………………………………………….………13
4. Results……………………………………………………………………………………………………………..17
   4.1 Coffea Arabica…………………………………………………………………………………………..…17
   4.2 Coffea Canephora……………………………………………………………………………………..…19
5. Conclusions…………………..…………………………………………………………………………………20
6. References………………………………………………………………………………………………………..21

                                                            3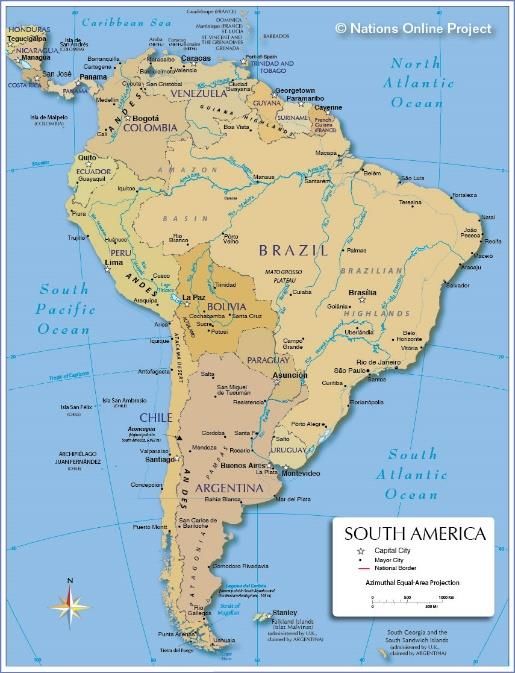
1. Introduction
1.1 Background
For the past decades, the issue of climate change has been prevalent worldwide as among
other things global temperatures are rising and precipitation is becoming more unpredictable
(IPCC, 2021). The consequences of climate change on sustainable water resource
management are becoming increasingly prevalent worldwide and are naturally also relevant
for agricultural production. These climatic changes have implications for agricultural practice
on a global scale, especially for crops that are historically heavily reliant on rainwater (Ovalle-
Rivera et al., 2015). One example of such a crop is the coffee bean (Ovalle-Rivera et al., 2015).
The coffee market is rather substantial, with over 166 million 60kg bags consumed worldwide
in the year 2019/2020 alone (International Coffee Organization, 2021) Therefore it is
necessary to look at the consequences of climatic changes on coffee production, especially in
areas where coffee production takes up a large part of their export. South American countries
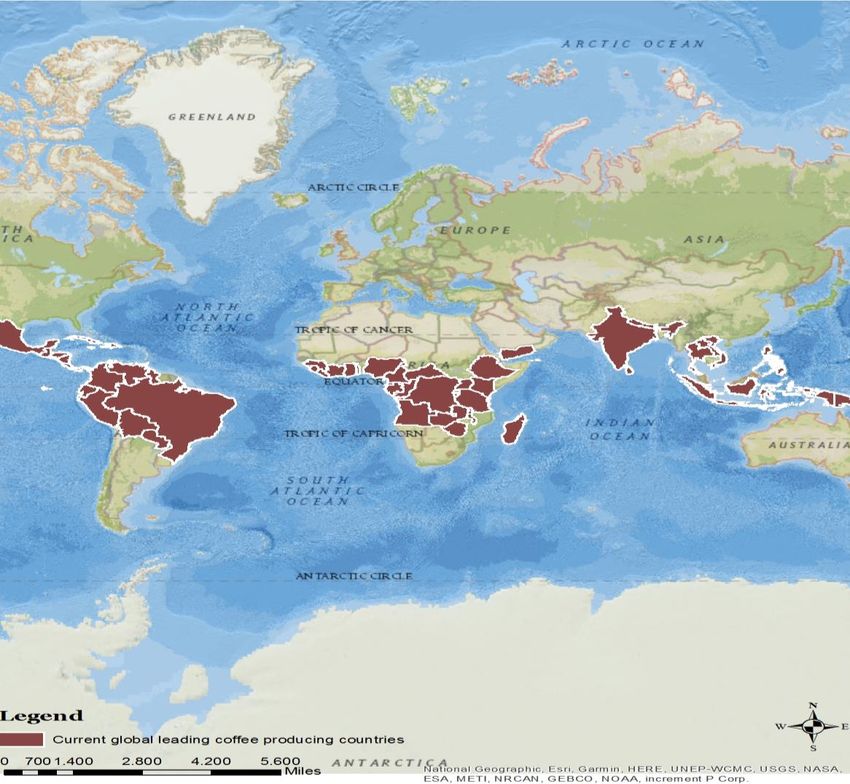
together are responsible for about 46% of the world’s total coffee production, with Brazil
being the largest exporter (Szenthe, 2019). These large exports of coffee beans make the
aforementioned areas heavily reliant on this sector. Especially countries that are historically
large exporters, as is the case with Brazil which was already the largest coffee producer in the
world in 1850 (Bethell, 1989). In figure 1, below, all current global top coffee producing
countries can be seen.
Figure 1: Current top coffee producing countries (made by author with GIS)
4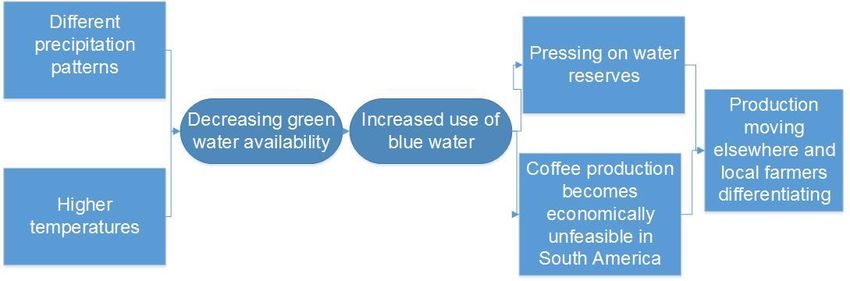
Since climatic changes include among others also changing precipitation patterns and rising
global temperatures (IPCC, 2021) it is necessary to see how these changes relate to
agricultural production. Also, to see to what extent these climatic differences can over time
influence the production of crops that are for a large part reliant on rainwater, such as coffee.
Since coffee production is a major export product for South American countries (Szenthe,
2019), and as these are historically climatically very well adapted to the production of coffee
beans, this thesis will zoom in on this continent specifically to research sustainable water
resource management in this context. The two most prevalent coffee bean species grown in
South America are Arabica and Robusta (canephora) (Davis et al., 2006). Between both
kinds, ecological growing conditions differ greatly. Arabica coffee beans, for example, grow in
shaded environments whereas Robusta (or canephora) beans grow in sunny environments
(Davis et al., 2006). Robusta is often deemed of lesser quality and taste than Arabica coffee
beans (Lashermes et al., 1999). The Robusta coffee bean however is better adapted to
changing climatic conditions as its tolerance for less or more precipitation and higher or
lower temperatures is much greater than the tolerance of the Arabica coffee bean. (Haggar
and Schepp, 2012). This could make Robusta more suitable for growth under new climatic
conditions as a result of climate change. To estimate how the suitability of both coffee bean
types fits into the context of climate change, and how this relates to issues of irrigation and
water scarcity, the concept of the water footprint will be used to estimate these changes. The
water footprint can be used to estimate the amount of water that is required to produce one
unit of a crop (Hoekstra et al., 2011). To expand on this, the concepts of blue and green water
will be used to describe how the ratio between rainwater and irrigation water for the growth
of coffee beans will be used. In this context, blue water relates to water used for irrigation
whereas green water relates to precipitation. As precipitation patterns might change and
temperatures may rise, the crop of coffee being heavily reliant on rainwater can become more
reliant on the usage of blue water derived from the ground- and surface water. This could be
an issue as problems of water scarcity arise in South American countries. (Murtinho et al.,
2013). These differences in blue water usage can have climatic impacts, but they also might
lead to situations where coffee production in these regions will not be economically feasible
in the future. Discussed in this research will be whether this is or will be the case and whether
it would make sense for farmers to differentiate. Also, it might be of interest to see to which
regions on a global scale, production might migrate to more suitable regions for coffee
production as the demand for coffee remains still or even increases.
1.2 Research problem
The research will aim to see how changes in the ratio of green and blue water in the water
footprint of the production of Arabica and Robusta coffee beans in South America are
affected by climatic changes such as different precipitation patterns and rising temperatures
in order to make predictions for the economic feasibility of agricultural production of coffee
in South American regions, to make statements about possible local water scarcity issues and
accordingly make policy recommendations for making agricultural adaptations, possibly
moving production elsewhere or supporting agricultural differentiation.
To research this topic the central question to be asked will be:
‘What is the influence of increasing global temperatures and changing precipitation patterns
as a result of climate change on the water footprint for local coffee production in South
American countries?’

                                                                                                5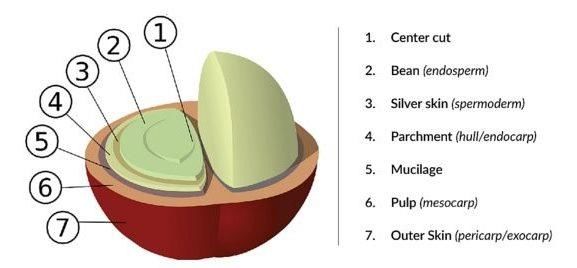
Secondary questions that arise from this central question are:
       -   How do climatic changes influence the availability of green water (rainwater) for
           coffee bean production?
       -   To what extent does the ratio between blue and green water change?
       -   Will sustainable coffee production in South America be feasible as the water
           footprint ratio changes?
       -   Would it be more economical to move production elsewhere globally and
           differentiate locally?

1.3 Structure
The structure of the thesis is as follows. The first chapter contains an introduction in which
the topic is introduced. The background of the study will be discussed, as well as the research
problem in which the main research question and sub-questions are posed. The second
chapter of the research includes the theoretical framework in which a literature review is
described as well as a conceptual model which puts the review in a visual perspective. In the
third chapter, the methodology of the research is explained. The fourth chapter contains the
results of the research. The final chapter of this thesis contains a discussion on methods and
results.

                                                                                               6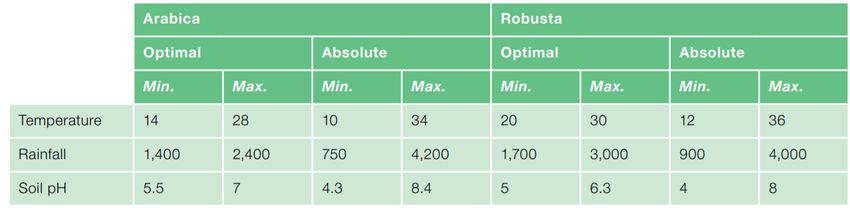
2. Theoretical framework
2.1 Literature review
Over the past decades, global climate systems have changed immensely. Global and local
temperatures have risen and precipitation has in certain areas declined and in other areas, it
has risen and has become more unpredictable (IPCC, 2021). These changes undoubtedly have
their effects on agricultural crop production. These effects are especially prevalent in crops
that are highly reliant on precipitation and sensitive to temperature changes. Therefore it is
necessary to see how these climatic changes influence coffee production as this crop is reliant
on certain temperatures and precipitation absolutes and patterns. Precipitation patterns have
changed and absolute precipitation has also been known to decrease in South American
regions (IPCC, 2021). Therefore, coffee bean crop production could require a substantially
larger quantity of irrigation water in order to sustain a sufficient coffee bean production. We
know that, historically, coffee already has a large water footprint (Mekonnen et al., 2011).
What we can also derive from past research is that these climatic changes are already
influencing coffee production (Ovalle-Rivera et al., 2015). To see whether the rising
temperatures and different precipitation patterns can lead to an increase in demand for
surface- and groundwater to compensate for the loss of (efficient use of) green water to still
be able to produce coffee in these areas, this project will offer insight on these issues. In other
words, we will see whether and how the water footprint with the ratio of blue and green
water, changes for the production of coffee in changing climatic conditions. To investigate
how differing precipitation and higher global temperatures influence the different types of
water for coffee production, the concept of the water footprint will be used (Hoekstra et al.,
2011). Using the water footprint we can see how the ratio between blue and green water
changes (Chapagain et al., 2012).
The crop that is central to this agricultural issue, is the coffee bean. The coffee bean has
certain properties that are directly influenced by climatic conditions. The coffee bean consists
of two main parts. This involves the outer layer of the bean called the pericarp and the seed
inside. This layer, the pericarp, consists of the exocarp, mesocarp and endocarp (Eira et al.,
2006). The exocarp is the peel of the seed. This outer layer is green during the initial growth
stages and later becomes yellow or red. The mesocarp is also referred to as the pulp as this is
a layer of material that is stiff at first and becomes softer with maturation (Eira et al., 2006).
The endocarp is the outer layer of the coffee bean. Within the endocarp, the seed is found.
The seed consists of the silver skin and the endosperm. The silver skin is a thin outer layer of
the endosperm. The endosperm is the most important part of the seed as it is the part that
mostly remains for coffee production (Eira et al., 2006). Below, figure 2 shows the physiology
of the coffee bean.

     Figure 2: Physiology of the coffee bean (derived from coffeecrossroads.com)

                                                                                                 7
Overall the bean is egg-shaped and has a hard external region and a soft internal region in
the seed. The flowering of the beans does not happen simultaneously and can take up to two
or three days. After flowering, the growth of the bean can stagnate up to sixty days depending
on climatic conditions such as when the period with high rainfall starts. With Arabica seeds it
can then take up to 250 days to mature whereas for Robusta beans it can take up to 350 days.
As mentioned before, rather significant differences exist between coffee species Arabica and
Robusta (Davis et al., 2006). Rainfall ratios for example differ among species (see table 1).
Arabica is better suited to large quantities of rainwater than Robusta. However, both species
do require a dry period in order for the flowering to take place. Moreover, the required
rainfall also depends on factors such as cloud cover, soil conditions, humidity, and
agricultural techniques (DaMatta et al., 2007). High air humidity is required for both species
of coffee bean to grow although Arabica beans can grow under slightly less humid conditions
than Robusta (DaMatta et al., 2007). Regarding required soil conditions, these can also vary
greatly due to other circumstances. For instance, large dry periods can lead to increased root
development making both Arabica and Robusta coffee bean plants more sustainable for
periods of drought as more green water can be taken up by the roots in the soil (DaMatta et
al., 2007). In South American coffee-producing regions, the dry period can last up to six
months. However, future climate projections indicate that dry periods can increase by one or
two months within the next fifty years in South American regions, meaning the dry period
will be too long for a sufficient crop yield regardless of the larger root availability (Ovalle-
Rivera et al., 2015).
In order to overcome these difficulties with changing climatic factors, more blue water could
be required for coffee production. This project will aim to offer insights on whether the
possibly increasing need for blue water can have a negative influence on the already existing
water scarcity in South America and mainly the Andes region (Murtinho et al., 2013). The
concept of Water scarcity is defined as ‘The ratio of the total blue water footprint in a
catchment to the blue water availability, whereby the latter equals natural runoff in the
catchment minus the flow that needs to be maintained in support of local ecosystems and
communities (Hoekstra et al., 2011). This concept needs to be taken into account to complete
the equation on whether coffee production in South American countries will be sustainable in
the future. Research shows that already we can see that by 2050 water stress can pose severe
problems in the South American region as well (Vorosmarty, 2000).
Even though many different climate models have predicted alternative scenarios for climatic
changes in the future, many models indicate that climate change will eradicate 50% of all
coffee plantations worldwide (Bunn et al., 2015). In figure 3 below, we can see how current
coffee-producing areas are already becoming substantially less feasible for coffee production
by 2050, whereas some smaller areas are becoming more suitable for coffee production.
8Figure 3: Suitability changes by the 2050s in the RCP 6.0 scenario; A-D: Arabica, E-G:
Robusta. Hatching indicates the current suitability distribution; Warm colors represent
areas with negative climate change impacts and cold colors positive changes (Bunn et al.,
2015)
Possible solutions to combat the increasing demand for ground- and surface water for coffee
production in these countries might simply be using different agricultural processes to make
the use of blue water more efficient, such as soil mulching and drip irrigation (Nouri et al.,
2019). However, an increase in the use of blue water is still likely (Schmitz et al., 2013). The
shift from green to blue water for coffee production could have serious consequences. For
one, it can create local water stress for individual consumption (Schmitz et al., 2013). Also, as
water becomes a more scarce good for agricultural production, the water price may rise. This
increase in price can lead to high prices for coffee and lead to coffee becoming a more luxury
product that not anyone can afford. Furthermore, high prices for agricultural production as a
result of the higher water price in general, can lead to high food prices and can locally
threaten food security (Schmitz et al., 2013).
A more extreme measure to combat issues with coffee production under changing climatic
conditions, could be to move production elsewhere on a global scale and differentiating
locally. For example, due to climatic changes certain areas in Brazil have become increasingly
suited for the production of maize, soybean and sugarcane (Schlindwein et al., 2021).
Therefore, local farmers may decide to invest in producing crops such as these rather than
coffee beans. However, not only climatic changes drive differentiation of agricultural
production. Population growth also influences the demand for agricultural products in South
America. (Schlindwein et al., 2021). This population growth leads to an increase in demand
9for agricultural products for food security which leads to more intensive farming for food
production in certain areas. This could also be a factor that pushes out coffee production
locally. With these environmental and social impacts on coffee production, it will mainly be
the smaller farmers at first that suffer the consequences. This is also because of the simple
fact that small farms make up the largest part of global coffee production. Even though most
farms make up less than ten 10 hectares per farm, these types of farms do make up a large
labor market of over 100 million people (Rice, 2003). Small coffee producers do have a small
margin and as climatic difficulties are increasing, farmers have already started shifting
production to other crops such as coca. Coca can grow under a very wide array of climatic
circumstances and is, therefore, an option to combat the loss of suitability of land for coffee
production. However, coca production is much less intensive than coffee production and has
therefore already eradicated many jobs (Rice, 2003). Large industrial sites, however, have
means to shift their production to for example Robusta beans as they are better suited to
climatic changes (Rice, 2003). At the rate at which climatic changes are currently taking
place it could however mean that in the future, even producing coffee with Robusta beans is
no longer possible. However, for some regions, climatic changes can even lead to new
opportunities as some areas actually become a better fit for producing coffee (Ovalle-Rivera
et al., 2015). Asian countries such as Vietnam produced almost no coffee before and during
the 1990s but are now top producing countries globally. In South America, areas of higher
latitude generally seem to become better suited to coffee production as climatic changes take
place (Zullo et al., 2011). Also, areas of higher altitude seem to become a better fit for
producing coffee as high altitudes often involve cooler temperatures which battle the effect of
increasing temperatures as a result of climate change. Below in figure 4 is shown in which
regions coffee production will be less feasible and which regions will become more suitable
for coffee production as a result of climate change based on projections on altitudinal apr
(Ovalle-Rivera et al., 2015). However, moving coffee production elsewhere could threaten
local ecosystems (Läderach et al., 2013).
10Legend
Figure 4: Future suitability of coffee producing regions on the South
American continent
112.2 Conceptual model
Figure 5: Conceptual Model
In the conceptual model above in figure 5, we can see that the expectation is for changing
precipitation patterns, combined with higher temperatures to lead to a decreased availability
of green water. This is the expectation as precipitation is likely to decrease in certain areas in
South America and as temperatures rise the evapotranspiration also rises (Schmitz et al.,
2013). The decrease in a green water supply will lead to increased use of surface- and
groundwater (blue water) to compensate for the loss of green precipitation water in order to
still be able to produce a sufficient coffee bean crop yield. This increased use of blue water
will then result in increasing water scarcity issues locally and also will eventually have
economic consequences as production might become less feasible economically. This then
leads to possibly moving production coffee production elsewhere in the world where climatic
conditions (possibly through climate change) are more favorable for coffee production. This
then also means local farmers in South America might need to differentiate and grow
different crops.
122. Methodology
To answer the research questions, secondary data analysis is performed using secondary
quantitative data. To determine how climatic changes over the past decades have influenced
the water footprint of coffee production, a linear regression analysis is performed using
secondary data on climatic properties. The dataset that is used is from the IPCC
(Intergovernmental Panel on Climate Change). This dataset is from the IPCC Data
Distribution Center and involves data on absolute temperatures and precipitation (measured
in millimeters per year) in 10-year periods from 1901 to 1990 for all longitudes and latitudes.
This is used to see the changes in absolute temperatures and precipitation over time. Besides
this, data from IPCC simulations involving data from 2010-2199 is used to estimate whether
blue water usage will increase in the future as a result of projected shifts in temperature and
precipitation. Because of the longitude/latitude system in the data, we can specify the dataset
to South American countries only to make the data fit the analysis. In this dataset, the
longitude/latitude grid data have 2 decimals making it possible to choose the so-called four
most extreme points of latitude and longitude on the South American continent to filter the
relevant spatial data within these points so that we have data for the mainland of the
continent. Below, in figure 6, the extreme points of the South American mainland that were
used, are indicated. The dataset provided by the IPCC contains spatial data of only the
mainland of South America which helps alleviate any possible bias that could have arisen
from the fact that data from above water bodies would be used, which would of course pose
some problems of bias as agricultural production is not possible in such areas.
Figure 6: The extreme points of the South
American mainland
This dataset is accessible and was downloaded online in different file types and used for
analysis. Regarding ethical considerations, the data is derived only from secondary sources
and contains no personal information as it contains climatic data. The most important
consideration to take into account is the proper referencing of the data sources.
Ideally, another dataset would be used which contains data on the ratio of rain and irrigation
water that is used over a long period of time for coffee production on South American coffee
13plantations. Unfortunately, these data are not available. To solve this issue, an index is
created to estimate the ratio of blue and green water over time.
Optimum precipitation -
Actual precipitation - = Indicator for blue water usage
Crop Evapotranspiration
The optimum rainfall and total annual precipitation data for the production of Arabica and
Robusta coffee is used. Table 1, containing these data, can be seen below. The annual rainfall,
which is derived from the IPCC dataset, will then be deducted from the optimum rainfall. The
number that arrives from this can be seen as water shortage which then can be used to
estimate the amount of blue water that is used to irrigate and compensate for the shortage. In
table 1 below, the optimal and absolute conditions for growing Arabica and Robusta coffee
beans can be seen. These data were used to estimate blue water usage by using the optimum
precipitation for both Arabica and Robusta coffee beans, deducting the actual precipitation
derived from IPCC climate data and minus the crop evapotranspiration which was derived
from the Penman equation which can be seen below (Valiantzas, 2006).
Table 1: Optimal and absolute conditions for growing Robusta and Arabica coffee beans
(Haggar and Schepp, 2012)
Estimating crop evapotranspiration
To estimate crop evaporation, a simplified Penman equation was used. This equation can be
used to estimate evaporation based on other climatic data (Valiantzas, 2006). Firstly, the
input variables required for this equation involve, among others, T (air temperature). This
was derived from the IPCC dataset mentioned above. All formulas below are derived from
Valiantzas (2006). Ra was calculated as follows (Valiantzas, 2006):
Rs (extraterrestrial irradiation) can then be calculated using the Ra variable (Valiantzas,
2006).
14N is calculated by the formula below. To calculate N, i (month in the year, where 6 means
june for example) and ϕ (latitude in radians) are required. For latitude, the extreme
latitudinal points of the continent were used. These two values for N were then used to
calculate an average value for N. For i, for each time period, 1 to 12 were used to determine
the average N (sunshine hours). (Valiantzas, 2006)
Other required variables include RH (relative humidity), Tmax (maximum temperature),
Tmin (minimum temperature). These variables are derived from the IPCC dataset.
Remaining variables include α (albedo) for which the grassland average of 0.23 was used
(Valiantzas, 2006). For au the constant 0.5 was entered and for u (wind speed) the global
average of 2 m/s was entered (Valiantzas, 2006).
The equation below shows the simplified Penman equation that was eventually used for all
time periods to estimate evaporation. The formula was used for all time periods for every
month of the year and the average of this was used to estimate the evapotranspiration as the
IPCC dataset also only contains annual data. Below, table 2 containing the average
evaporation in millimeters per day can be seen for each time period.
PERIOD CROP EVAPOTRANSPIRATION (MM/DAY)
1900-1910 1,98
1911-1920 1,96
1921-1930 2,01
1931-1940 2,46
1941-1950 2,67
1951-1960 2,71
1961-1970 2,89
1971-1980 2,88
1981-1990 2,91
1990-2000 2,96
Table 2: The average crop evaporation by time period in millimeters per day for the
average of the extreme latitudinal points of the South American continent
Using this estimation of average crop evaporation combined with precipitation data gives us
an estimate of the shortage of water in order to successfully grow coffee beans. This gives an
indication of the amount of blue water which is then used to overcome this shortage by
irrigation methods. There are limitations to this method, as there are more factors
influencing the amount of water that is used, such as soil conditions. However, it should
function as an indication.
The aforementioned datasets were combined into one excel file with a comprehensive
overview of all relevant data. The variables in the combined dataset were transferred into an
15SPSS file to perform a linear regression analysis. Two separate regression analyses were
performed to show if and which connections exist between the different variables to conclude
whether higher temperatures and different precipitation patterns indeed lead to a shifted
blue to green water ratio in coffee production. These analyses were done separately for the
Arabica coffee bean and the Robusta coffee bean as both beans differ in regard to
precipitation and temperature tolerance.
163. Results
3.1 Coffea Arabica
In order to see whether the climatic changes, such as rising global temperatures and
changing precipitation patterns, that have been progressing for the past number of decades
have had an influence on the water footprint of Robusta and Arabica coffee bean production,
a multiple regression analysis was performed to recognize these relationships. Table 3 shows
the results of the multiple linear regression analysis. In this case, dependent variables include
precipitation data from 1900 to 2000, 2010 t0 2199 and temperature data from 1900 to 2000
and 2010-2199. The independent variable that was used, is the estimated blue water usage
for irrigation for the production of Arabica coffee beans. Table 3 shows that from the
quantitative analysis (a multiple linear regression) we can see that the t-values for the
temperature data in the 1910-1950 are generally lower than the critical value of 1.96 with a 95
percent confidence level. This means that we can not reject the null hypothesis of there being
no linear relationship between the temperatures and the estimated usage of blue water for
Arabica coffee bean production. This means that for these time periods, there is not
necessarily a strong relationship between the differences in temperature as a result of climate
change and increased stress on water resources by using blue water for irrigation. Regarding
the temperature data from the period of 1951 until 2000, all the t-values do exceed the critical
value of 1.96. Therefore, we may reject the null hypothesis of there being no linear
relationship between these temperatures and the usage of blue water for Arabica coffee bean
production. We can say that, based on these data, temperature changes from 1950 onwards
do correlate with an increase in blue water usage for crop irrigation. These results do comply
with the theoretical and conceptual model as increasingly with time, global warming leads to
an increase in blue water use. The time periods past 2010 up to 2199 all show a significant
relationship with an increase in blue water usage as all t-values exceed the critical value of
1.96 and we can therefore reject the null hypothesis of there being no relationship between
temperatures from 2010 to 2199 and the usage of blue water for Arabica coffee bean
production. We can therefore state that the blue water usage will increase with the
temperature changes that are projected by the IPCC. This complies with the academic
literature as the expectations are that blue water usage will increase in agricultural
production as a result of climate change (Schmitz et al., 2013).
The precipitation data presents a vaguer picture. Although from the 1950’s onwards, almost
all t-values exceed the 1.96 critical value and for these values we can therefore reject the null
hypothesis of no linear relationship between the precipitation data and the blue water use for
the production of the Arabica coffee bean. For the periods between 2010 and 2199 we can see
only significant results as the related t-values are all higher than 1.96. We may reject the null
hypothesis of no relationship between precipitation values from 2010 to 2199 and blue water
usage. Therefore, we can say that based on these data, blue water usage will likely increase as
changes in precipitation happen in the future up to at least 2199.
17Model 1 (Arabica) Variable β t-value
Constant -2852,512 -1,481
Temperatures 1900-1910 6,125 0,319
Temperatures 1911-1920 49,673 2,173
Temperatures 1921-1930 40,263 1,826
Temperatures 1931-1940 9,127 0,126
Temperatures 1941-1950 8,173 1,817
Temperatures 1951-1960 12,347 1,973
Temperatures 1961-1970 10,872 2,291
Temperatures 1971-1980 9,175 1,952
Temperatures 1981-1990 87,482 -4,082
Temperatures 1991-2000 31,065 2,961
Temperatures 2010-2039 21,137 3,852
Temperatures 2040-2069 7,827 2,257
Temperatures 2070-2099 9,273 -2,971
Temperatures 2180-2199 4,291 -3,183
Precipitation 1900-1910 -0,092 -0,467
Precipitation 1911-1920 -1,254 -1,982
Precipitation 1921-1930 1,067 2,352
Precipitation 1931-1940 1,873 -1,901
Precipitation 1941-1950 -1,411 2,617
Precipitation 1951-1960 3,903 -1,087
Precipitation 1961-1970 -1,857 -2,061
Precipitation 1971-1980 -3,771 1,840
Precipitation 1981-1990 3,502 -3,144
Precipitation 1991-2000 1,562 1,985
Precipitation 2010-2039 2,193 -2,198
Precipitation 2040-2069 5,287 -2,320
Precipitation 2070-2099 2,281 3,238
Precipitation 2180-2199 12,189 -3,201
Table 3: The effect of temperatures and precipitation on blue water usage for
irrigation of Arabica coffee beans: results of the multiple linear regression analysis
183.2 Coffea Canephora (Robusta)
For the second multiple linear regression analysis, the independent variable that was used
was the blue water usage for Robusta coffee bean production. In table 4 we can see that
regarding the temperature variables, the temperatures from 1900-1960 generally do not
exceed the critical value of 1.96 (apart from the temperatures 1911-1920). For these variables,
we can not reject the null hypothesis of there being no linear relationship between the
temperature data and the blue water usage for the Robusta coffee bean. From the
temperature variables from 1961 onwards, the t-values indicate a significant result and
therefore we may reject the null hypothesis of no linear relationship. Similarly to the Arabica
coffee bean, we can therefore see a correlation between temperature increase and the
increased use of blue water for irrigation. This complies with the expectation as laid out in
the literature review and the conceptual framework. For the temperatures from 2010 to 2199
we can also see significant results. All t-values exceed the critical t-value of 1.96 with a 95
percent confidence level. We can therefore say that we can reject the null hypothesis of there
being no relationship between blue water usage and the production of Robusta coffee beans.
From this we can conclude that, based on these data, the usage of blue water will increase for
the production of Robusta coffee beans as temperatures are correctly projected to rise.
The precipitation overall shows a less strong relationship with the blue water use for Robusta
coffee bean production. The t-values corresponding with the precipitation data do not give a
clear picture as they are only partly and seemingly randomly significant. The less clear
relationship can be explained by the Robusta coffee bean growing properties as this bean has
a substantially larger tolerance for precipitation variability than the Arabica coffee bean
(Haggar and Schepp, 2012). However, for the projected precipitation data by the IPCC for
2010 onwards to 2199, we can see a significant relationship between blue water usage for
Robusta coffee bean production and precipitation projections. All t-values from 2010
onwards show a t-value that exceeds the 1.96 critical t-value with a 95 percent confidence
level. We can therefore, based on these data, say that in the future there can be a relationship
between increasing blue water usage for Robusta coffee bean production and projected
precipitation absolutes.
19Β t-value
Variable
Model 1 (Robusta) Constant 2589,575 1,937
Temperatures 1900-1910 0,819 0,089
Temperatures 1911-1920 32,162 2,019
Temperatures 1921-1930 21,872 1,356
Temperatures 1931-1940 19,001 0,772
Temperatures 1941-1950 10,245 0,378
Temperatures 1951-1960 12,390 2,081
Temperatures 1961-1970 0,871 -4,610
Temperatures 1971-1980 -65,19 -2,249
Temperatures 1981-1990 -49,267 -2,946
Temperatures 1991-2000 -0,371 -2,394
Temperatures 2010-2039 11,762 -2,541
Temperatures 2040-2069 28,928 -2,981
Temperatures 2070-2099 21,381 -2,775
Temperatures 2180-2199 1,293 2,105
Precipitation 1900-1910 0,982 2,871
Precipitation 1911-1920 -0,862 -1,289
Precipitation 1921-1930 -0,183 -0,129
Precipitation 1931-1940 0,198 0,401
Precipitation 1941-1950 1,297 2,918
Precipitation 1951-1960 0,210 1,302
Precipitation 1961-1970 -4,732 -1,707
Precipitation 1971-1980 -0,219 -4,912
Precipitation 1981-1990 4,718 -2,464
Precipitation 1991-2000 0,013 2,027
Precipitation 2010-2039 3,128 3,298
Precipitation 2040-2069 2,721 -2,423
Precipitation 2070-2099 4,228 -3,381
Precipitation 2180-2199 1,053 4,913
Table 4: The effect of temperatures and precipitation on blue water usage for
irrigation of Robusta coffee beans: results of the multiple linear regression analysis
204. Conclusion
The main research question of this thesis is: What is the influence of increasing global
temperatures and changing precipitation patterns as a result of climate change on the water
footprint for local coffee production in South American countries?’
To answer this question, there has been looked at how climate changed has affected
temperatures and precipitation patterns in South America. We can conclude that also on the
mainland of the South American continent, absolute temperatures have risen and
precipitation patterns have become increasingly unpredictable, and locally less precipitation
or more precipitation has fallen (IPCC, 2021). As past research results have shown, climatic
changes have already greatly influenced coffee production in certain areas (Ovalle-Rivera et
al., 2015). Also, predictions are that by 2050, up to 50 percent of coffee plantations will not
be feasible anymore (Bunn et al., 2015). Therefore the expectation was that the data to be
analyzed will show similar results so that the ratio between blue and water used for coffee
crop production will shift towards blue water as less rainwater is available for the bean
growth and more blue water will be required for irrigation. The regression analysis has shown
how that in more recent years, indeed rising temperatures and different precipitation
patterns have led to an increase of blue water use for irrigation of both Arabica and Robusta
coffee beans. We can therefore say that the ratio between the use of green and blue water for
coffee production is shifting towards blue water slowly but steadily. The analysis has also
shown that when future climatic predictions prove to be accurate, the increase in blue water
usage will remain relevant for both Arabica and Robusta coffee beans. However, for the
analysis optimum data for growing coffee beans has been used instead of absolutes. Robusta
coffee beans naturally have a larger tolerance for an in- or decrease in precipitation and
Arabica coffee beans also show a certain tolerance larger than the optimum conditions in
which the beans can grow. Both coffee bean types can therefore likely still grow in their
current environments. However, a larger amount of irrigation water will have to be used
nevertheless as the coffee beans will be of lesser quality in cases where the optimum growing
conditions are not met. (Haggar and Schepp, 2012). Quality standards will remain of great
importance as the global coffee market is highly competitive (Kilian et al., 2004). To
guarantee these quality standards, irrigation methods will be needed to be used in order to
sustain local coffee production. If this becomes economically unfeasible, or for reasons of
water stress can no longer be sustained, this could mean that the areas on the South
American continent that produce coffee today, could in the future be less feasible for coffee
production. In this case, in the future, it could be more feasible for the local farmers to
differentiate and grow different types of crops. The production of Robusta and Arabica coffee
bean could then possibly be moved to other areas globally which become more suitable due to
the same effects of climate change. The production of coffee could move up to higher
altitudes. Local farmers could grow other crops such as maize or coca (Schlindwein et al.,
2021). This however has a large socio-economic impact as it does cost a lot of local jobs.
Issues of water scarcity also pose a problem as a result of climatic changes on agricultural
production in general. Water becoming more scarce can mean an increase in water prices
which can lead to increased food prices. This could be threatening to food security in the
future (Schmitz et al., 2013).
Further research should be done to determine which areas in the future could be a better
solution to grow coffee beans in order to alleviate problems of water scarcity due to the
increased usage of blue water in South American coffee-growing regions.
21References
Bunn, C. et al. (2015) ‘A bitter cup: climate change profile of global production of Arabica and
Robusta coffee’, Climatic Change, 129(1–2), pp. 89–101. doi: 10.1007/s10584-014-1306-x.
Bethell, L. and Decarvalho, J. M. (1989) “1822–1850,” in Bethell, L. (ed.) Brazil: Empire and
Republic, 1822–1930. Cambridge: Cambridge University Press, pp. 45–112. doi:
10.1017/CBO9780511609497.003.
DaMatta, F. M. et al. (2007) ‘Ecophysiology of coffee growth and production’, Brazilian
Journal of Plant Physiology. Brazilian Journal of Plant Physiology, pp. 485–510. doi:
10.1590/S1677-04202007000400014.
Davis, A. P. et al. (2006) ‘An annotated taxonomic conspectus of the genus Coffea
(Rubiaceae)’, Botanical Journal of the Linnean Society, 152(4), pp. 465–512. doi:
10.1111/j.1095-8339.2006.00584.x.
Eira, M. T. S. et al. (2006) ‘Coffee seed physiology’, Brazilian Journal of Plant Physiology.
Sociedade Brasileira de Fisiologia Vegetal, pp. 149–163. doi: 10.1590/S1677-
04202006000100011.
Haggar, J. and Schepp, K. (2012) NRI Working Paper Series: Climate Change, Agriculture
and Natural Resources - Natural Resources Institute Coffee and Climate Change Impacts
and options for adaption in Brazil, Guatemala, Tanzania and Vietnam Coffee and Climate
Change Impacts and options f. Available at: www.nri.org (Accessed: 14 May 2021).
Hoekstra, A. Y. et al. (2011) The Water Footprint Assessment Manual, Water Footprint
Network. Available at:
http://www.waterfootprint.org/downloads/TheWaterFootprintAssessmentManual.pdf
(Accessed: 11 June 2021).
International Coffee Organization - What’s New (no date). Available at:
https://www.ico.org/ (Accessed: 13 May 2021).
Kilian, B. et al. (2004) Can the Private Sector be Competitive and Contribute to
Development through Sustainable Agricultural Business? A Case Study of Coffee in Latin
America, Agribusiness Management Review. Available at:
https://ageconsearch.umn.edu/record/8149 (Accessed: 11 June 2021).
Läderach, P. et al. (2013) Mesoamerican Coffee : Building a Climate Change Adaptation
Strategy, International Center for Tropical Agriculture. Available at:
http://201.207.189.89/handle/11554/7982 (Accessed: 11 June 2021).
Lashermes, P. et al. (1999) ‘Molecular characterisation and origin of the Coffea arabica L.
Genome’, Molecular and General Genetics, 261(2), pp. 259–266. doi:
10.1007/s004380050965.
Murtinho, F., Tague, C., de Bievre, B., Eakin, H. and Lopez-Carr, D., 2013. Water Scarcity in
the Andes: A Comparison of Local Perceptions and Observed Climate, Land Use and
Socioeconomic Changes. Human Ecology, 41(5), pp.667-681.
Nouri, H., Stokvis, B., Galindo, A., Blatchford, M. and Hoekstra, A., 2019. Water scarcity
alleviation through water footprint reduction in agriculture: The effect of soil mulching and
drip irrigation. Science of The Total Environment, 653, pp.241-252.
Ovalle-Rivera, O. et al. (2015) ‘Projected shifts in Coffea arabica suitability among major
global producing regions due to climate change’, PLoS ONE, 10(4), p. e0124155. doi:
10.1371/journal.pone.0124155.
22Rice, R. (2003) Coffee Production in a Time of Crisis, SAIS Review. Available at:
https://www-jstor-org.proxy-
ub.rug.nl/stable/26996452?seq=7#metadata_info_tab_contents (Accessed: 2 July 2021).
Schlindwein, S. L. et al. (2021) ‘Agricultural land use dynamics in the Brazilian part of La
Plata Basin: From driving forces to societal responses’, Land Use Policy, 107, p. 105519. doi:
10.1016/j.landusepol.2021.105519.
Schmitz, C. et al. (2013) ‘Blue water scarcity and the economic impacts of future agricultural
trade and demand’, Water Resources Research, 49(6), pp. 3601–3617. doi:
10.1002/wrcr.20188.
Szenthe, A. (2019) Top Coffee Producing Countries, WorldAtlas. Available at:
https://www.worldatlas.com/articles/top-coffee-producing-countries.html (Accessed: 10
June 2021).
Valiantzas, J. D. (2006) ‘Simplified versions for the Penman evaporation equation using
routine weather data’, Journal of Hydrology, 331(3–4), pp. 690–702. doi:
10.1016/j.jhydrol.2006.06.012.
Vorosmarty, C. J. (2000) ‘Global Water Resources: Vulnerability from Climate Change and
Population Growth’, Science, 289(5477), pp. 284–288. doi: 10.1126/science.289.5477.284.
Zullo, J. et al. (2011) ‘Potential for growing Arabica coffee in the extreme south of Brazil in a
warmer world’, Climatic Change, 109(3–4), pp. 535–548. doi: 10.1007/s10584-011-0058-0.
23You can also read