Measurement of Wheel Radius in an Automated Guided Vehicle - MDPI

Page created by Gene Vazquez
 
CONTINUE READING
Measurement of Wheel Radius in an Automated Guided Vehicle - MDPI
applied
           sciences
Article
Measurement of Wheel Radius in an Automated
Guided Vehicle
Miroslaw Smieszek 1 , Magdalena Dobrzanska 1             and Pawel Dobrzanski 2, *

 1    Department of Quantitative Methods, Faculty of Management, Rzeszow University of Technology, al.
      Powstancow Warszawy 10, 35-959 Rzeszow, Poland; msmieszk@prz.edu.pl (M.S.); md@prz.edu.pl (M.D.)
 2    Department of Computer Engineering in Management, Faculty of Management, Rzeszow University of
      Technology, al. Powstancow Warszawy 10, 35-959 Rzeszow, Poland
 *    Correspondence: pd@prz.edu.pl
                                                                                                  
 Received: 25 June 2020; Accepted: 5 August 2020; Published: 8 August 2020                        

 Abstract: In the case of automated guided vehicles using odometry, a very important issue is to
 know the actual rolling radius of the wheel used to calculate the position of the vehicle. This radius
 is not constant. Its changes depend on the elastic deformation of the band layer and wheel slip.
 The theoretical determination of the value of the radius and the nature of the change is very difficult.
 For this reason, it was decided to determine the rolling radii by the experimental method. For this
 purpose, an appropriate test stand was built and the proposed research method was checked.
 Within the tests, there was also obtained a number of interesting results characterizing the material
 used to build bands and the ranges of changes rolling radii for the tested material were specified.

 Keywords: automated guided vehicle; wheel radius; wheel slip; odometry errors; measurement
 methods

1. Introduction
     The use of an automated guided vehicle (AGV) is becoming more and more common. In many
cases, the routes implemented by these vehicles are subject to constant changes and are adapted
to the currently assigned task. The basic navigation system for most of these vehicles is odometry.
The navigation process using odometry assumes the constancy of parameters such as rolling radii and
wheelbases. Slips are also not included in this process. In real conditions, when working with different
loads and on different surfaces, these parameters change their values and slides occur. Not taking
these changes into account in the navigation algorithm leads to errors in determining the position.
     An extensive review regarding odometry errors is included in papers [1,2]. There are several types
of errors that affect the accuracy of the positioning process. These include systematic and unsystematic
errors. The systematic errors that arise in determining the current position during the movement of the
vehicle are aggregated [1,3]. Depending on the type of surface, the share of the systematic and the
unsystematic errors in the error of position determination may be different. In addition, odometry
errors can be caused by the same movement equations [4]. These equations describe any trajectory
through a series of short sections. The accuracy of this approximation depends on the sampling
frequency and vehicle speed.
     Many methods are used to correct errors. The first works related to error correction concern
systematic errors. Correction of these errors and calibration of the system takes place after traveling
the preset route section and measuring the error of the final position [1,2,5–8].
     Modern measurement techniques enable online measurements. A variety of techniques may
be used for measurements, a brief review of which is contained in [9–11]. In most solutions using

Appl. Sci. 2020, 10, 5490; doi:10.3390/app10165490                            www.mdpi.com/journal/applsci
Appl. Sci. 2020, 10, 5490                                                                             2 of 13

additional measurement systems, extensive filtration methods are applied. These can be online
methods such as at work [12–14] or offline as at work [15].
      All the aforementioned works assume that the wheel and ground are rigid, cooperation between
the wheel and the road takes place at one point and there is no slip. In recent years, there have been
works including changes in rolling radius and occurrence of wheel slip [16–21].
      Such changes in the rolling radius have been taken into account in the navigation process of the
vehicle presented in Sec. 4.1 and intended for the carriage of loads. The shape of the route and the
mass of the cargo carried during the operation of the vehicle is subject to change [22]. It depends on
the currently assigned task. In the case of a change in the mass of the transported load or its position
on the vehicle, the loads of individual wheels change. Along with these changes, the rolling radii of the
vehicle wheels are subject to change. Failure to take this fact into account in the calculation algorithm
will lead to errors. In order to reduce these errors, it is necessary to enter into the calculation algorithm
appropriate values of rolling radii taking into account the current wheel load. This operation will be
possible only after examining and determining the dependence of the rolling radius on the wheel load.
As part of the article, it was decided to describe the measurement methodology as well as the course of
experimental research aimed at determining the dependence of the rolling radius on the wheel load in
the vehicle under consideration.
      The paper is organized as follows. Section 2 presents a research object and its characteristics and
information about the wheel and its properties. Section 3 presents an overview of selected measurement
methods. As part of the review, errors resulting from failure to maintain ideal measuring conditions were
indicated. Taking into account the measurement capabilities and existing environmental conditions,
the most adequate measurement method for the further stage of experimental research was indicated.
      Section 4 presents the results obtained from experimental research. The wheel radii were
determined in these tests. These tests were carried out for various loads. As part of the section,
a statistical analysis of the measurement results was also carried out and characteristic values related to
the actual wheel operating conditions were determined. Section 5 contains a discussion of the obtained
results and their in-depth analysis. Finally, Section 6 presents the conclusions.

2. Determination of the Vehicle Position and the Role of the Rolling Radius

2.1. Movement of a Wheeled Vehicle
      The basic method of determining the position in motion of an autonomous vehicle is odometry.
Its rules are described in detail in the works [1–4,12]. There are many ways to drive and steer the vehicle.
      Most autonomous transport vehicles use two modes of driving and steering. In the first one,
independently powered rear wheels are used for driving and steering. In the second case, the front
wheel is driven and steered. In both cases, the data necessary to control the vehicle, such as the
rotational speed of the wheels or the steering angle of the front wheel, come from encoders installed at
the respective wheels. Figure 1 shows the vehicle in the X0 O0 Y0 reference system and the individual
quantities characterizing the vehicle movement are marked.
Most autonomous transport vehicles use two modes of driving and steering. In the first one,
independently powered rear wheels are used for driving and steering. In the second case, the front
wheel is driven and steered. In both cases, the data necessary to control the vehicle, such as the
rotational speed of the wheels or the steering angle of the front wheel, come from encoders installed
at theSci.
Appl.   respective     wheels. Figure 1 shows the vehicle in the X0O0Y0 reference system and the individual
           2020, 10, 5490                                                                             3 of 13
quantities characterizing the vehicle movement are marked.

                           Figure 1. Vehicle movement in the reference system X0 O0 Y0 .

     The position of a selected point O in the base reference system X0 O0 Y0 (Figure 1) is defined by the
state vector X j . The next position j + 1 of the vehicle point O is determined by the state vector X j+1 .
     State vector X j+1 in the j + 1 iteration is expressed by:

                                                      X j+1 = X j + V j+1 dt                                              (1)

where:                                                                                                      
                                                                               vO,j+1 cos θ j + ω j+1 dt
                                                                                                            
                                x j+1                 x j                                          
                                                                                                                 
                                                                                                                  
                                                                                          sin θ j + ω j+1 dt
                                                            
                   X j+1   =  y j+1         X j =  y j  V j+1 =  v                                  .    (2)
                                                                                O, j+1
                                                                                                              
                                    θ j+1                    θj
                                 
                                                                                             ω j+1
                                                                                                                  

    Velocities vO, j+1 and ω j+1 can be determined from the following relations, for a vehicle using
measured data from the rear wheels:
                                                                      
                                               vO,j+1 = vR,j+1 + vL,j+1 /2,                                               (3)
                                                                       
                                                ω j+1 = vR, j+1 − vL,j+1 /b,                                              (4)

where:
   vR, j+1 —speed of the right wheel in j + 1 step;
   vL, j+1 —speed of the left wheel in j + 1 step;
   ω j+1 —angular velocity of the vehicle relative to the reference system X0 O0 Y0 ;
   b—wheelbase of the driven wheels.
   For a vehicle using measurement data from the front wheel:
                                                                         
                                                 vO,j+1 = vK,j+1 cos α j+1 ,                                              (5)
                                                                        
                                                 ω j+1 = vK,j+1 sin α j+1 /l.                                             (6)

 where:
     vK,j+1 —speed of the front wheel in j + 1 step;
     αK,j+1 —turning angle of the front wheel in j + 1 step.
     To determine the speed of individual wheels: vR,j+1 , vL,j+1 vK,j+1 the data from the encoders and
the assumed values of the radius r of the vehicle wheel are used.
     In the above consideration, it was assumed that the wheels are rigid and they roll without slipping,
the contact between the wheel and the floor is a point contact and the radii r of the rear wheels are
the same.
K,    —turning angle of the front wheel in j + 1 step.
      To determine the speed of individual wheels: R, , L,             K,   the data from the encoders
and the assumed values of the radius r of the vehicle wheel are used.
      In the above consideration, it was assumed that the wheels are rigid and they roll without
slipping,
Appl.        the10,contact
      Sci. 2020,    5490   between the wheel and the floor is a point contact and the radii r of the4 rear
                                                                                                      of 13
wheels are the same.

2.2. Wheel and
2.2. Wheel and its
               Its Properties
                   Properties
     The
     The wheel
          wheel radius
                 radius used
                          used to
                                to determine
                                   determine thethe position
                                                      position from
                                                                from odometry
                                                                      odometry calculations     in real
                                                                                  calculations in  real movement
                                                                                                        movement
conditions  is not a  constant  value.  Its size   is influenced   by  many   factors. The  vehicle
conditions is not a constant value. Its size is influenced by many factors. The vehicle wheel        wheel  shown
                                                                                                         shown  in
in Figure  2a  has a   flexible belt.  Thanks     to  this, the  wheel   has  the ability to damp    vibrations
Figure 2a has a flexible belt. Thanks to this, the wheel has the ability to damp vibrations in selected         in
selected
operatingoperating   conditions.
           conditions.            The physical
                           The physical   modelmodel  of theofwheel
                                                              the wheel   is shown
                                                                      is shown    in in Figure2b.
                                                                                      Figure   2b.The
                                                                                                    Thewheel
                                                                                                        wheel has
                                                                                                               has
longitudinal
longitudinal and circumferential elasticity, which was modeled by a spring. Additionally, the model
               and circumferential    elasticity,  which    was modeled    by  a spring. Additionally,  the model
features
features damping
         damping elements
                    elements designed
                                designed toto dissipate
                                              dissipate vibrations.
                                                           vibrations.

                                       (a)
  Appl. Sci. 2020, 10, x FOR PEER REVIEW                                 (b)                                     4 of 13

                   Figure 2. Vehicle
                      Figure         wheel
                             2. Vehicle    (a) (a)
                                        wheel  view;  (b) (b)
                                                   view;   model, g—deflection,
                                                              model,            rS —static
                                                                     g—deflection,         radius.
                                                                                    rS—static radius.

      In the case of a stationary wheel, the vertical force loading the wheel reduces the radius of
         In the case of a stationary wheel, the vertical force loading the wheel reduces the radius of the
the wheel by the value of deflection g (Figure 2b). In the case of a rolling wheel, circumferential
   wheel by the value of deflection g (Figure 2b). In the case of a rolling wheel, circumferential
deformations and slips occur in the wheel’s contact with the ground. The rolling radius of the wheel
   deformations and slips occur in the wheel's contact with the ground. The rolling radius of the wheel
changes. These changes are additionally dependent on the type of horizontal forces and moments
   changes. These changes are additionally dependent on the type of horizontal forces and moments
acting on the wheels. There may be two cases here. In one of them, the wheel is driven; the other is
   acting on the wheels. There may be two cases here. In one of them, the wheel is driven; the other is
braked. The occurring phenomena have been comprehensively described in the works [23,24]. In real
   braked. The occurring phenomena have been comprehensively described in the works [23,24]. In real
operating conditions of the wheel there is a slip and it is better than to use the concept of the rolling
   operating conditions of the wheel there is a slip and it is better than to use the concept of the rolling
radius rt .
   radius rt.
      In the range of small slips up to 2–3%, the relationship between pressure forces and slip is linear
         In the range of small slips up to 2–3%, the relationship between pressure forces and slip is linear
in both cases of operation. This is shown schematically in Figure 3a.
   in both cases of operation. This is shown schematically in Figure 3a.

                                (a)                                                      (b)
         Figure
      Figure    3. Changes
             3. Changes     in wheel
                         in wheel    radius
                                  radius (a)(a)
                                             as as a function
                                                a function    of static
                                                           of static    load;
                                                                     load; (b)(b) during
                                                                               during    motion,
                                                                                      motion,    under
                                                                                              under thethe driving
                                                                                                        driving
         force/braking
      force/braking    force.
                    force.

     Changing
        Changingthethe
                    slipslip
                         value affects
                             value     the value
                                    affects      of the of
                                            the value   rolling radius. radius.
                                                           the rolling   The course
                                                                                Theofcourse
                                                                                       changes
                                                                                            of in the rolling
                                                                                               changes    in the
radius is shown
  rolling  radius schematically  in Figure 3b
                  is shown schematically       [25]. 3b [25].
                                            in Figure

  3. An Overview of Selected Measurement methods

  3.1. Introduction
       Rolling radius defined as the agreed size of the radius of such a rigid wheel, which at section L
  performs the same number of rotations nk. This describes Relationship (7):
                                                          L=2πrtnk.                                                  (7)
        Thus, the rolling radius of the wheel rt is determined by the formula:
                                                                 L
                                                            =        .                                               (8)
                                                                2 nk
Appl. Sci. 2020, 10, 5490                                                                              5 of 13

3. An Overview of Selected Measurement methods

3.1. Introduction
     Rolling radius defined as the agreed size of the radius of such a rigid wheel, which at section L
performs the same number of rotations nk . This describes Relationship (7):

                                                L = 2πrt nk .                                             (7)

      Thus, the rolling radius of the wheel rt is determined by the formula:

                                                        L
                                                rt =        .                                             (8)
                                                       2πnk

      Wheel slip of the driven wheel s is:

                                             vs   ωr − ωrt     rt
                                       s=       =          = 1− .                                         (9)
                                             vx      ωr        r

      Wheel slip of the braked wheel s is:

                                             vs   ωrt − ωr     r
                                       s=       =          = 1− .                                       (10)
                                             vx     ωrt        rt

 where:
      rt —rolling radius;
      r—free radius;
      vs —slip velocity;
      vx —wheel center speed.
      For the driven wheel in the slip range s from 0 to 1, the rolling radius rt changes from r to 0.
With the case of the rolling radius rt = 0 we deal when the vehicle stands v = 0 and the driven wheels
rotate at an angular speed ω > 0. For a nondriven wheel in the slip range s from 0 to 1, the rolling
radius rt varies from r to ∞. With the case of a rolling radius, rt = ∞ is when the vehicle moves at a
speed v > 0 and the braked wheel is blocked ω = 0. In the range of small slip to s = 0.02, the relationship
between vertical wheel load and circumferential force is linear [22].
      There are many advanced theoretical methods to determine the rolling radius as a function of
the type of work and load. The accuracy of these methods depends on the knowledge of specific
parameters. Sometimes, and in many cases, this requires additional experimental testing. For this
reason, it was decided to determine the rolling radii directly on the basis of experimental research.
According to Relationship (8), to determine the rolling radius, it is sufficient to measure the distance
traveled by the road L and read the recorded data on the quantities made by the wheel revolutions nk .
In this measurement method, it is very important to maintain the straight-line nature of the movement.
In real traffic conditions, there will always be smaller or larger deviations from the theoretical route.
These deviations are affected by the control system and incorrect initial position and values of the
rolling radii entered into the navigation algorithm.

3.2. Methodology of Measurements in Curved Motion
     With a large deviation of the actual track from the assumed theoretical course, the vehicle performs
arc motion (Figures 4 and 5). Determination of rolling radii from the dependence (8) for such a course
is subject to a significant error. The distance traveled along a curve differs from the length of the section
connecting the beginning and the end of the curve.
3.2. Methodology
     With a large   of deviation
                       Measurements   in Curved
                                 of the   actual Motion
                                                 track from the assumed theoretical course, the vehicle
performs    arc  motion  (Figures  4 and   5). Determination
     With a large deviation of the actual track from the      of rolling
                                                                  assumed radii from the dependence
                                                                             theoretical                (8) for
                                                                                          course, the vehicle
such  a course
performs         is subject
            arc motion      to a significant
                         (Figures  4 and 5). error.  The distance
                                               Determination       traveled
                                                              of rolling     along
                                                                          radii froma the
                                                                                       curve differs from
                                                                                          dependence    (8) the
                                                                                                             for
length  of the  section connecting   the beginning  and  the end  of the curve.
such a course is subject to a significant error. The distance traveled along a curve differs from the
Appl. Sci. 2020, 10, 5490                                                                                                   6 of 13
length of the section connecting the beginning and the end of the curve.

                                         Figure 4. An example of a curvilinear route.
                                         Figure4.
                                         Figure 4. An
                                                   An example
                                                      example of
                                                              of aa curvilinear
                                                                    curvilinear route.
                                                                                 route.
      In many cases, the recorded measurement data was characterized by high interference. A
fragment
      In    of such
       Inmany
          many  cases,a course
                  cases,thethe  is shown
                            recorded       in Figure 5.
                                      measurement
                                recorded                Cyclic
                                                     data
                                            measurement    datadeviations
                                                           was              andbymeasurement
                                                                characterized     high by
                                                                  was characterized        highdisturbances
                                                                                       interference.  A fragment
                                                                                                  interference. are
                                                                                                                 A
visible
of such  on
         a    the
           course  course.
                    is shown This
                               in   type
                                   Figure of
                                          5.  data
                                             Cyclichas  been
                                                    deviations subjected
                                                                 and       to appropriate
                                                                     measurement            filtration
                                                                                     disturbances
 fragment of such a course is shown in Figure 5. Cyclic deviations and measurement disturbances are are processes
                                                                                                        visible on
described
the
 visible oninThis
     course.    [15].
              the   type of data
                   course.    This has been
                                    type  of subjected
                                              data has to  appropriate
                                                         been  subjectedfiltration processesfiltration
                                                                           to appropriate     describedprocesses
                                                                                                          in [15].
described in [15].

                            Figure 5. View of oscillations and interference
                                                               interference on
                                                                            on aa selected
                                                                                  selected fragment.
                                                                                           fragment.
                            Figure 5. View of oscillations and interference on a selected fragment.
      There are   are many
                        many ways
                                ways to to determine
                                            determine the
                                                        the path
                                                             path traveled
                                                                    traveled in in curvilinear
                                                                                    curvilinear motion.
                                                                                                  motion. In the  the conducted
                                                                                                                      conducted
preliminary
preliminary
       There are    tests,
                    tests, two
                        many      methods
                            twoways
                                  methods      were  used,
                                               were used,
                                        to determine         shown
                                                        the shown      in  Figure
                                                                        in Figure
                                                              path traveled         6.
                                                                                     6. The
                                                                                in curvilinearfirst method       determines
                                                                                                    methodIndetermines
                                                                                                   motion.        the conducted the
                                                                                                                                the
distance
distance    ssc  between     the start   and  end  position  of  a selected  point   of the
 preliminary tests, two methods were used, shown in Figure 6. The first method determines the
               c                                                                             vehicle.  In   the
                                                                                                           the   second
                                                                                                                second   method,
characteristic
characteristic
 distance sc between markers theonstart
                       markers    onthethe
                                         reference
                                         and        surface
                                             reference        can
                                                              of a be
                                                         surface
                                              end position            used
                                                                    can   be to
                                                                   selected      measure
                                                                              used
                                                                              point        distance
                                                                                      to the
                                                                                     of   measure     sIn
                                                                                                        w , the
                                                                                                            e.g.,second
                                                                                             vehicle.distance     door  openings.
                                                                                                                   sw, e.g.,  door
                                                                                                                         method,
In both
openings.  methods,
 characteristic  In both  the  distance
                            methods,
                       markers     on the  d from  the
                                          thereference reference
                                               distance dsurface
                                                           from the surface  is
                                                                    canreference recorded
                                                                          be used surface   and   the counter
                                                                                               is recorded
                                                                                      to measure      distance    reads
                                                                                                               andswthe  the  data
                                                                                                                          counter
                                                                                                                     , e.g.,  door
from
reads  the
        the
 openings.
Appl.        encoders
               data
      Sci. 2020,In     from
                   10,both of  individual
                              the encoders
                       x FORmethods,
                              PEER REVIEW     wheels.
                                               of individual   wheels.
                                          the distance d from the reference surface is recorded and the counter              6 of 13
reads the data from the encoders of individual wheels.

      Figure 6. The
                The curve
                    curve linear
                          linear run
                                 run and measurement data, R—radius of curvature, d, dnn distance between
      vehicle and reference surface, sww, sCC measured path, 00 middle of the arc, half arc angle ϕ
                                              measured path,                                      φ..

     Knowledge of
     Knowledge          value of the radius of curvature R and half arc angle φ
                 of the value                                                 ϕ makes it possible to
determine the lengths of arcs traveled by the wheels and their rolling radii.
                                                               rolling radii.

3.3. Methodology
3.3. Methodology of
                 of Measurements
                    Measurements in
                                 in Rectilinear
                                    Rectilinear Motion
                                                Motion
     In order
     In  order to
               to meet
                  meet the
                        the requirements
                            requirements for
                                           for ensuring
                                               ensuring the
                                                          the straight-line  movement of
                                                               straight-line movement    of the
                                                                                            the vehicle,
                                                                                                vehicle, it
                                                                                                         it is
                                                                                                            is
necessary   to properly  control and  drive the vehicle.  This   can  be obtained, for example,
necessary to properly control and drive the vehicle. This can be obtained, for example, by movingby moving
along aa given
along    given reference
                referenceplane.
                          plane.AsAsshown
                                     shownininFigure
                                               Figure7,7,
                                                       asaspart
                                                             partof of
                                                                    this movement,
                                                                       this         thethe
                                                                            movement,   fixed distance
                                                                                           fixed       of the
                                                                                                 distance   of
selected  vehicle point and  the assumed  reference  plane  is maintained.
the selected vehicle point and the assumed reference plane is maintained.
3.3. Methodology
3.3. Methodology of
                 of Measurements
                    Measurements in
                                  in Rectilinear
                                     Rectilinear Motion
                                                 Motion
       In order
       In   order toto meet
                        meet the
                             the requirements
                                 requirements for
                                               for ensuring
                                                    ensuring the
                                                              the straight-line
                                                                  straight-line movement
                                                                                movement of of the
                                                                                               the vehicle,
                                                                                                   vehicle, itit is
                                                                                                                 is
necessary      to  properly   control and drive the  vehicle. This  can be  obtained, for example,
necessary to properly control and drive the vehicle. This can be obtained, for example, by moving   by  moving
along aa given
along        given reference
                     reference plane.
                               plane. As
                                      As shown
                                         shown inin Figure
                                                    Figure 7,
                                                           7, as
                                                              as part
                                                                 part of
                                                                       of this
                                                                          this movement,
                                                                               movement, the
                                                                                          the fixed
                                                                                              fixed distance
                                                                                                    distance of  of
Appl.
the    Sci. 2020, 10,
      selected        5490 point and the assumed reference plane is maintained.
                  vehicle                                                                                 7 of 13
the selected vehicle point and the assumed reference plane is maintained.

                                Figure 7.
                                Figure 7. Data
                                          Data recorded
                                          Data recorded during
                                               recorded during the
                                                               the movement
                                                                   movement of
                                                                            of the
                                                                               the vehicle.
                                                                                   vehicle.

        Due to
        Due
        Due    to the
               to the imperfections
                  the  imperfections of
                      imperfections       of the
                                          of  the reference
                                              the   reference surface
                                                   reference     surface and
                                                                 surface     and the
                                                                            and    the measuring
                                                                                   the   measuring system,
                                                                                         measuring        system, there
                                                                                                         system,    there may
                                                                                                                    there    may be
                                                                                                                             may   be three
                                                                                                                                   be  three
                                                                                                                                       three
 types
 types of
types      of errors.
          of errors.    The  first
              errors. The first of  of  these
                                    of these
                                        these isis  related
                                               is related
                                                   related to to  the
                                                              to the    nonlinearity
                                                                  the nonlinearity
                                                                        nonlinearity of    of   the
                                                                                           of the    reference
                                                                                               the reference      surface.
                                                                                                     reference surface.
                                                                                                                  surface. The The   second
                                                                                                                              The second
                                                                                                                                    second
 error
 error    is
         is  related
             related   to
                      to   the
                          the  structure
                               structure     of
                                            of   the
                                                the    reference
                                                      reference      surface.
                                                                    surface.    The    third    error
                                                                                                error   is
error is related to the structure of the reference surface. The third error is related to the accuracy of
                                                                                                       is  related
                                                                                                           related    to
                                                                                                                     to  the
                                                                                                                         the   accuracy
                                                                                                                              accuracy      of
                                                                                                                                            of
 the
 the   measuring
       measuring      device.
                      device.    All
                                 All  three    errors    affect  the   measurement           data
the measuring device. All three errors affect the measurement data which are used in the control     which    are  used    in
                                                                                                                           in  the
                                                                                                                               the  control
                                                                                                                                    control
 system. This
 system.
system.       This contributes
             This   contributesto
                    contributes    tothe
                                   to  theformation
                                       the  formationofof
                                            formation      ofvehicle
                                                               vehicleoscillations
                                                               vehicle     oscillations
                                                                           oscillations  ininin  relation
                                                                                              relation
                                                                                                relation    to
                                                                                                         toto
                                                                                                            thethe   assumed
                                                                                                                 assumed
                                                                                                               the  assumed       direction
                                                                                                                               direction
                                                                                                                                 direction  of
 of   movement.
 movement.        The  The
                        coursecourse
                                 of such of  such     oscillations
                                            oscillations    is shown    isinshown
                                                                              Figure    in
                                                                                        8a.
of movement. The course of such oscillations is shown in Figure 8a. Some of the errors in    Figure
                                                                                              Some    of8a.
                                                                                                          theSome
                                                                                                               errors  of
                                                                                                                        in  the  errors
                                                                                                                           measurement      in
 measurement
measurement          data
 data can be eliminated     can
                     data can be be  eliminated
                                  byeliminated
                                      applying by    by  applying
                                                     real-time
                                                         applying      real-time
                                                                   filtering.
                                                                      real-time     filtering.
                                                                                 Excessive         Excessive
                                                                                    filtering.deviation
                                                                                                  Excessive fromdeviation
                                                                                                                       the set
                                                                                                                deviation     from
                                                                                                                                 path
                                                                                                                              from    the
                                                                                                                                     thecanset
                                                                                                                                          set
 path
 be
path     can be
      partially
        can    be partially
                  partially
                   eliminated eliminated
                                  by the use
                             eliminated      by the
                                             by   the  use of
                                                            of real-time
                                                  of real-time
                                                       use      real-time     filtration.
                                                                    filtration.              An example
                                                                                    An example
                                                                             filtration.    An     example    of using
                                                                                                       of using
                                                                                                              of using    an online
                                                                                                                   an online
                                                                                                                          an   online
                                                                                                                                  filterfilter
                                                                                                                                          for
                                                                                                                                       filter
 for measurement
for    measurement
 measurement         data data
                         data   entered
                            entered
                                entered    into
                                       intointo   the
                                             thethe     control
                                                   control        system
                                                             system
                                                       control   system      is presented
                                                                                presented
                                                                         is presented
                                                                            is              in inin [12].
                                                                                                    [12].
                                                                                                [12].  The The
                                                                                                          The   benefits
                                                                                                             benefits
                                                                                                                benefits    of
                                                                                                                         ofof   using
                                                                                                                             using
                                                                                                                               using    such
                                                                                                                                     such
                                                                                                                                        such a
 a  filter
afilter are
   filter   are
           are   shown
              shown
                shown     in
                       inin  Figure
                           Figure
                             Figure    8b.
                                    8b.8b.

                                 (a)
                                 (a)                                                                    (b)
                                                                                                        (b)
       Figure 8.
      Figure
      Figure    8. The
               8.  The route
                   The   route of
                        route  of the
                               of the vehicle
                                  the vehicle with
                                      vehicle with the
                                              with the enlargement
                                                   the enlargement of
                                                       enlargement of the
                                                                      the selected
                                                                          selected fragment
                                                                                   fragment (a)
                                                                                            (a) before
                                                                                                before filtration;
                                                                                                       filtration;
       (b)
      (b)  after
      (b) after   filtration
           after filtration  along.
                 filtration along.
                             along.

     The application of online filtration has reduced deviations from the set driving path and thus
increased the accuracy of the rolling radius determination process. However, it is a big problem to find
the appropriate reference surface in real measurement conditions. Some of the surfaces used in the
research had discontinuities. The effect of these disturbances is visible peaks in Figures 4, 5 and 8.

3.4. Assessment of the Influence of Deviation from the Ideal Trajectory on the Value of the Rolling Radius
     In the case of a vehicle with a propulsion system presented in Section 4.1 small errors in the values
of the rolling radii and control system errors cause a slight oscillation A from the set driving path.
For the angle of deviation from the given path ψ = 0, the vehicle moves along the assumed direction
(Figure 9a). For an incorrectly defined initial position of the vehicle in which the deviation angle ψ , 0
the vehicle route deviates from the assumed direction of travel. The distance that can be covered is
limited by the width of the corridor and the value of the angle ψ (Figure 9b).
     Errors larger in the values of rolling radii cause a strong deviation C from the assumed trajectory.
The actual vehicle movement is carried out in a curve (Figure 9c). In all cases, oscillations coming from
the control system are visible on the course of the route.
For the angle of deviation from the given path ψ = 0, the vehicle moves along the assumed direction
  (Figure 9a). For an incorrectly defined initial position of the vehicle in which the deviation angle ψ ≠
  (Figure 9a). For an incorrectly defined initial position of the vehicle in which the deviation angle ψ ≠
  0 the vehicle route deviates from the assumed direction of travel. The distance that can be covered is
  0 the vehicle route deviates from the assumed direction of travel. The distance that can be covered is
  limited by the width of the corridor and the value of the angle ψ (Figure 9b).
  limited by the width of the corridor and the value of the angle ψ (Figure 9b).
          Errors larger in the values of rolling radii cause a strong deviation C from the assumed trajectory.
          Errors larger in the values of rolling radii cause a strong deviation C from the assumed trajectory.
  The
Appl. Sci.actual  vehicle
           2020, 10, 5490 movement is carried out in a curve (Figure 9c). In all cases, oscillations coming8 of 13
  The actual vehicle movement is carried out in a curve (Figure 9c). In all cases, oscillations coming
  from the control system are visible on the course of the route.
  from the control system are visible on the course of the route.

                     (a)                                        (b)                                   (c)
                     (a)                                        (b)                                   (c)
        Figure  9. Vehicle movementon    on themeasuring
                                                 measuring section: (a)   low   values ofofrolling error ψ = 0; (b)(b)
                                                                                                                    low
      Figure     Vehicle
             9. 9.
        Figure     Vehiclemovement
                            movement onthe   the measuring section:    (a)low
                                                             section: (a)   lowvalues
                                                                                 valuesof   rollingerror
                                                                                           rolling       ψψ
                                                                                                     error   = (b)
                                                                                                           = 0; 0;  lowlow
        values
      values of of rolling
                rolling    error
                         error ψ ψ ≠ 0;
                                    0;  (c)
                                       (c)  high
                                           high  values
                                                 values of
                                                        of rolling
                                                            rolling errors,
                                                                    errors,  L—direct
                                                                              L—directdistance
                                                                                       distance  between
                                                                                                   betweenthe start
                                                                                                            the     and
                                                                                                                 start and
        values of rolling error ψ ≠ 0; (c) high values of rolling errors, L—direct distance between the start and
                                 ,
        endpoints
      endpoints      of the route,
                 of the                A—amplitude
                                A—amplitude            of oscillation,   C—deviation,
                                                                 C—deviation,              λ—wavelength,
                                                                                  λ—wavelength,      ψ—angleψ ψ—angle
        endpoints    of route,
                         the route,   A—amplitudeof oscillation,
                                                       of oscillation,   C—deviation,      λ—wavelength,        deviation.
                                                                                                                —angle
        deviation.
        deviation.
      In order to determine the effect of oscillation and deviation from the target track on measurement
accuracy,In order    to  determine the effect of        oscillation   and deviation from the target track on
         In aorder
              seriestoof computer
                         determine calculations
                                       the effect of  were  done. and
                                                        oscillation         deviation from the target track on
   measurement     accuracy,
      The vehicleaccuracy,
                     moves from a series of
                                     the of  computer
                                         starting       calculations
                                                    point              were done.
                                                           to the endpoint.       The direct distance L between these
   measurement                  a series     computer   calculations   were done.
         The vehicle moves from the starting point to the endpoint. The direct distance L between these
points The
         is 40vehicle
               m. Vehicle
                       movestrajectory      is not ideal
                                from the starting    point and
                                                           to thedeviates
                                                                   endpoint.from Thethe   linedistance
                                                                                      direct   connecting    the start
                                                                                                        L between        and
                                                                                                                     these
   points is 40 m. Vehicle trajectory is not ideal and deviates from the line connecting the start and
   points is Therefore,
endpoints.    40 m. Vehiclethe actual   Lr path
                                trajectory   is not ideal and
                                                  traveled      deviates
                                                            by the         from
                                                                     vehicle        the linethan
                                                                               is greater     connecting         L. The
                                                                                                           the start
                                                                                                  the distance        andfirst
   endpoints. Therefore, the actual Lr path traveled by the vehicle is greater than the distance L. The first
   endpoints.
series          Therefore,
        of calculations      the actualthe
                          concerned      Lr path  traveled
                                              course        by theshown
                                                      of motion     vehiclein is Figure
                                                                                 greater 9a,
                                                                                          thanwhile
                                                                                                the distance  L. The
                                                                                                      the second      first of
                                                                                                                    series
   series of calculations concerned the course of motion shown in Figure 9a, while the second series of
   series of calculations
calculations   concerned concerned
                            the course the     course shown
                                         of motion    of motion    shown9c.
                                                               in Figure   in Figure
                                                                                In both9a,   while
                                                                                          cases, thethe secondtraveled
                                                                                                      distance   series of by
   calculations concerned the course of motion shown in Figure 9c. In both cases, the distance traveled
thecalculations
    vehicle underconcerned     the course
                      the assumed           ofconditions,
                                      traffic   motion shown     in Figure
                                                            marked
   by the vehicle under the assumed traffic conditions, marked
                                                                            9c. determined.
                                                                      Lr , was    In both cases,Using
                                                                                                   the distance  traveled
                                                                                                         Dependence
                                                                           Lr, was determined. Using Dependence
                                                                                                                         (11),
   by  the
the(11),   vehicle
     relative       under
              measurement   the  assumed
                                 error ∆    traffic
                                          was       conditions,
                                                determined.       marked   L r, was determined. Using Dependence
         the relative measurement error Δ was determined.
   (11), the relative measurement error Δ was determined.
                                                             Lr −−L
                                                       ∆Δ == −                                                       (11)(11)
                                                        Δ= L                                                         (11)
        The
      The   results
          results   ofthe
                  ofof  the calculationsare
                                         are shown in
                                                    in Figure 10.
        The results     thecalculations
                            calculations areshown
                                             shown in Figure  10.
                                                       Figure 10.
                                                                      0,006
       0,004                                                          0,006
       0,004
       0,003                                                          0,004
       0,003                                                          0,004
       0,002
       0,002                                                          0,002
       0,001                                                          0,002
       0,001
           0                                                             0
           00      0.02      0.04       0.06    0.08      0.1            00         0.5          1          1.5          2
             0     0.02      0.04   A, m0.06    0.08      0.1              0        0.5        C,1m         1.5          2
                                    A, m                                                       C, m
                               (a)                                                          (b)
                               (a)                                                          (b)
        Figure 10. Relative error in the function: (a) of the amplitude A of oscillation at the λ = 5m and L =
        Figure
      Figure 10.10.Relative
                    Relativeerror
                             error in
                                   in the
                                      the function:
                                          function:(a)(a)ofofthe
        40m; (b) of the deviation C at the A = 0 and L= 40m.
                                                                 amplitude
                                                               the         A of
                                                                   amplitude A oscillation at the
                                                                                of oscillation  at λthe  λ =and
                                                                                                      = 5m   5 mL and
                                                                                                                  =
        40m; (b) of the deviation  C at the A = 0 and L=  40m.
      L = 40 m; (b) of the deviation C at the A = 0 and L = 40 m.

     In both cases, it can be observed that the effect of the deviation C and oscillation A on the relative
error is quite large. To ensure the accuracy the deviation had to be minimized. Hence, it was decided to
use the modification of this method involving manual towing of the vehicle along a designated straight
line. Several dozen attempts at various vehicle loads have been made with this method. The load
values included future vehicle performance parameters.
     The measurements were carried out in the corridors of a rigid surface. One of these is showing
in Figure 11a. During the tests, the length of the distance L covered by the vehicle was measured.
The value of the distance was measured by a laser rangefinder and ranged from 34 m to 42 m. The results
of these tests and their analysis are presented in the next chapter. Basic research has been preceded by
many trial tests.
intended for transporting goods. The vehicle has three wheels. The front wheel is a drive and steering
wheel. This wheel is connected via gears with two DC electric motors. One of them built inside the
wheel is used to drive the vehicle. The second engine is located on the vehicle frame and, through a
worm gear, regulates the steering angle around the vertical axis of rotation. The rear wheels are
support     wheels.
Appl. Sci. 2020,        These wheels are connected with encoders (Figures 11b and 2a). Signals 9from
                 10, 5490                                                                          of 13
encoders are used to control the movement of vehicles.
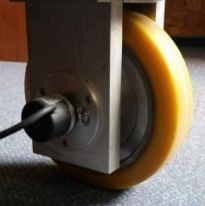
                             (a)                                                            (b)
                                   Figure
                                   Figure 11. The
                                              The tested
                                                   tested vehicle
                                                          vehicle (a)
                                                                  (a) view;
                                                                      view; (b)
                                                                            (b) scheme.
                                                                                scheme.

4. Research
      All vehicleOutcomes
                       wheelsandhaveTheir
                                        an Analysis
                                             outer diameter of 200 mm and a width of 50 mm. There are
polyurethane belts around the wheel circumferences. Compared to rubber, polyurethane is
4.1. Research Object
characterized by greater stiffness and therefore less elasticity. Wheels with such belting can be used
      The of
for loads    research
                8500 N. object shown in Figure 11 was built at the Rzeszow University of Technology. It is
intended     for transporting
      In order     to ensure the goods.    The vehicle
                                     possibility         has three wheels.
                                                   of autonomous               The front
                                                                       operation,          wheel isisaequipped
                                                                                     the vehicle          drive and with
                                                                                                                      steering
                                                                                                                            an
wheel. This
onboard          wheel isAll
            computer.      connected      via gears
                               data necessary      to with  twothe
                                                      control     DCmovement
                                                                       electric motors.
                                                                                   of the One
                                                                                           vehicleof them    built inside
                                                                                                      was supplied         the
                                                                                                                        to the
wheel is used
onboard            to drive
            computer         the the
                         using    vehicle.   The second
                                       National             engineNI
                                                    Instruments      is USB-6343
                                                                        located onmeasuring
                                                                                     the vehicle acquisition
                                                                                                     frame and, card.
                                                                                                                   throughThea
worm gear,
scheme         regulates
           of the         the steering
                    measuring     systemangle     around
                                            is shown    in the  vertical
                                                            Figure   11b.axis of rotation.
                                                                           Encoders    wereThe usedreartowheels
                                                                                                          measureare angular
                                                                                                                      support
wheels. and
velocity   These    wheelstraveled
                 distance    are connected
                                        data ofwith    encoders
                                                 individual        (Figures 11b and 2a). Signals from encoders are
                                                               wheels.
usedIn to the
          control
               casetheof movement
                         rear wheels,   of these
                                           vehicles.
                                                   were MHK40 encoders from Autonics Company. Encoders
      All vehicle
integrated     withwheels
                      electrichave  an outer
                                motors     werediameter
                                                  used to of 200  mm and
                                                             measure     thea width
                                                                              angular of 50 mm. There
                                                                                         position,    speedare and
                                                                                                               polyurethane
                                                                                                                     traveled
belts around
distance   of thethe  wheel
                    front     circumferences.
                          wheel.    The vehicle Compared         to rubber,
                                                   uses additional    laser polyurethane       is characterized
                                                                             sensors to determine                  by greater
                                                                                                         the position   of the
stiffnessrelative
vehicle    and therefore
                      to theless   elasticity.
                               adopted         Wheelssurface.
                                           reference     with such    belting canlasers
                                                                   DT50-P2113       be used werefor loads
                                                                                                    used of to 8500  N. the
                                                                                                                measure
      In order
distance         to ensure the
           perpendicular         possibility
                              to the           of autonomous
                                      longitudinal    axis of theoperation,   the vehicle
                                                                    vehicle, e.g., from the is corridor
                                                                                               equippedwall.withThe
                                                                                                                 an onboard
                                                                                                                      DT500-
computer.
A611           All data
       laser was     usednecessary
                          to measuretothe  control   the in
                                               distance  movement       of the vehicle
                                                             the longitudinal             was supplied to the onboard
                                                                                 direction.
computer      using on
      Depending       thethe
                          National     Instruments
                               batteries   used, the NI    USB-6343
                                                       vehicle          measuring
                                                                 in working    orderacquisition
                                                                                       had different  card.   The scheme
                                                                                                          weights.    For lowof
the measuring
capacity            system
            batteries,       is shown
                        the weight     wasin 100
                                             Figure
                                                  kg. 11b.
                                                      WithEncoders       were used
                                                              larger batteries        to measure
                                                                                enabling     severalangular
                                                                                                        hours ofvelocity  and
                                                                                                                  operation,
distance
the  weight traveled
               was 160 data
                         kg. of individual
                              The  maximum     wheels.
                                                 speed of movement was 1m/s. The expected maximum load is
2500 In
      N. the case of rear wheels, these were MHK40 encoders from Autonics Company.
Encoders integrated with electric motors were used to measure the angular position, speed and
traveled distance of the front wheel. The vehicle uses additional laser sensors to determine the position
of the vehicle relative to the adopted reference surface. DT50-P2113 lasers were used to measure
the distance perpendicular to the longitudinal axis of the vehicle, e.g., from the corridor wall. The
DT500-A611 laser was used to measure the distance in the longitudinal direction.
      Depending on the batteries used, the vehicle in working order had different weights. For low capacity
batteries, the weight was 100 kg. With larger batteries enabling several hours of operation, the weight was
160 kg. The maximum speed of movement was 1 m/s. The expected maximum load is 2500 N.
      In the vehicle from Figure 11, odometry was the primary navigation system. While the vehicle
was moving, fixed rolling radius values were used in the calculation algorithm. These values were
introduced into the calculation system at the beginning of the study. Additional measuring devices
installed, such as laser rangefinders, allowed the current position of the vehicle to be determined in
relation to the surroundings. Using the appropriate calculation systems [26] based on the measurements
obtained, it is possible to correct errors [10,11].

4.2. Research Results and Their Analysis
     As part of the basic research, 56 tests in four measuring series were carried out. In the individual
series were the following loads: 790 N, 1093 N, 1376 N and 1800 N. On the basis of the obtained test
results, the influence of the load on the rolling radii of the wheels was determined using the Statistica
package. The average values and standard deviations in a given series were obtained in the individual
4.2. Research Results and Their Analysis
      As part of the basic research, 56 tests in four measuring series were carried out. In the individual
series were the following loads: 790 N, 1093 N, 1376 N and 1800 N. On the basis of the obtained test
results,
Appl. Sci. the
           2020,influence
                  10, 5490 of the load on the rolling radii of the wheels was determined using the Statistica
                                                                                                           10 of 13
package. The average values and standard deviations in a given series were obtained in the
individual measurement series and were presented in Table 1. Coefficients of variation in individual
measurement series
measurement         series and
                           were were presented
                                 presented      in Table
                                            in Table     1. Coefficients
                                                      2. Apart from theofmeasurements
                                                                           variation in individual  measurement
                                                                                          for the left wheel and
series  were     presented   in Table 2. Apart from  the measurements    for the left wheel
the 1800 N load, the standard deviation values characterizing the dispersion of measurementsand  the 1800 N load,
                                                                                                              are
the standard
similar.           deviation   values characterizing  the dispersion  of measurements    are similar.

            Table 1.
            Table    Average values
                  1. Average values and
                                    and standard
                                        standard deviations
                                                 deviations in
                                                            in the
                                                               the individual
                                                                   individual measurement
                                                                              measurement series.
                                                                                          series.
                                             Left Wheel
                                             Left Wheel                     RightWheel
                                                                           Right Wheel
                   Force
                    ForceFNF,NN
                              ,N
                                        r,r,mm      σ
                                                    σx× 10 −6, ,m
                                                        10-6    m      r,r,m
                                                                           m           10-6−6
                                                                                  σσx×10    ,m,m
                        790
                       790            0.10046
                                      0.10046         25.632
                                                       25.632        0.10030
                                                                      0.10030       23.935
                                                                                      23.935
                       1093
                        1093          0.10049
                                      0.10049          25.103
                                                      25.103          0.10034
                                                                     0.10034          24.587
                                                                                    24.587
                       1376
                        1376          0.10054
                                      0.10054          20.679
                                                      20.679          0.10041
                                                                     0.10041          18.644
                                                                                    18.644
                       1800           0.10058          37.081         0.10046         20.101
                        1800          0.10058         37.081         0.10046        20.101

                      Table 2.
                      Table    Coefficients of
                            2. Coefficients of variation
                                               variation in
                                                         in individual
                                                            individual measurement
                                                                       measurement series.
                                                                                   series.

                     Force Force
                           FN (N)FN (N) 790790       1093
                                                    1093      1376 1376 1800 1800
                            Left wheel0.000255
                       Left wheel                  0.000250 0.000206
                                         0.000255 0.000250       0.000206    0.000369
                                                                      0.000369
                      RightRight
                            wheelwheel0.000239     0.000245      0.000186
                                         0.000239 0.000245 0.000186 0.000200 0.000200

     Figure
     Figure 12a,b
               12a,b shows
                     shows thethe determined
                                  determined regression
                                                regression curves
                                                            curves together
                                                                     togetherwith
                                                                               withaa 95%
                                                                                       95% confidence
                                                                                             confidence interval.
                                                                                                         interval.
For
For the
    the left
         left wheel,
              wheel, the
                      thecorrelation
                          correlation coefficient
                                      coefficient is 0.8617,
                                                     0.8617, and
                                                             and for
                                                                 for the
                                                                      the right
                                                                          right wheel,
                                                                                wheel, is
                                                                                        is0.9351
                                                                                          0.9351TheThecorrelation
                                                                                                       correlation
coefficient
coefficient for the left
                     left wheel
                          wheel assumes
                                 assumes smaller
                                           smaller values
                                                    values due
                                                           due to
                                                                to the
                                                                    the greater
                                                                        greater dispersion
                                                                                 dispersion of
                                                                                             of the
                                                                                                 themeasurement
                                                                                                    measurement
results. The   measure   of this spread
results. The measure of this spread is  is  the standard  deviation   (Table  1).

                           (a)                                                       (b)
     Figure 12. Linear
     Figure 12. Linear regression
                        regressionwith
                                   witha 95%
                                         a 95% confidence
                                             confidence     interval
                                                        interval     estimated
                                                                 estimated      forleft
                                                                           for (a)   (a)wheel;
                                                                                         left wheel;  (b)wheel.
                                                                                               (b) right  right
     wheel.
     Figure 13 shows a comparison of the obtained rolling radius courses as a function of load for
bothFigure
      wheels.13Theseshows    a comparison
                          courses           of the slope.
                                   have a similar   obtained  rolling
                                                          Their       radius courses
                                                                nonparallelism        as a function
                                                                                 is basically        of load
                                                                                              determined     for
                                                                                                          by the
both wheels.      These   courses  have a similar slope.  Their nonparallelism  is basically  determined
measurement for the left wheel loaded with 1800 N. This measurement is burdened with the largest          by the
measurement
error
 Appl. and         forx the
             the 10,
       Sci. 2020, largest   left wheel
                        FORdispersion
                             PEER      loaded  with 1800 points
                                       of the measuring
                                  REVIEW                   N. Thisshown
                                                                    measurement
                                                                         in Figureis12a.
                                                                                     burdened with the largest
                                                                                                           10 of 13
error and the largest dispersion of the measuring points shown in Figure 12a.

                         Figure  13.Comparison
                          Figure13.  Comparisonofofthe
                                                    theobtained
                                                        obtainedrolling
                                                                 rollingradius
                                                                         radiuscourses.
                                                                                courses.

      Using
        Usingthethedata
                    datafrom
                         fromTable
                               Table1,1,slip
                                          slipcoefficients
                                               coefficientsfor
                                                             forboth
                                                                 bothwheels
                                                                       wheelswere
                                                                              weredetermined.
                                                                                   determined.Figure
                                                                                                Figure1414shows
                                                                                                           shows
the  relationship    between  the  load  of  a given  wheel   and  slip. The obtained relationships
  the relationship between the load of a given wheel and slip. The obtained relationships for       for the
                                                                                                         the slip,
                                                                                                             slip,s
s ==0.1%
     0.1%totoss==0.3%
                   0.3%are
                        arelinear.
                            linear.
Figure13.
                              Figure  13.Comparison
                                          Comparisonofofthe
                                                         theobtained
                                                             obtainedrolling
                                                                      rollingradius
                                                                              radiuscourses.
                                                                                     courses.

        Usingthe
      Using      thedata
                      datafrom
                            fromTable
                                   Table1,1,slip
                                             slipcoefficients
                                                  coefficientsfor
                                                               forboth
                                                                   bothwheels
                                                                         wheelswere
                                                                                weredetermined.
                                                                                     determined.Figure
                                                                                                  Figure1414shows
                                                                                                             shows
 therelationship
the   relationshipbetween
                        betweenthe theload
                                       loadofofaagiven
                                                  givenwheel
                                                         wheelandandslip.
                                                                     slip.The
                                                                           Theobtained
                                                                               obtainedrelationships
                                                                                        relationshipsfor
                                                                                                      forthe
                                                                                                          theslip,
                                                                                                              slip,s s
Appl. Sci. 2020, 10, 5490                                                                                   11 of 13
==0.1%
   0.1%totos s==0.3%
                   0.3%arearelinear.
                               linear.

                                 (a)
                                (a)                                                                  (b)
                                                                                                    (b)
                    Figure14.
                   Figure
                   Figure  14.Load
                          14.  Loaddependence
                              Load  dependenceas
                                   dependence asasaa aslip
                                                        slipfunction
                                                      slip   functionfor
                                                            function   for(a)
                                                                     for    (a)left
                                                                          (a)    leftwheel;
                                                                               left   wheel;(b)
                                                                                     wheel;   (b)right
                                                                                            (b)    rightwheel.
                                                                                                 right   wheel.
                                                                                                        wheel.

       Aspart
      As   partofofthe
                    thestudy
                        studyalso
                              alsodetermined
                                   determinedthe
                                               thedeflection
                                                   deflectioncharacteristics
                                                               characteristicsof
                                                              characteristics ofofa aflexible
                                                                                       flexiblebend
                                                                                                bendasasa afunction
                                                                                                            function
 of  load. The  graph    presenting such characteristics is shown  in
of load. The graph presenting such characteristics is shown in Figure Figure  15.
                                                                     Figure 15.
                                                                             15.

                                 Figure
                                  Figure15.  Deflectioncharacteristics
                                         15.Deflection  characteristicsasasa afunction
                                                                               functionofofload.
                                                                                             load.

      The
        Thegraph
      The    graphpresented
           graph     presented
                    presented ininin
                                   Figure
                                    Figure151515
                                     Figure   isisaisahysteresis loop,
                                                       ahysteresis
                                                          hysteresis    which
                                                                     loop,
                                                                    loop,      is visible
                                                                            which
                                                                          which            after
                                                                                  isisvisible
                                                                                       visible   thethe
                                                                                                after
                                                                                              after  enlargement
                                                                                                      theenlargementof the
                                                                                                           enlargement  ofof
selected  fragment.
 theselected
the   selectedfragment.The dependence
                 fragment.The
                            Thedependence  of  the
                                   dependenceofofthe  deflection  on
                                                         thedeflectionthe
                                                             deflectionon pressure
                                                                         onthe       force
                                                                            thepressure     does
                                                                                 pressureforce    not
                                                                                             forcedoes differ
                                                                                                   doesnot    much
                                                                                                          notdiffer  from
                                                                                                              differmuch
                                                                                                                      much
the
fromlinear
 from       characteristic.
        thelinear
       the   linearcharacteristic.
                     characteristic.

5.5.Discussion
     Discussion
5. Discussion
       The
        Theresults
               resultsobtained
                        obtainedfromfromexperimental
                                              experimentalstudies studiesarearecharacterized
                                                                                 characterizedby     bysmall
                                                                                                         smalldispersion
                                                                                                                 dispersionand andthus
                                                                                                                                     thus
       The   results   obtained   from      experimental        studies   are  characterized        by  small  dispersion     and   thus
high   accuracy.
  highaccuracy.      A comparison
        accuracy.AAcomparison           of  coefficients
                         comparisonofofcoefficients          of  variation
                                              coefficientsofofvariation      with
                                                                   variationwith    the
                                                                               withthe    values
                                                                                      thevalues     obtained
                                                                                            valuesobtained      from
                                                                                                     obtainedfrom      the
                                                                                                                  fromthe   calculation
                                                                                                                         thecalculation
                                                                                                                             calculation
high
ofofrelative
     relativeerrors
                errors(Figure
                         (Figure10)
                                  10)indicates
                                         indicatesthat    appropriate
                                                            appropriateprecision
                                                      thatappropriate        precisionand  anddiligence
                                                                                                  diligencearearemaintained
                                                                                                                   maintainedduring
                                                                                                                                  during
of relative    errors  (Figure   10)  indicates     that                    precision     and   diligence   are  maintained     during
the  tests.
  thetests.   During
       tests.During
                Duringthethe  experimental
                          theexperimental
                               experimentaltests, tests,  it  was
                                                   tests,ititwas     tried
                                                                wastried    to  make
                                                                      triedtotomake
                                                                                 makethe the  oscillation
                                                                                           theoscillation    and
                                                                                                 oscillationand     deviation
                                                                                                               anddeviation      values
                                                                                                                      deviationvalues
                                                                                                                                  values
the
smaller
  smallerto    A = 0.025   mmand    CC==0.3     m.   The   calculated     values    of  the  coefficient   ofofvariation    Table
                                                                                                                             Table222for
smaller    totoAA==0.025
                      0.025m    andC
                               and           0.3m.
                                         = 0.3   m.TheThecalculated
                                                            calculatedvaluesvaluesof ofthe
                                                                                         thecoefficient
                                                                                               coefficientof     variationTable
                                                                                                               variation               for
                                                                                                                                      for
both
  bothwheels,
         wheels,except      for
                    exceptfor   the
                             forthe  load
                                 theload      with
                                        loadwith     the
                                               withthe    force
                                                       theforce
                                                            forceF FFNN== 1800
                                                                          1800N, N,  are
                                                                                 N,are     comparable.
                                                                                     arecomparable.
                                                                                            comparable.For  For aa force
                                                                                                            For      force load   of FNN =
                                                                                                                            load of
both   wheels,    except                                            N = 1800                                     a force load    of FFN =
=1800
   1800N, N,thethecoefficient
                    coefficientofofvariation
                                     variationfor   forthe
                                                         theleftleftwheel
                                                                     wheel is84% 84%higher.
                                                                                        higher.The  Thevalues
                                                                                                          values ofthe  thecoefficient
                                                                                                                            coefficient
1800 N,     the coefficient    of variation for        the left    wheel isis84%     higher. The       values ofofthe    coefficient ofof
ofvariation
    variationare areinfluenced
                      influenced  byby thethe  impossible
                                             impossible          to completely      eliminate      deviationsandand     oscillations   as
variation are     influenced by     the    impossible      totocompletely
                                                                 completely     eliminate
                                                                              eliminate        deviations
                                                                                             deviations    and      oscillations
                                                                                                                  oscillations  asaswell
                                                                                                                                     well
well   as,
  as,for   for   example,
       forexample,           unexpected
             example,unexpected
                          unexpectedaccidental  accidental
                                            accidentalslips     slips  in
                                                            slipsininthe   the  contact
                                                                         thecontact
                                                                              contactofoftheof  the  wheel
                                                                                               thewheel      with
                                                                                                     wheelwithwiththethe  surface
                                                                                                                      thesurface    and
                                                                                                                            surfaceandand
as,
measurement
  measurementerrorserrors   in data
                     errorsinindata   recording.
                                 datarecording.
                                         recording.The The   calculations
                                                        Thecalculations       of the
                                                               calculationsofofthe     slip
                                                                                   theslip   coefficients
                                                                                         slipcoefficients   s  as  a function
                                                                                               coefficientss sasasaafunction    of load
                                                                                                                       functionofofload
                                                                                                                                     load
measurement
carried out show their linear relationship (Figure 14). Equation (10) used for calculations takes into
account the elastic deformation of the wheel and microslips in the contact between the wheel and the
surface. According to the information contained in a series of studies and in Figure 3, for low values of
slips s < 2%, the relationship between the force acting on the wheel and the slip is linear.
       The diagram in Figure 15 clearly indicates the elastic properties of the belt material. This graph
has the shape of a hysteresis loop. The field contained inside the hysteresis loop indicates the ability to
damp vibrations.
       The test results and their courses presented in Figures 14 and 15 are compatible with the examples
shown in many works [23–25]. This proves the correctness of the adopted methodology and diligence
in the course of research.
       The results obtained and the relationships developed on their basis are very important for the
automated guided vehicle. Especially in the vehicle shown in Figure 11. In the vehicle shown in
Appl. Sci. 2020, 10, 5490                                                                                     12 of 13

Figure 11, the rear wheels do not carry any driving or braking forces and are used to measure the
distance traveled.
      During the tests, the force loading the wheel did not exceed 21% of the maximum wheel load.
By increasing the wheel load by 1010 N from 790 N to 1800 N, the relative increase in the rolling radius
was 0.12%. Because with the slip below 2%, all changes are linear, a further increase in the load by
the force of 1010 N and 2020 N will result in an increase of the rolling radius by 0.24% and 0.36%.
The increments of the rolling radius are related to the value obtained under the load of 790 N. In the
last case, the total force on the wheel will be 3820 N. This is less than half the allowable force.
      Assuming that only one wheel is subject to load changes, the other wheel is loaded with a constant
force F = 790 N, using the dependencies (1)–(4), it is possible to determine the deviation from the set route
and the radius of the curve along which the vehicle will move. The results are presented in Table 3.

                                   Table 3. Radii of curvature and deviation from the track.

         Additional Loading Force FN                                             Deviation from the Track to the
                                                      Radius of the Arc R (m)
       Over the Initial Value FN = 790 (N)                                             Road L = 40 m (m)
                            1010                                503                            1.59
                            2020                                251                            3.20
                            3030                                168                            4.84

     The analysis of the data in Table 3 shows that the differences in the load on the wheels cause
significant changes in the trajectory carried out by the vehicle. Correction of the above errors can be
made through additional navigation systems or by taking into account corrections made to the control
system, coming from the load measurement system of a given wheel.

6. Conclusions
     The conducted experimental tests showed the usefulness of the proposed measurement method.
The main purpose of the research was to determine the relationship between the wheel’s rolling radius
and its load. The main tests were preceded by a description of elastic wheel properties and presentation
of possible measurement methods. After considering the preferred accuracy and availability of
measuring equipment, the most favorable measurement methodology was selected. It is important to
know the actual values of the wheel radii during vehicle operation. This is particularly true when
odometry is the basic navigation system. This problem is even more important when the mass of
loads carried by the vehicle changes within the permissible ranges for a given vehicle. The developed
measurement methodology may also be useful for the initial determination of the value of wheel rolling
radii. This is especially important for newly built vehicles. The wheel manufacturers do not provide
the value of the rolling radii and, in addition, these wheels differ in dimensions. These differences
probably fall within the tolerance of performance. However, from the point of view of odometry,
they are important.

Author Contributions: Conceptualization, M.S., M.D. and P.D.; Methodology, M.S., M.D. and P.D.; Software,
M.S., M.D. and P.D.; Formal Analysis, M.S., M.D. and P.D.; Investigation, M.S., M.D. and P.D.; Resources, M.S.,
M.D. and P.D.; Data Curation, M.S., M.D. and P.D.; Writing—Original Draft Preparation, M.S., M.D. and P.D.;
Writing—Review & Editing, M.S., M.D. and P.D.; Visualization, M.S., M.D. and P.D. All authors have read and
agreed to the published version of the manuscript.
Funding: This research received no external funding.
Conflicts of Interest: The authors declare no conflict of interest.

References
1.    Borenstein, J.; Feng, L. Measurement and correction of systematic odometry errors in mobile robots.
      IEEE Trans. Robot. Autom. 1996, 12, 869–880. [CrossRef]
Appl. Sci. 2020, 10, 5490                                                                                    13 of 13

2.    Chong, K.S.; Kleeman, L. Accurate odometry and error modelling for a mobile robot. In Proceedings of the
      IEEE International Conference on Robotics and Automation, Albuquerque, NM, USA, 25–25 April 1997.
      [CrossRef]
3.    Kelly, A. Linearized error propagation in odometry. Int. J. Robot. Res. 2004, 23, 179–218. [CrossRef]
4.    Epton, T.; Hoover, A. Improving odometry using a controlled point laser. Auton. Robot. 2012, 32, 165–172.
      [CrossRef]
5.    Lee, K.; Jung, C.; Chung, W. Accurate calibration of kinematic parameters for two wheel differential mobile
      robots. J. Mech. Sci. Technol. 2011, 25, 1603–1611. [CrossRef]
6.    Martinelli, A. The odometry error of a mobile robot with a synchronous drive system. IEEE Trans. Robot. Autom.
      2002, 18, 399–405. [CrossRef]
7.    Jung, C.; Moon, C.; Jung, D.; Choi, J.; Chung, W. Design of test track for accurate calibration of two wheel
      differential mobile robots. Int. J. Precis. Eng. Manuf. 2014, 15, 53–61. [CrossRef]
8.    Kelly, A. Fast and easy systematic and stochastic odometry calibration. In Proceedings of the International
      Conference on Robots and Systems 2004 (IROS 2004), Sendai, Japan, 28 September–2 October 2004.
9.    Śmieszek, M.; Dobrzańska, M.; Dobrzański, P. Laser navigation applications for automated guided vehicles.
      Meas. Autom. Monit. 2015, 61, 503–506.
10.   Nguyen, V.; Gchter, S.; Martinelli, A.; Tomatis, N.; Siegwart, R. A comparison of line extraction algorithms
      using 2D range data for indoor mobile robotics. Auton. Robot. 2007, 23, 97–111. [CrossRef]
11.   Zhao, Y.; Chen, X. Prediction-based geometric feature extraction for 2D laser scanner. Robot. Auton. Syst.
      2011, 59, 402–409. [CrossRef]
12.   Śmieszek, M.; Dobrzańska, M. Application of Kalman filter in navigation process of automated guided
      vehicles. Metrol. Meas. Syst. 2015, 22, 443–454. [CrossRef]
13.   Kaniewski, P.; Gil, R.; Konatowski, S. Eestimation of UAV position with use of smoothing algorithms.
      Metrol. Meas. Syst. 2017, 24, 127–142. [CrossRef]
14.   Shen, K.; Selezneva, M.S.; Neusypin, K.A.; Proletarsky, A.V. Novel variable structure measurement system
      with intelligent components for flight vehicles. Metrol. Meas. Syst. 2017, 24, 347–356. [CrossRef]
15.   Dobrzańska, M.; Dobrzański, P.; Śmieszek, M.; Pawlus, P. Selection of Filtration Methods in the Analysis of
      Motion of Automated Guided Vehicle. Meas. Sci. Rev. 2016, 16, 183–189. [CrossRef]
16.   Meng, Q.; Bischoff, R. Odometry based pose determination and errors measurement for a mobile robot with
      two steerable drive wheels. J. Intell. Robot. Syst. 2005, 41, 263–282. [CrossRef]
17.   Ojeda, L.; Borenstein, J. Methods for the reduction of odometry errors in over-constrained mobile robots.
      Auton. Robot. 2004, 16, 273–286. [CrossRef]
18.   Song, X.; Seneviratne, L.; Althoefer, K. A vision based wheel slip estimation technique for mining vehicles.
      In Proceedings of the 2nd IFAC Workshop on Automation in Mining, Mineral and Metal Industry (IFACMMM),
      Vina del Mar, Chile, 14–16 October 2009.
19.   Antonelli, G.; Chiaverini, S. Linear estimation of the physical odometric parameters for differential-drive
      mobile robots. Auton. Robot. 2007, 23, 59–68. [CrossRef]
20.   Gutirrez, J.; Apostolopoulos, D.; Gordillo, J. Numerical comparison of steering geometries for robotic vehicles
      by modeling positioning error. Auton. Robot. 2007, 23, 147–159. [CrossRef]
21.   Doh, N.; Choset, H.; Chung, W. Relative localization using path odometry information. Auton. Robot. 2006,
      21, 143–154. [CrossRef]
22.   Smieszek, M.; Dobrzanska, M.; Dobrzanski, P. The impact of load on the wheel rolling radius and slip in a
      small mobile platform. Auton. Robot. 2019, 43, 2095–2109. [CrossRef]
23.   Genta, G. Introduction to the Mechanics of Space Robots; Springer: New York, NY, USA, 2012; pp. 171–215.
24.   Jazar, R.N. Vehicle Dynamics Theory and Aplication; Springer: New York, NY, USA, 2008; pp. 98–161.
25.   Ellis, J.R. Vehicle Handling Dynamics; Wiley-Blackwell: London, UK, 1994; pp. 1–208.
26.   Sapietova, A.; Saga, M.; Kuric, I.; Vaclav, S. Application of optimization algorithms for robot systems
      designing. Int. J. Adv. Robot. Syst. 2018, 15, 1–10. [CrossRef]

                            © 2020 by the authors. Licensee MDPI, Basel, Switzerland. This article is an open access
                            article distributed under the terms and conditions of the Creative Commons Attribution
                            (CC BY) license (http://creativecommons.org/licenses/by/4.0/).
You can also read