Sustainability of Machinery Traffic in Vineyard - ResearchGate
←
→
Page content transcription
If your browser does not render page correctly, please read the page content below
Article

Sustainability of Machinery Traffic in Vineyard
Domenico Pessina *, Lavinia Eleonora Galli, Stefano Santoro and Davide Facchinetti

                                         Dipartimento di Scienze Agrarie e Ambientali, Università degli Studi, 20133 Milan, Italy;
                                         lavinia.galli@unimi.it (L.E.G.); stefano.santoro@unimi.it (S.S.); davide.facchinetti@unimi.it (D.F.)
                                         * Correspondence: domenico.pessina@unimi.it; Tel.: +39-02-503-16876

                                         Abstract: Viticulture involves significant levels of machinery traffic, causing heavy soil compaction.
                                         In particular, the compaction of the subsoil is increased; a deep tillage could certainly solve the
                                         problem, but the risk of damage to the plants’ root system is high. The aim of this study was to
                                         investigate the trend of both the top- and the sub-soil compaction in a hillside vineyard located in
                                         Tuscany (Italy), investigating different machine-implement combinations, i.e., self-propelled ma-
                                         chinery or narrow tractor coupled to implements. The tests were repeated periodically along the
                                         entire growing season, approximately every 6–8 weeks (end of May, end of July and first decade of
                                         October). A single test included at least 50 sample measurements, recorded randomly along each
                                         inter-row investigated. In the surveyed field, the inter-rows were alternatively covered with grass,
                                         or tilled in the top layer during the previous wintertime. Two experimental test sets were developed:
                                         the first involved the use of two implements (a sprayer and a grape harvester) towed by narrow
                                         tractors, while in the second the pesticide distribution and the harvesting were performed with a
                                         properly equipped self-propelled tool carrier. All the other farming operations were executed using
                                         the same implements in both cases. Balanced use of the self-propelled tool carrier and the traditional
                                         tractor-implement combination allows a better distribution of the soil compaction (in particular in
Citation: Pessina, D.; Galli, L.E.;      the top-soil), thus improving the root-growing efficiency.
Santoro, S.; Facchinetti, D.
Sustainability of Machinery Traffic      Keywords: compaction; top-soil; sub-soil; self-propelled tool carrier; narrow tractor
in Vineyard. Sustainability 2021, 13,
2475. https://doi.org/10.3390/su1305
2475

                                         1. Introduction
Academic Editors: Eugenio Cavallo,
Niccolò Pampuro and Marcella
                                               Soil compaction is one of the major problems facing modern agriculture [1]; it is re-
Biddoccu                                 lated to soil aggregates, because it alters the spatial arrangement, size and shape of clods
                                         and aggregates and consequently the pore spaces both inside and between these units [2].
Received: 19 January 2021                Moreover, it is significantly reflected in the reduction of the fertility and production ca-
Accepted: 19 February 2021               pabilities of the soil [3].
Published: 25 February 2021                    In perennial crops (as well as in forestry [4]), compaction is also aggravated by the
                                         difficulty of soil structure restoration through tillage operations, both in the top- and sub-
Publisher’s Note: MDPI stays neu-        soil, which may require implements not suitable for work among the rows; moreover,
tral with regard to jurisdictional       deep tillage could damage heavily the roots of plants.
claims in published maps and insti-
                                               Plant root form, length distribution, radius distributions, branching, and overall
tutional affiliations.
                                         plant vigor have all been demonstrated to be heavily influenced by soil structure. Simi-
                                         larly, characterization of soil structure has shown that plant roots and their associated
                                         chemical and biological environments are strong determinants of the character of soil
Copyright: © 2021 by the authors.
                                         structure [5].
Licensee MDPI, Basel, Switzerland.             Compacted soils can affect crop root growth and the soil water-holding capacity, re-
This article is an open access article   duce nutrient uptake and make the growing crops more prone to diseases. All these ef-
distributed under the terms and con-     fects can lower final crop yields. Compacted soil is much more prone to soil erosion and
ditions of the Creative Commons At-      run-off [6].
tribution (CC BY) license (http://cre-         In highly mechanized viticulture, the tractor could pass among the rows up to 22
ativecommons.org/licenses/by/4.0/).      times per year in the vineyards traditionally cultivated, and 20% less in grass-covered

Sustainability 2021, 13, 2475. https://doi.org/10.3390/su13052475                                                   www.mdpi.com/journal/sustainability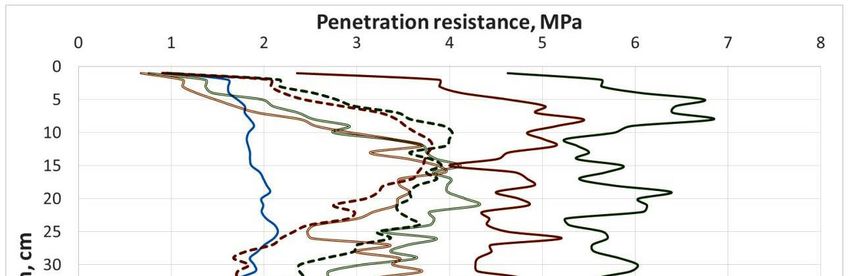
Sustainability 2021, 13, 2475 2 of 11
fields [7]. The effect on soil compaction and both hydrological and erosional processes of
machinery traffic were widely investigated on a sloping vineyard [8]. On the other hand,
it was ascertained that sub-soil compaction in a vineyard is mostly to be attributed to ma-
chinery wheel load [9]. According to some studies [10–12], the wheel axle load, the num-
ber of passages over the same track, the soil state during the passage and above all the soil
moisture content significantly affect the local soil compaction. Moreover, quite a strong
effect on soil compaction in the wheel track in relation to the number of wheel passages
was found [13].
The effect of wheel load (11, 15 and 33 kN) and tyre inflation pressure (70, 100 and
150 kPa) was also investigated [14]; in this case, the tyre inflation pressure had the greatest
influence on stress values under wheel at a depth of 0.1 m, and small influence at depth
values of 0.3 m and deeper. The loading highlighted an opposed behaviour, changing sig-
nificantly the stress in deeper layers. Similar results were reported in other investigations
[15,16], where the soil density in the tyre passage track at depth 0.2 m increased with an
increase in wheel loading and inflation pressure, and decreased with an increase in the
speed of passage. On the other hand, different inter-row management, with periodic till-
age or grass covering involved careful studies about runoff and soil loss in sloping vine-
yard [17]. The evaluation of the soil compaction in vineyards can be carried out by means
of in situ soil strength measurements, for example with a portable penetrometer [18].
The aim of this study was to investigate the trend of both the top- and sub-soil com-
paction in a hillside vineyard located in Tuscany (Italy), in subsequent periods along an
entire growing season. The soil penetration resistance was measured in some inter-rows,
by using two different machine combinations, as follows:
a classical solution, traditionally used by wine growers in Tuscany, repre-
sented by narrow tractors coupled with towed implements;
or, as an alternative, a self-propelled tool carrier equipped with equivalent
implements to carry out the same operations.
The details of machinery used and the operations carried out are shown in Materials
and method section.
2. Materials and Methods
The tests were carried out in a vineyard inside of the “Chianti Classico DOC” district,
located in the Castellina in Chianti municipality, Siena province (Tuscany, Italy), latitude
43°28'9"12 N, longitude 11°17'19"32 E, altitude above sea level 572 m. The vines (Sangio-
vese, Cabernet Sauvignon and Merlot varieties) have an average age of about 30 years.
The cultivating density is 4000 plants/ha, resulting from a pattern of 2.5 m between rows
and 1 m along the row, with wooden poles. In the previous wintertime, a top-soil tillage
was carried out on alternate inter-rows, by using a sub-soiler. The surveyed field, named
“Le piazze” (located inside of the “Gretole” vineyard), was divided into two experimental
areas, separated by a buffer zone of 10 m, in which the experimental data were not rec-
orded. The soil analysis detected a silty-clay-loam soil type [18], with a remarkable
amount of calcareous skeleton. The average slope of the vineyard is about 8%. More soil
details of the surveyed field are shown in Table 1.
Table 1. Main soil physical and chemical features of the surveyed field “Le piazze”, located inside
of the “Gretole” vineyard).
Feature Value
Sand: 20.0%
Silt: 46.5%
Texture
Clay: 33.5%
Skeleton: 60.9 g/kg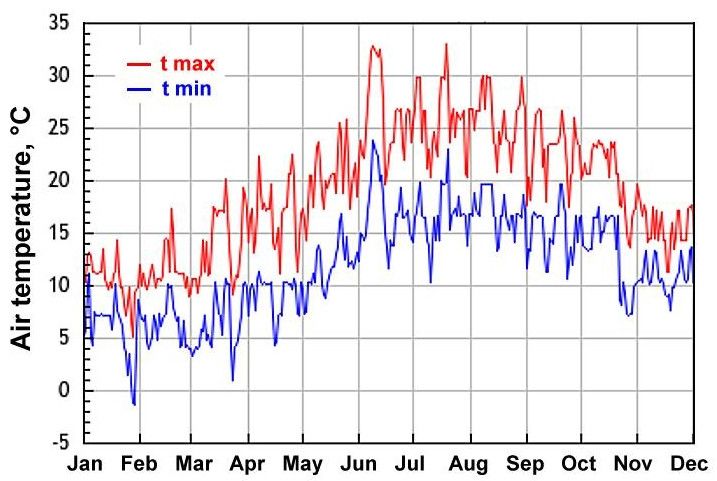
Sustainability 2021, 13, 2475                                                                                         3 of 11

                                                          pH                                          8.45
                                                       Salinity                                  0.237 mS/cm
                                                   Total limestone                                 236 g/kg
                                                  Active limestone                             126 g (CaCO3)/kg
                                                   Organic carbon                                     0.4%
                                                   Organic matter                                     0.7%
                                              Cation exchange capacity                          19.5 mEq/100 g
                                                        N tot                                      0.89 g/kg
                                                 P2O5 (assimilable)                               1.93 mg/kg
                                                 Ca (exchangeable)                               3757.0 mg/kg
                                                 Mg (exchangeable)                               302.0 mg/kg
                                                K20 (exchangeable)                               147.0 mg/kg
                                                 Fe (exchangeable)                                7.20 mg/kg

                                      The soil penetration resistance was measured with an electronic penetrometer driven
                                manually, equipped with a 30° inclination cone of 1 cm² total base area, as defined in
                                ASAE S313.3 [19] and ASAE EP542 [20]. The penetrometer, make Eijkelkamp, model Pen-
                                etrologger, is composed by a measuring needle interchangeable tip, a load cell (to detect
                                the force), an ultrasonic sensor (for measuring the penetration depth) and a set of elec-
                                tronics including a microprocessor, a GPS module, a memory module and a battery pack.
                                The measurements were carried out both in inter-rows covered with grass or previously
                                tilled in the top-soil. A single test included at least 50 sample measurements, recorded
                                randomly along each inter-row investigated. Ten to 12 inter-rows for each testing condi-
                                tion were investigated. Some samples were also performed in the wheel ruts, created both
                                by the narrow tractors and the self-propelled tool carriers. Standard statistical parameters
                                (means, standard deviation, student t-test) were considered to evaluate the significance of
                                the results.
                                      To ascertain the initial soil condition, and consequently to obtain a reference to be
                                compared to the following surveying campaigns, a preliminary set of measurement was
                                carried out on the first decade of April, before any machinery passage into the vineyard
                                for the considered growing season. The subsequent compaction measurements were car-
                                ried out every approximately 6–8 weeks (end of May, end of July and first decade of Oc-
                                tober, this last after the grape harvesting). In the year of the tests, the monthly rainfall
                                trend is shown in Figure 1; the min/max air temperature trend is shown in Figure 2. The
                                soil moisture content (wet basis) were measured at the time of the tests campaigns, for the
                                two layers 0–30 cm and 30–60 cm, both for the tilled and grass-covered inter-rows (Table
                                2).

                                Figure 1. Monthly rainfall trend in the surveyed field.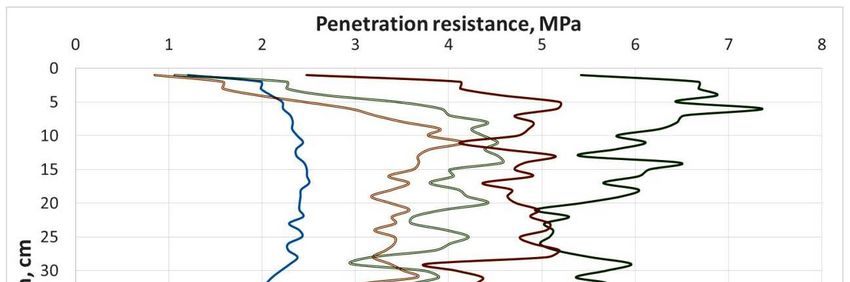
Sustainability 2021, 13, 2475                                                                                                   4 of 11

                                Figure 2. Min/max air temperature trend in the surveyed field.

                                Table 2. Soil moisture content of the soil in the surveyed field, along the entire growing season.

                                                Period                            Soil Moisture Content (w.b.), %
                                                                                 Tilled             Covered by Grass
                                                                               Inter-Rows               Inter-Rows
                                                                          0–30 cm     30–60 cm    0–30 cm       30–60 cm
                                         first decade of April              20.5        21.2        21.3          21.6
                                               end of May                   14.7        19.0        15.4          19.3
                                               end of July                  13.5        16.3        14.3          16.7
                                       first decade of October              11.8        14.2        12.8          14.4

                                     Apart from the pesticide treatments and the grape harvesting, all the other agricul-
                                tural tasks were carried out using the same machinery, working in identical operating
                                conditions. More in detail, a 4WD narrow tractor make Lamborghini model RF90 was
                                used in the traditional combination, coupled to a towed pneumatic sprayer, make KWH,
                                model B612, for the pesticide treatments and a towed grape harvester, make Pellenc,
                                model 8050, for the grape harvesting (Table 3). In the self-propelled combination, a tool
                                carrier, make Pellenc, model 3300, was fitted with a pneumatic sprayer module, make
                                Cima, model Spider for the pesticide treatments, and a self-propelled grape harvester
                                module make Pellenc, model 4560, for the grape harvesting. In both combinations, along
                                the entire growing season a total of 14 passes for pesticide treatments and one pass for the
                                grape harvesting were executed.

                                Table 3. Main technical characteristics of the machinery combinations involved in the surveyed
                                vineyard cultivation.

                                Combination                     Traditional                            Self-propelled
                                                                                             Self-propelled
                                                                            Narrow
                                  Machinery        Narrow Tractor/                           Tool Carrier/    Self-propelled
                                                                            Tractor/
                                  Coupling        Towed Pneumatic                              Pneumatic Tool Carrier/Grape
                                                                          Towed Grape
                                   Detail             Sprayer                                   Sprayers    Harvester Module
                                                                           Harvester
                                                                                                Module
                                                    Lamborghini/        Lamborghini/Pel-
                                     Make                                                Pellenc/Cima            Pellenc/Pellenc
                                                       KWH                   lenc
                                     Model           RF 90/B612           RF 90/8050      3300/Spider               3300/4560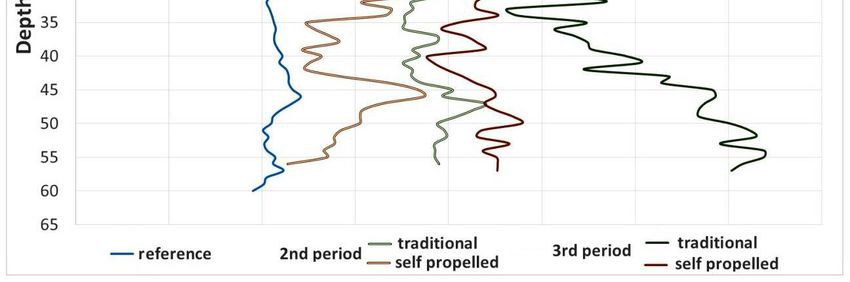
Sustainability 2021, 13, 2475                                                                                             5 of 11

                                                tr. front 300/70R20
                                                                    tr. front 300/70R20    front
                                                      @ 220 kPa
                                                                          @ 220 kPa     420/70R24   front 420/70R24
                                                 tr. rear 420/70R28
                                                                    tr. rear. 420/70R28 @ 240 kPa       @ 240 kPa
                                     Tyres            @ 160 kPa
                                                                          @ 160 kPa         rear   rear 600/55R26.5
                                                  sprayer 10.0/75–
                                                                     harv. 16.0/70–20 600/55R26.5       @ 160 kPa
                                                         15.3
                                                                          @ 320 kPa     @ 160 kPa
                                                      @ 280 kPa
                                                                                          empty
                                                  empty 3130/715 empty 3130/3040        5130/1550  empty 5130/2850
                                   Mass, kg
                                                full load 3130/1990 full load 3130/5400 full load full load 5130/5570
                                                                                        5130/3550

                                3. Results and Discussion
                                      The soil penetration resistance results are shown in Figures 3 and 4 and in Tables 4
                                and 5 (respectively for the “tilled” and “covered by grass” inter-rows).
                                      For a more effective comparison, according to [14], the penetration resistance data
                                were averaged for layers of 10 cm depth, thus allowing a better comparison for similar
                                layers in subsequent periods along the growing season.
                                      The “reference” data refer to the situation ascertained at the beginning of the growing
                                season, before any passage of the machinery into the vineyards for that season, obviously
                                common for both the traditional and self-propelled combinations.
                                      The quite high standard deviation values found for the penetrometer readings might
                                be ascribed to the high percentage of coarse fraction of the soil and its structure variability,
                                naturally wide [21]. In any case, values of standard deviation similar to those obtained are
                                reported, for example, in [5,21–24].
                                      In the tilled inter-rows and after the 1st period, the difference in compaction caused
                                by the traditional and the self-propelled machinery combinations is not so evident, being
                                significant only in 21–30 cm and 31–40 cm layers, because the sub-soiler is working to a
                                nominal depth of about 18–20 cm.
                                      The tests carried out after the 2nd period showed minimum differences in the first 2
                                layers (from 0 to 20 cm). At a higher depth (21–30 cm) the traditional machinery produce
                                a slightly higher compaction, while going deep (31–40 cm) the self-propelled combination
                                causes a slightly higher compaction. From 40 to 60 cm the trend is quite similar for the
                                two conditions.
                                      The results obtained at the end of the 3rd period (after the grape harvesting) in the
                                tilled inter-rows highlight a remarkably reduced compaction (with a difference sometime
                                exceeding 1.5 MPa) of the self-propelled combination, along almost the entire soil profile.
                                Although with small discrepancies, the data recorded in the inter-rows covered by grass
                                confirm the described trend.
                                      Unfortunately, for the inter-rows covered by grass the data to be recorded after the
                                1st period were missed, because the soil was compacted too much to be penetrated by
                                exerting the sole manual force of the operator. This was mainly due to a long previous
                                period with no rain (and no integration of irrigation), and consequently a very low soil
                                moisture content. By contrast, in the two following test campaigns (2nd and 3rd period)
                                the differences found were in almost all the cases statistically significant (apart the 21–30
                                cm layer in the 2nd period), always in favour of the self-propelled combination.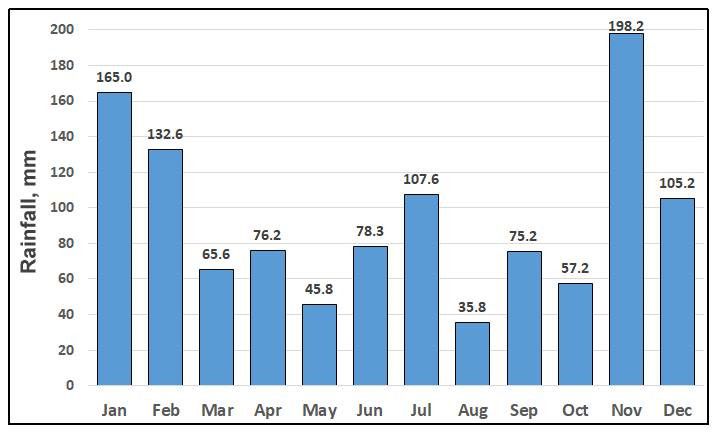
Sustainability 2021, 13, 2475 6 of 11
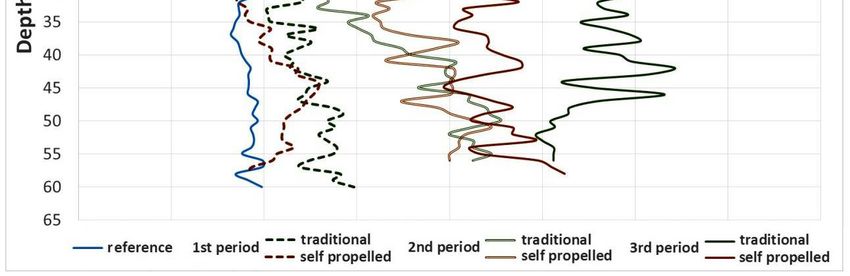
Figure 3. Soil penetration resistance values recorded along the different periods in the growing
season for the traditional and self-propelled machinery combinations, in the tilled inter-rows.
Figure 4. Soil penetration resistance values recorded along the different periods of the growing
season for the traditional and self-propelled machinery combinations, in the inter-rows covered by
grass (N.B. = 1st period data are missing).Sustainability 2021, 13, 2475 7 of 11
Table 4. Soil penetration resistance values recorded along the different periods in the growing
season for the traditional and self-propelled machinery combinations in the tilled inter-rows, aver-
aged for layers of 10 cm thickness each.
Reference After 1st Period After 2nd Period After 3rd period
Tradi- Tradi- Tradi-
Layer Self-prop. Self-prop. Self-prop.
tional tional tional
Depth,
pen. pen. pen. pen. pen. pen. pen.
cm
res., res., res., res., res., res., res.,
s.d. s.d. s.d. s.d. s.d. s.d. s.d.
MPa MPa MPa MPa MPa MPa MPa
1–10 1.68 0.70 2.86 1.68 2.63 1.40 1.96 1.48 1.72* 1.12 6.01 2.31 4.42* 2.25
11–20 1.92 0.60 3.77 1.32 3.57 1.27 3.86 1.67 3.55 1.85 5.66 2.56 4.70* 2.24
21–30 2.00 0.66 3.21 1.47 2.33* 1.31 3.66 1.93 3.05* 1.77 5.71 2.49 4.53* 2.14
31–40 1.73 0.63 2.29 1.26 1.91* 0.93 3.03 1.52 3.50* 2.06 5.75 2.53 4.33* 1.98
41–50 1.86 0.61 2.53 1.00 2.39 0.80 4.12 1.44 3.90 1.61 5.76 2.50 4.39* 2.02
51–60 1.87 0.54 2.68 0.71 2.16* 0.67 3.93 0.96 4.05 0.75 4.39 2.06 4.55 1.77
* = statistically significant difference per p < 0.05 (test T) between the traditional and self-propelled
combinations data. The relevant values are in bold.
Table 5. Soil penetration resistance values recorded along the different periods of the growing
season for the traditional and self-propelled machinery combinations in the inter-rows covered by
grass, averaged for layers of 10 cm thickness each.
Reference After 1st Period After 2nd Period After 3rd Period
Tradi- Tradi-
Layer Self-prop. Traditional Self-prop. Self-prop.
tional tional
Depth,
pen. pen. pen. pen. pen. pen. pen.
cm
res., s.d. res., s.d. res., s.d. res., s.d. res., s.d. res., s.d. res., s.d.
MPa MPa MPa MPa MPa MPa MPa
1–10 2.10 0.81 3.27 1.71 2.58* 1.53 6.45 2.24 4.48* 2.12
11–20 2.43 0.74 4.26 1.91 3.58* 1.93 5.89 2.27 4.66* 2.03
21–30 2.34 0.85 3.71 1.90 3.38 1.93 5.26 2.42 4.76* 2.32
n.d.
31–40 2.13 0.97 3.67 2.01 2.93* 1.90 5.33 2.79 4.22* 1.81
41–50 2.25 1.01 3.88 1.56 3.09* 1.50 6.40 2.49 4.33* 2.33
51–60 2.08 0.79 3.89 1.22 2.66* 1.05 7.02 1.74 4.32* 2.57
* = statistically significant difference per p < 0.05 (test T) between the traditional and self-propelled
combinations data. The relevant values are in bold; n.d. = not detected.
In general, the critical compaction value for the crops growing reported in [5] of 3.5
MPa was exceeded in several tests, as expected partly after the 2nd period, but above all
after the 3rd period.
In any case, the evolution of the soil compaction over time was quite interesting: in
the tilled inter-rows and between the 1st and 2nd periods a decrease was recorded in the
superficial layers, probably due to the rain that improved the regeneration capacity of the
top-soil. By contrast, in the sub-soil a progressive increasing compaction was clearly de-
tected along the entire growing season.
No comparisons were unfortunately carried out in the inter-rows covered by grass
after the 1st period, due to the impossibility of obtaining experimental data. In any case,
in the following two periods a similar increase of the soil compaction was detected.
Although this was not the main goal of this paper, in Tables 6 and 7 the data of tilled
and covered by grass inter-rows are compared, respectively for the self-propelled and tra-
ditional combinations.
The technical characteristics of the machines travelling in the vineyard notably affect
the structural characteristics between the soil tilled or covered by grass.Sustainability 2021, 13, 2475 8 of 11
Table 6. Soil penetration resistance values recorded along the different periods of the growing
season for the self-propelled machinery combination, averaged for a layer of 10 cm depth.
Reference After 1st Period After 2nd Period After 3rd Period
Grassed Tilled Grassed Tilled Grassed Tilled Grassed Tilled
Layer
pen. pen. pen. pen. pen. pen. pen. pen.
Depth,
res., res., res., s. res., res., res., res., res.,
cm s.d. s.d. s.d. s.d. s.d. s.d. s.d.
MPa MPa MPa d. MPa MPa MPa MPa MPa
1–10 2.10 0.81 1.68* 0.70 2.63 1.40 2.58 1.53 1.72* 1.12 4.48 2.12 4.42 2.25
11–20 2.43 0.74 1.92* 0.60 3.57 1.27 3.58 1.93 3.55 1.85 4.66 2.03 4.70 2.24
21–30 2.34 0.85 2.00 0.66 2.33 1.31 3.38 1.93 3.05 1.77 4.76 2.32 4.53 2.14
n.d.
31–40 2.13 0.97 1.73* 0.63 1.91 0.93 2.93 1.90 3.50* 2.06 4.22 1.81 4.33 1.98
41–50 2.25 1.01 1.86 0.61 2.39 0.80 3.09 1.50 3.90* 1.61 4.33 2.33 4.39 2.02
51–60 2.08 0.79 1.87 0.54 2.16 0.67 2.66 1.05 4.05* 0.75 4.32 2.57 4.55 1.77
* = statistically significant difference per p < 0.05 (test T) between the data relevant to the inter-
rows tilled and covered by grass. To highlight the relevant values these are in bold; n.d. = not de-
tected.
Table 7. Soil penetration resistance values recorded along the different periods of the growing
season for the traditional machinery combination, averaged for layer of 10 cm depth.
Reference After 1st Period After 2nd Period After 3rd Period
Grassed Tilled Grassed Tilled Grassed Tilled Grassed Tilled
Layer
pen. pen. pen. pen. pen. pen. pen. pen.
Depth,
res., s.d. res., s.d. res., s.d. res., s.d. res., s.d. res., s.d. res., s.d. res., s.d.
cm
MPa MPa MPa MPa MPa MPa MPa MPa
1–10 2.10 0.81 1.68* 0.70 2.86 1.68 3.27 1.71 1.96* 1.48 6.45 2.24 6.01* 2.31
11–20 2.43 0.74 1.92* 0.60 3.77 1.32 4.26 1.91 3.86* 1.67 5.89 2.27 5.66 2.56
21–30 2.34 0.85 2.00 0.66 3.21 1.47 3.71 1.90 3.66 1.93 5.26 2.42 5.71 2.49
n.d.
31–40 2.13 0.97 1.73* 0.63 2.29 1.26 3.67 2.01 3.03* 1.52 5.33 2.79 5.75 2.53
41–50 2.25 1.01 1.86 0.61 2.53 1.00 3.88 1.56 4.12 1.44 6.40 2.49 5.76* 2.50
51–60 2.08 0.79 1.87 0.54 2.68 0.71 3.89 1.22 3.93 0.96 7.02 1.74 4.39* 2.06
* = statistically significant difference per p < 0.05 (test T) between the data relevant to the inter-
rows tilled and covered by grass. To highlight the relevant values these are in bold; n.d. = not de-
tected.
As expected, in the ”reference” period the penetration resistance is quite low in the
very superficial layer if compared with that of the deeper layers; these low values were
also confirmed after the other periods, although they are generally higher. With the self-
propelled combination, the trend is in line with what is reported in the literature [5,25] for
tilled inter-rows.
The test carried out after the 3rd period showed no statistically significant differences
for the self-propelled combination in the tilled and grassed inter-rows.
4. Conclusions
Both the data recorded in the tilled and grass-covered inter-rows confirm statistically
that the traditional machinery combination causes a higher soil compaction in respect to
the self-propelled combination, above all when many passages into the vineyard are car-
ried out.
In fact, notwithstanding their higher mass, the use of self-propelled machinery in-
stead of the traditional combination of tractors coupled to towed implements is able to
reduce the compaction due to the machinery traffic in the vineyard, at least in the soil and
climatic conditions surveyed in the tests campaign described.Sustainability 2021, 13, 2475 9 of 11
In fact, the total mass values, both of the spraying (8680 kg vs. 5120 kg, + 69%) and
the harvesting set-ups (10,750 kg vs. 8530 kg, + 26%) were higher, but the larger tyre con-
tact area of the self-propelled machine lead to a lower mean pressure on the soil.
For the grape harvesting in particular, the mass of the towed grape harvester is
charged only over two wheels, and not over 4 wheels as happens for the self-propelled
machine.
The towed grape harvester has a mass of 5400 kg at full load, charging for approxi-
mately 85% (about 4600 kg) on two tyres 16.0/70–20, having a section width of approxi-
mately 400 mm. As a consequence, to support adequately the resultant load per wheel of
2300 kg (at a max speed of 40 km/h), each tyre is characterized by a strong carcass stiffness
(equivalent to 10 ply rating) and, therefore, must be inflated at a high pressure (320 kPa).
By contrast, the self-propelled grape harvester is equipped with wide section tyres,
suitable for working at low inflation pressure, thus creating a large contact area.
In accordance with some dedicated models available on literature (e.g., [26]), it
should be possible to ascertain the contact area value in each operating condition, in order
to calculate the mean pressure on the soil, to be then compared to the real soil compaction.
Other question is the repeated passes of the machinery on the soil, and how they
affect the compaction, taking also into account the sensitivity of the terrain regarding the
structural conditions (texture, moisture content, skeleton amount, etc.).
Apart from the pesticide treatments and the grape harvesting, in the surveyed vine-
yard 12 more tasks (such as topping, tying, leaf-stripping, etc.) were carried out during
the growing season, using traditional combinations of tractor-implement. When studying
the compaction produced by the self-propelled machinery, the contribution to the soil
compaction of the passes for these further operations was not directly taken into account,
because the tests were generally conducted only inside the ruts created by the tyres. In
fact, the self-propelled machinery produces typically just one rut located in the centre of
each inter-row, by contrast with the couple of ruts created by the pass of the tractor and
the towed implement, that are situated towards the borders of the inter-row. This could
have made worsen the results obtained with the traditional combination, as already high-
lighted in [13].
In any case, a balanced use of self-propelled machinery and of the traditional tractor-
implement combination allows a better distribution of the soil compaction (in particular
in the top-soil), so improving the root growing efficiency [27]. Nevertheless, it should be
necessary to ascertain the possible qualitative and quantitative differences of yield in the
two working conditions.
Climate plays a vital role in the terroir of a given wine region, as it strongly controls
canopy microclimate, vine growth, vine physiology, yield, and berry composition, which
together determine wine attributes and typicity. New challenges are, however, predicted
to arise from climate change, as grapevine cultivation is deeply dependent on weather
and climate conditions [28].
The ongoing climate change will not favour also the best physical status of the soil
structure in vineyards, due to the foreseeable long drought periods, as well as the heavy
rains that increasingly affect the current climate. This will worsen the natural compaction,
to which is added the compaction caused by human labour, first and foremost that of
machinery.
However, many parameters can affect crop productivity, but undoubtedly the com-
paction is one of the most important. Its limitation can be pursued primarily with a de-
crease in the passage number of the machinery. Apart from extreme cases, where animal
(horse) draught instead of tractor is used, this can be achieved with combinations of trac-
tor and multiple implements (to be fitted in the front and at the rear of the tractor), to be
carried out possibly in periods of the growing season when the soil is less sensitive to
compaction.
Even the use of wide section and low-pressure tyres can help the compaction reduc-
tion, especially that of the top-soil. Finally, restoring a suitable content of organic matterSustainability 2021, 13, 2475 10 of 11
in the soil (ideally 4%) can certainly help improve its physical structure, making it less
sensitive to compaction. The organic matter distribution can be carried out both thanks to
the use of organic matrices (manure, compost, solid digestate), and with agricultural prac-
tices specifically intended for this purpose, such as green manure.
Author Contributions: Conceptualization and methodology, D.P. and D.F.; testing, validation and
formal analysis, L.E.G and S.S.; writing and editing, D.P. All authors have read and agreed to the
published version of the manuscript.
Funding: This research received no external funding.
Institutional Review Board Statement: Not applicable.
Informed Consent Statement: Not applicable.
Data Availability Statement: Not applicable.
Conflicts of Interest: The authors declare no conflict of interest.
References
1. Hamza, M.A.; Anderson, W.K. Soil compaction in cropping systems—A review of the nature, causes and possible solutions.
Soil Tillage Res. 2005, 82, 121–145, doi:10.1016/j.still.2004.08.009.
2. Defossez P.; Richard, G. Models of soil compaction due to traffic and their evaluation. Soil Tillage Res. 2002, 67, 41–64,
doi:10.1016/S0167-1987(02)00030-2.
3. Burg, P.; Zemànek, P.; Turan, J.; Findura, P. The penetration resistance as a soil degradation indicator in the viticulture. Acta
Univ. Agric. Silvi. Medel. Brun. 2012, 8, 29–36, doi:10.11118/actaun201260080029.
4. Spinelli, R.; Magagnotti, N.; Cavallo, E.; Capello, G.; Biddoccu, M. Reducing soil compaction after thinning work in agroforestry
plantations. Agrofor. Syst. 2019, 93, 1765–1779, doi:10.1007/s10457-018-0279-6.
5. Pierret, A.; Moran, C.J. Plant Roots and Soil Structure. In Encyclopedia of Agrophysics. Encyclopedia of Earth Sciences Series;
Gliński, J., Horabik, J., Lipiec, J., Eds.; Springer: Dordrecht, The Netherlands, 2011; doi:10.1007/978-90-481-3585-1_121.
6. Finch, H.J.S.; Samuel, A.M.; Lane, G.P.F. Soils and soil management. In Woodhead Publishing Series in Food Science, Technology and
Nutrition, Lockhart & Wiseman’s Crop Husbandry Including Grassland, 9th ed.; Woodhead Publishing, Cambridge, England: 2014;
pp. 37–62, doi:10.1533/9781782423928.1.37.
7. Lisa, L.; Parena, S.; Lisa, L. Working times and production cost of grapes in grass covered or tilled vineyards of Piedmont. In
Proceedings of the VIII GESCO Meeting, Vairão, Portugal, 3-5 July 1995; pp. 325–330.
8. Capello, G.; Biddoccu, M.; Ferraris, S.; Cavallo, E. Effects of Tractor Passes on Hydrological and Soil Erosion Processes in Tilled
and Grassed Vineyards. Water 2019, 11, 2118, doi:10.3390/w11102118.
9. Van Dijck, S.J.E.; Van Asch, T.W.J. Compaction of loamy soils due to tractor traffic in vineyards and orchards and its effect on
infiltration in southern France. Soil Tillage Res. 2002, 63, 141–153, doi:10.1016/S0167-1987(01)00237-9.
10. Håkansson, I.; Medvedev, V.M. Protection of soils form mechanical overloading by establishing limits for stress cause by heavy
vehicles. Soil Tillage Res. 1995, 35, 85–97.
11. Dawidowski, J.B.; Morrison, J.E.; Snieg, M. Measurement of soil layer strength with plate sinkage and uniaxial confined meth-
ods. Trans. ASAE 2001, 44, 1059–1064, doi:10.13031/2013.6427.
12. Canillas, E.C.; Salokhe, V.M. Modeling compaction in agricultural soils. J. Terramech. 2002, 39, 71–84, doi:10.1016/S0022-
4898(02)00007-1.
13. Buliński, J.; Sergiel, L. Effect of wheel passage number and tyre inflation pressure on soil compaction in the wheel track. Ann.
Warsaw Univ. Life Sci.-SGGW Agric. 2013, 5, 15–62. Available online: https://www.cabdirect.org/cabdirect/abstract/20143130163
(accessed on 8 Feb 2021).
14. Arvidsson, J.; Keller, T. Soil stress as affected by wheel load and tyre inflation pressure. Soil Tillage Res. 2007, 96, 284–291,
doi:10.1016/j.still.2007.06.012.
15. Carman, K. Compaction characteristics of towed wheels on clay loam in soil bin. Soil Tillage Res. 2002, 65, 37–43,
doi:10.1016/S0167-1987(01)00281-1.
16. Carman, K. Prediction of soil compaction under pneumatic tires using a fuzzy logic approach. J. Terramech. 2008, 45, 103–108,
doi:10.1016/j.jterra.2008.10.001.
17. Bagagiolo, G.; Biddoccu, M.; Rabino, D.; Cavallo, E. Effects of rows arrangement, soil management, and rainfall characteristics
on water and soil losses in Italian sloping vineyards. Environ. Res. 2018, 166, 690–704, doi:10.1016/j.envres.2018.06.048.
18. Soil Survey Staff, Natural Resources Conservation Service, USDA. Soil Series Classification Database; 2019. Available online:
https://www.nrcs.usda.gov/wps/portal/nrcs/detail/soils/survey/class/data/?cid=nrcs142p2_053583 (accessed on 8 Feb 2021).
19. ASAE. ASAE Standards 4E. S313.2: Soil Cone Penetrometer; ASAE, St.Joseph, MI, USA, 1999.
20. ASAE. ASAE Standards 4E. EP542: Procedures for Obtaining and Reporting Data with the Soil Cone Penetrometer; ASAE, St. Joseph,
MI, USA, 1999.Sustainability 2021, 13, 2475 11 of 11
21. Van Huyssteen, L. Interpretation and use of penetrometer data to describe soil compaction in vineyards. South Afr. J. Enol. Vitic.
1983, 2, 59–65, doi:10.21548/4-2-2371.
22. Alesso, C.A.; Masola, M.J.; Carrizo, M.E.; Cipriotti, P.A.; del Imhoff, S. Spatial variability of short-term effect of tillage on soil
penetration resistance. Arch. Agron. Soil Sci. 2019, 65, 822–832, doi:10.1080/03650340.2018.1532076.
23. Carrara, M.; Castrignanò, A.; Comparetti, A.; Febo, P.; Orlando, S. Mapping of penetrometer resistance in relation to tractor
traffic using multivariate geostatistics. Geoderma 2007, 142, 294–307, doi:10.1016/j.geoderma.2007.08.020.
24. Utset, A.; Cid, G. Soil penetrometer resistance spatial variability in a Ferralsol at several soil moisture conditions. Soil Tillage
Res. 2001, 61, 193–202, doi:10.1016/S0167-1987(01)00204-5.
25. Peacock, B. Managing compacted soils in vineyards. Symposium on University of California Cooperative Extension; Tulare County,
CA, USA, pub. GV8-97, 1999. Available online: http://cetulare.ucanr.edu/files/82002.pdf (accessed on 8 Feb 2021)
26. Febo, P.; Lucarelli, F.; Pessina, D. Soil-tyre interaction parameters influencing soil compaction—A study of contact area predic-
tion models. In Advanced in Geoecology 32; Horn, R., van den Akker, J.J.H., Arvidsson, J., Eds.; Subsoil compaction; IUSS, Vienna,
Austria: 2000; ISBN 3-923381-44-1. Available online: https://d-nb.info/958575282/04 (accessed on 8 Feb 2021).
27. Buliński, J.; Sergiel, L. Soil consideration in cultivation of plants. Ann. Warsaw Univ. Life Sci.-SGGW Agric. 2013, 5, 15–61.
28. Santos, J.A.; Fraga, H.; Malheiro, A.C.; Moutinho-Pereira, J.; Dinis, L.-T.; Correia, C.; Moriondo, M.; Leolini, L.; Dibari, C.; Cos-
tafreda-Aumedes, S.; et al. A Review of the Potential Climate Change Impacts and Adaptation Options for European Viticulture.
Appl. Sci. 2020, 10, 3092, doi:10.3390/app10093092.You can also read