The serve clock reduced rule violations, but did not speed up the game: A closer look at the interpoint time at the 2018 US Open
←
→
Page content transcription
If your browser does not render page correctly, please read the page content below
Original Article

The serve clock reduced rule violations, but did
not speed up the game: A closer look at the inter-
point time at the 2018 US Open
ALEXANDER MÜHLBERGER, OTTO KOLBINGER 1
Technical University of Munich, Germany

 ABSTRACT

After treating time rule violations as a trivial offense over the past, tennis associations in 2018 permanently
introduced an on-court serve clock to make sure that players do not exceed the time limit between points. In
this study, we investigated the influence of this technological officiating aid at its first use in Grand Slam
tennis at the 2018 US Open. By investigating time intervals between 2135 points at the Men’s single
tournament we found that the share of rule violations decreased (26.3%), but the average time did not (21.6
s) compared to previous studies. We could further confirm that the players still use this time interval for tactical
reasons and to recover after longer rallies. In addition, the umpires, which do not show any reputation bias,
have a significant influence on the inter-point time as well. Based on these findings we suggest introducing
a serve clock that is started automatically. Further, we argue that a dynamic time limit, which takes the
intensity of the previous rally into account, would be more appropriate. Players could be granted more time
for recovery after longer rallies, but less time after shorter ones in order to reach the intended goals regarding
pace of play.
Keywords: Time rule; Umpiring; Serve clock; Technological officiating aids; Tennis.

 Cite this article as:
 Mühlberger, A., & Kolbinger, O. (2020). The serve clock reduced rule violations, but did not speed up the
 game: A closer look at the inter-point time at the 2018 US Open. Journal of Human Sport and Exercise,
 in press. doi:https://doi.org/10.14198/jhse.2021.163.05

1
 Corresponding author. Chair of Performance Analysis and Sports Informatics, Technical University of Munich, Georg-Brauchle-
Ring 60/62, D-80992 München. Germany. https://orcid.org/0000-0002-8062-3923
 E-mail: otto.kolbinger@tum.de
 Submitted for publication February 04, 2020
 Accepted for publication April 03, 2020
 Published in press April 24, 2020
 JOURNAL OF HUMAN SPORT & EXERCISE ISSN 1988-5202
 © Faculty of Education. University of Alicante
 doi:10.14198/jhse.2021.163.05
 VOLUME -- | ISSUE - | 2020 | 1
Mühlberger et al. / The impact of the serve clock in tennis JOURNAL OF HUMAN SPORT & EXERCISE

INTRODUCTION

To ensure entertainment and attractiveness of tennis to a broad spectrum of fans as well as to fulfil the
expectations of TV broadcasts, several rule changes were performed in the last years. In 1970 the tie-break
was introduced to adjust the length of matches. Newer rule adaptions are “no-ad” scoring, the match tie-
break in doubles and short sets at some special events (combined with a match tie-break). Using
mathematical simulations, Pollard and Noble (2002) could show that best-of-five short sets until 4 games
compared to traditional best-of-three tie-break sets lead even to an increase in the expected number of points
played, whereas “no-ad” scoring and replacing the final set with a match tie-break until 10 points both reduced
the expected number of points. Therefore, the length of tennis matches is shortened by using the latter
formats. The most recent approach to make tennis even more attractive was tested at the ATP Next Gen
Finals including changes like linesmen being replaced by the instant use of the Hawk-Eye technology and
applying Fast4 as match format. Using Fast4 (best-of-five sets) scoring means that already at 3 games all a
short set tie-break (deciding point at 4 points all) is applied and reduces the match time compared to three
traditional tie-break sets (Simmonds and O’Donoghue, 2018).

In addition, a shot clock to count down the time between points was used (hereinafter referred to as serve
clock). Before that, violations of the respective rule could be assumed as so-called trivial offenses. Kolbinger
and Stöckl (2019) introduced this term for minor rule violations that are almost never penalized by officials.
The treatment of time violations in tennis fulfilled the criteria described by them, as it was shown in the study
of (Kolbinger, Großmann, & Lames, 2019). The time rule was violated for 58.5% of the serves, with only 0.1%
of the violations being penalized. The introduction of the serve clock can be seen as a reaction to the
inappropriate handling of the rule.

After its test at the ATP Next Gen Finals, the serve clock was introduced during the US summer swing 2018
on the ATP/WTA tour with its Grand Slam debut at the US Open. Further, the serve clock was implemented
in the 2019 rule books of the WTA and ATP and is stepwise going to be mandatory at all WTA and ATP Tour
events from 2020 on, starting with the Premier and Master events already in 2019. At least two serve clock
panels must be visible on the courts for players and the chair umpire (ATP, 2019; WTA, 2019). At the moment,
the usage is as followed: the chair umpire enters the point, announces the score and afterwards starts the
serve clock. The players need to start their serving motion within 25 seconds, otherwise a time violation is
given by the chair umpire. Still, the chair umpire can pause and resume or reset the serve clock if appropriate
(ATP, 2018). This procedure is in contrast of the continuous play rule (Rule 29) in tennis of the ITF, where
only maximum of 20 seconds is conceded towards the players from the moment the ball is out of play until
the next serve is hit (ITF, 2019). However, in the Grand Slam, ATP and WTA rulebooks 25 seconds are
allowed between points (ATP, 2019; Grand Slam Board, 2019; WTA, 2019).

The intention of the serve clock, according to Gayle Bradshaw (ATP’s executive vice president of rules and
competition), is on the one hand to speed up the pace of play (USA Today Sports, 2018). This is in
accordance with the main goals of rule modifications identified by Arias et al. (2011), which are to attract
spectators and to fulfil commercial pressure and interests. However, rule modifications in sports should
already be investigated before their final introduction, but there are only few studies analysing the effects of
rule modifications and their results are often conflicting each other (Arias et al., 2011). The effect and intention
of the serve clock was for example questioned by Kovalchik (2018) even before its introduction, as the time
between the points was raised from 20 to 25 seconds and the average time between points was found to be
below the new limit.

 2 | 2020 | ISSUE - | VOLUME -- © 2020 University of Alicante
Mühlberger et al. / The impact of the serve clock in tennis JOURNAL OF HUMAN SPORT & EXERCISE

As the second intention of the introduction, Bradshaw pointed out that the serve clock should help the chair
umpires to enforce the rules regarding the time between points (USA Today Sports, 2018). Up to now, the
chair umpire was the only one to see the time running between points and it was upon his decision to penalize
a player for being too slow. The serve clock as a visible tool for everyone makes these penalizations
transparent to players and spectators. Therefore, the serve clock can be considered as a technological
officiating aid (hereinafter: TOA) that should help the referee to enforce a rule according to the introduced
taxonomy of TOA by Kolbinger and Lames (2017).

Adding the responsibility to start and pause the shot clock to the chair umpire’s duties does not eliminate the
potential for decisions affected by biases. Whereas there are no studies about bias in tennis umpiring, there
is a huge body of literature about bias in sports. In baseball, Parsons et al. (2011) could show an effect of
ethnicity on the decisions of the referee and behaviour changes of the player when knowing who is umpiring
their game. Mills (2014), in addition, reported umpires to be more favourable with players who are more
experienced and have a higher reputation. Another type of reputation-based bias was found by Kim and King
(2014), who showed how the umpires adapted their judgements based on specific player’s characteristics.
Those kinds of bias can be transferred to tennis and the decision of the chair umpire to be more lenient with
higher ranked players and allowing them more time, especially if those top players have a reputation of having
extensive service routines. Another cause of referee bias is the size and composition of the supporting crowd
as well as the distance between the crowd and the referee (Dohmen and Sauermann, 2016). In tennis,
however, supporting crowd as such is only found in Davis and Fed Cup matches. Therefore, this effect may
only play a minor role in affecting the chair umpire’s decision. Nevertheless, the crowd size varies a lot from
the big stadiums towards the small side match courts.

In this recent study the aim was to take a closer look at the time between the points at the US Open 2018
and investigate a possible influence of the serve clock. Kolbinger et al. (2019) already investigated the time
between points at the Australian Open 2016 and the effect of several factors influencing this time interval.
They reported an impact for the serving player, the previous rally length, service game, scoring streak, and
importance of points. They further criticized the enforcement of the time rule as they found a high percentage
of violations not being penalized. Therefore, they suggested a TOA, like the serve clock, to improve the
enforcement of the rule. In general, the existing observational system of their study is used, but the analysed
parameters are going to be extended by putting an additional focus on the chair umpire. An impact on the
average time between points due to the serve clock is expected. It is assumed that more time violations
against the players are awarded as each time the serve clock runs down to zero should be penalized and
this fact is transparent by having the serve clock on the court. In addition, the chair umpire’s behaviour and
his contribution are observed.

METHODS

Sample
Data of 18 matches of the 2018 US Open Men’s single tournament was collected by two experts, using the
ordinary broadcasting signal of Eurosport (expert 1: 7 years’ professional experience as chair umpire; expert
2: ten years’ experience as sports analyst). 25 different players with an average ATP ranking of 48.8 (SD:
40.6) appeared in those matches, including four of the five top ranked players and five former Grand Slam
champions. The well-proven observational system of Kolbinger et al. (2019) was applied to extract the serving
player, the receiving player, the current score, whether it was a first or second serve, the number of strokes
in each rally, the winner of the respective rally and the inter-point time. For all but two matches, we did not
just record this total time between the points according to the official rules, which is starting with the moment

 VOLUME -- | ISSUE - | 2020 | 3
Mühlberger et al. / The impact of the serve clock in tennis JOURNAL OF HUMAN SPORT & EXERCISE

the ball was out of play, meaning that either the ball bounced twice or the trajectory of the ball ended in the
net or out of bounce, and stopping with the moment the player actually struck the ball in order to conduct a
serve (Time). In addition, we adapted our system to the implementation procedures for the serve clock. In
detail, we collected two interval times, split by the moment the umpire announces the score, which represents
the start of the serve clock, according to those procedures. This should enable us to measure the elapsed
time after the start of the serve clock and therefore identify actual rule violations (SplitTime2), but also to
explore patterns affecting the time it takes until the umpire starts the serve clock (SplitTime1).

Only inter-point times for which the time rule applies were observed, which excludes the first serve of each
service game, second serves and serves in a tie break at odd scores or if the players changed sides. Further,
we excluded serves that were preceded by one of the following events: Overruled decision by the umpire,
Hawk-Eye challenge, change of any sort of equipment by one player, umpire demands the audience to be
quiet, discussion between the umpire and one player and warnings. Thus, the observed 2834 rallies led to
2135 inter-point times that were eligible for this study and were used for the analysis in two different sets of
data. Sample ONE included all inter-point times, sample TWO consisted of all matches, for which we were
able to collect the two different split times (1692 inter-point times).

Reliability
To obtain the inter-rater agreement, both experts collected data of the same one hundred serves. Cohen’s
Kappa was calculated for nominal data, whereas correlation coefficients and further descriptive statistics
were used to rate the agreement for the metric variables (the different split times for the inter-point time and
the number of strokes per rally). All nominal variables showed a perfect inter-rater agreement (Cohen’s Kappa
equals one for each). Regarding the number of strokes, the correlation coefficient was 1.00, with a
classification rate of 99.0%. For the overall inter-point time, as well as for the splits, the correlation coefficients
also reached 1.00. The mean absolute difference was 0.14 seconds for the total time, 0.07 seconds for the
first split time and 0.11 for the second split time. The biggest difference between the two observers was 0.8
seconds.

Data processing
The data collected by the self-designed observational system was processed to provide additional
information and fit the data for statistical analysis. The variables PrevRL (number of strokes in the previous
rally), as well as the dependent variables SplitTime1 (time elapsed until the umpire announces the score),
SplitTime2 (time between score announcement and serve hit) and Time (total inter-point time) could be used
without further preparation.

The current score was used to extract the variables Set (current set), Game (current service game), the
dummy variable Tiebreak (equals 1 if true, and 0 otherwise) and the current scoring Streak. The variable
Streak equals the number of points won or lost in a row by the serving player in a service game, prior to the
start of the respective inter-point time. Due to the scoring system in tennis, the variable ranges from -4 to +4,
as there is no scenario possible in which there is another serve if one player wins five points in a row in a
service game. Further, similar to the study of Kolbinger et al. (2019), we labelled all scores as Important
Points in which the receiving player was less than one point away of gaining a break ball (which includes
actual break points) or the serving player had exactly one game point.

The player variables were transformed into n-1 dummy variables, equalling one if the respective player
performed the serve and zero if not. The same scenario was applied for umpires and courts. We expect inter-
individual differences for umpires, courts and players, but are not interested in generating knowledge about

 4 | 2020 | ISSUE - | VOLUME -- © 2020 University of Alicante
Mühlberger et al. / The impact of the serve clock in tennis JOURNAL OF HUMAN SPORT & EXERCISE

an increase or decrease of the inter-point time that is affected by player x or umpire y. Thus, we created
variables that equal the respective average (split) times per player, umpire and court: PlayerMean1 (time
until the umpire announces the score), PlayerMean2 and PlayerMean (total inter-point time), as well as
UmpireMean1, UmpireMean2, UmpireMean, CourtMean1, CourtMean2 and CourtMean. This transformation
was performed for players in Kolbinger et al. (2019) and led to no significant changes in the goodness of fit
and the partial derivatives. However, we repeated those checks for the models used in this study.

All the dependent variables were z-transformed before they were included in the regression models, as were
the predictor variables PrevRL, Streak, PlayerMean1, PlayerMean2, PlayerMean, UmpireMean1,
UmpireMean2, UmpireMean, CourtMean1, CourtMean2 and CourtMean. For Game and Set we decided that
it is more appropriate to include the variables in the original form, as this allows to interpret the coefficients
of those predictors as decrease or increase of the dependent variables per service game or set respectively.
The dummy variables were not standardized as well.

Statistical analysis
In addition to descriptive statistics to investigate the patterns of inter-point times and the prevalence of rule
violations, we ran regression models based on our two sets of data. For sample ONE we conducted one
model with seven predictor variables: Game, Set, Streak, PrevRL, Important Point, Tiebreak and
PlayerMean, which substitutes the dummy variables for the different players. The dependent variable is the
total inter-point time (Time), which allows direct comparisons with the study of Kolbinger et al. (2019).

 = 0 + 1 + 2 + 3 + 4 + 5
 + 6 + 7 +

Based on sample TWO, we ran three models, one for each of the three dependent variables (Time,
SplitTime1, SplitTime2), for which we add the respective variables for umpires and courts. Modell II adds the
variables UmpireMean and CourtMean to Model I.

 = 0 + 1 + 2 + 3 + 4 + 5
 + 6 + 7 + 8 + 9
 +

In addition, we computed the same model for both split times. Thus, SplitTime1 serves as dependent variable
for Modell III and SplitTime2 as dependent variable for Modell IV. Consequently, we substitute the variables
PlayerMean, UmpireMean and CourtMean by Player/Umpire/Court*MeanSplit1 and
Player/Umpire/Court*MeanSplit2 respectively.

 1 = 0 + 1 1 + 2 + 3 + 4 + 5
 + 6 + 7 + 8 1
 + 9 1 +
 2 = 0 + 1 2 + 2 + 3 + 4 + 5
 + 6 + 7 + 8 2
 + 9 2 +

All models were compared to models in which we substituted the variables showing the average times for
players, umpires and courts with the respective dummy variables. The severity of multicollinearity was
measured using the variance inflation factor (VIF). Data collection and processing was performed with
 VOLUME -- | ISSUE - | 2020 | 5
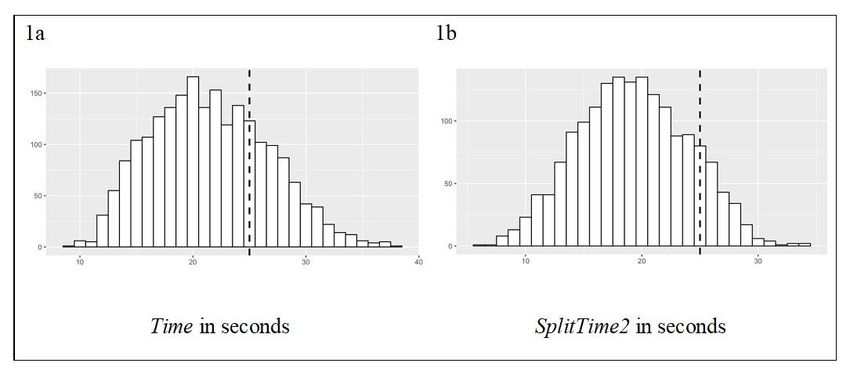
Mühlberger et al. / The impact of the serve clock in tennis JOURNAL OF HUMAN SPORT & EXERCISE

Microsoft Excel 2016 (Microsoft, Redmond, USA). Data transformation and all the statistical analysis were
conducted in R (R Development Core Team, 2015).

RESULTS

Prevalence of rule violations
The average inter-point time at the 2018 US Open was 21.6 seconds (SD: 5.2), with 26.3% of those intervals
exceeding 25 seconds (see Figure 1a). As the implementation procedures of the serve clock states that the
25 seconds interval of matter for the time rule starts with the announcement of the score, a special interest
was on this split time. The mean duration of SplitTime2 was 19.3 seconds (SD: 4.7) and the number of actual
rule violations was 213 (12.6%) (see Figure 1b). Only two (0.9%) of those violations were penalized.

Figure 1. Histograms for the total inter-point time (Time) and the time elapsed after the umpire announced
the score (SplitTime2). The dashed line marks the permitted 25 seconds interval.

Influence of the predictor variables on SplitTime1, SplitTime2 and Time
We structured the reporting of our models based on the variables, as we wanted to look for specific patterns
for the different time intervals. The respective models are listed in Table 1 and Table 2.

Concerning predictors that describe the chronological point of time in a match, Game and Set show significant
correlations with Time and SplitTime2, but all coefficients are below the 0.1 threshold for weak correlations.
Game further serves as a significant predictor in all of our models, whereas Set does not show any individual
influence on SplitTime1. Whether a point is played in a Tiebreak or not shows an individual influence on the
dependent variable in all models. The total-inter point time in Tiebreaks is 0.73 standard deviations higher
than in regular service games, the split time until the umpire announces the score increases by 0.40 standard
deviations, and those after the announcement by 0.59. Important Points show the same pattern, serving as
significant predictors for Time (coefficient of 0.55), SplitTime1 (0.31) and SplitTime2 (0.47).

Streak is the only predictor that shows a substantial negative correlation for Time and SplitTime2. Thus, the
respective time intervals increase with decreasing values of Streak. We illustrated this pattern in Figure 2.
For all cases in which the server has a positive streak the inter-point time is lower than for those cases in

 6 | 2020 | ISSUE - | VOLUME -- © 2020 University of Alicante
Mühlberger et al. / The impact of the serve clock in tennis JOURNAL OF HUMAN SPORT & EXERCISE

which the receiving player won the last point or couple of points respectively. This effect is smallest for
SplitTime1. Streak serves as a significant predictor in all models.

Table 1. Correlation coefficient with the inter-point time for all variables included in the summarized models
Time I and Time II.
 Correlation with Time Model Time I Model Time II
 R² (t-value) Coefficients (t-value)
 PrevRL .459*** (23.9) 0.363*** (25.5) 0.388*** (24.9)
 Game .081*** (3.74) 0.032*** (6.69) 0.035*** (6.81)
 Set -.059** (-2.73) -0.048*** (-3.53) -0.049** (-3.26)
 Important Point .301* (14.6) 0.530*** (17.6) 0.554*** (16.6)
 Tiebreak .106*** (4.94) 0.710*** (5.55) 0.728*** (5.49)
 Streak -.241*** (-11.5) -0.120*** (-8.08) -0.114*** (-6.96)
 PlayerMean .557*** (30.9) 0.530*** (37.7) 0.478*** (24.2)
 UmpireMean .414*** (18.7) 0.105*** (5.27)
 CourtMean .194*** (8.12) -0.049** (-2.88)
 Intercept -0.304*** (-6.71) -0.326*** (-6.66)
 Goodness of fit
 F (df, n) 434.6*** (7,2127) 292.4*** (9,1682)
 R² .589 .610
 Adjusted R² .587 .608
 Note: * = p < .05; ** = p < .01; *** = p < .001.

Table 2. Correlation coefficient with the respective time intervals for all variables included in the summarized
models SplitTime1 and SplitTime2.
 Model SplitTime1 Model SplitTime2
 Correlation R² Coefficients Correlation R² Coefficients
 (t-value) (t-value) (t-value) (t-value)
 PrevRL .419*** (19.0) 0.385*** (19.0) .316*** (13.7) 0.242*** (14.4)
 Game .019 (.79) 0.020** (2.98) .069** (2.85) 0.028*** (5.18)
 Set .006 (.27) 0.019 (1.00) -.086*** (-3.55) -0.057*** (-3.48)
 Important Point .202*** (8.50) 0.309*** (7.10) .246*** (10.4) 0.466*** (13.0)
 Tiebreak .046 (1.91) 0.398* (2.30) .099*** (4.08) 0.588*** (4.12)
 Streak -.081*** (-3.33) 0.050* (2.33) -.226*** (-9.52) -0.150*** (-8.48)
 PlayerMean .059* (2.41) 0.053 (1.38) .564*** (28.1) 0.520*** (24.2)
 UmpireMean .091*** (3.76) 0.312*** (9.47) .410*** (18.4) 0.143*** (5.71)
 CourtMean .075** (3.07) 0.013 (.48) .177*** (7.37) -0.040 (-1.94)
 Intercept -0.283*** (-4.47) -0.237*** (-4.49)
 Goodness of fit Goodness of fit
 F (df, n) 96.4 (9,1682) 225.6 (9,1682)
 R² .340 .547
 Adjusted R² .337 .545
 Note: * = p < .05; ** = p < .01; *** = p < .001.

 VOLUME -- | ISSUE - | 2020 | 7
Mühlberger et al. / The impact of the serve clock in tennis JOURNAL OF HUMAN SPORT & EXERCISE

 Figure 2. Boxplot for the total inter-point time (Time) in relation to the scoring streak.

The variable that shows the highest correlation with SplitTime1 is PrevRL (r = 0.42, t = 19.0, p < .001), which
is also one of the two variables that has a higher influence on this first split time, from the moment the ball is
out of play until the announcement of the score, compared to the second split time. However, it serves as a
highly significant predictor for all models, with each increase of the number of strokes by one standard
deviation (3.8 strokes) leading to an increase of the duration by 0.39 (SplitTime1), 0.24 (SplitTime2) and 0.39
(Time) standard deviations respectively.

 Figure 3. Coefficients for PlayerMean and UmpireMean for the models for SplitTime1 and SplitTime2.
 8 | 2020 | ISSUE - | VOLUME -- © 2020 University of Alicante
Mühlberger et al. / The impact of the serve clock in tennis JOURNAL OF HUMAN SPORT & EXERCISE

PlayerMean is the most important predictor for SplitTime2 and Time, and also shows the highest correlations
with those dependent variables (SplitTime2: r = 0.56, t = 28.1, p < .001; Time: r = 0.56, t = 30.9, p < .001).
For SplitTime1 this variable not even has a weak correlation and does not serve as a significant predictor
after we control for other variables (Figure 3).

UmpireMean, as does PrevRL (see above), has a greater influence of on the first split time than on the second
split time (Figure 3). However, it serves as a significant predictor in all models, in which this variable was
included. CourtMean has a weak to medium correlation with SplitTime2 as well as Time and is a significant
predictor in the model for the latter.

DISCUSSION

Prevalence of rule violations
The average inter-point time of 21.6s found at the 2018 US Open was slightly higher compared to other
studies. Kolbinger et al. (2019) measured an average time between points of 21.5s at the Australian Open
2016. Kovalchik and Albert (2017) in contrast found the time-to-serve at 19s for male players at the same
tournament. A possible explanation may be the fact that they excluded all time segments above 34s whereas
Kolbinger et al. (2019) only excluded inter-point-times with special events occurring. O’Donoghue and Liddle
(1998) reported 19.2s at the French Open and 18.4s at Wimbledon in 1996. The US Open 2018 differed from
the others as the players were allowed to take 25s between points instead of 20s. On the one hand, the serve
clock, used for the first time at Grand Slam tennis at the 2018 US Open, still did not speed up the play as the
inter-point time did not decrease. On the other hand, the five seconds raise in time allowed between points
did not lead to an increase in the time between points at Grand Slam Tournaments.

Time rule violations (inter-point time above 20s) occurred for 58.5% of all inter-point times observed at the
Australian Open 2016, with only 0.1% of those being penalized as time violations (Kolbinger et al., 2019). In
this study, with the new ruling applied, the SplitTime2 was on average 19.1s and the frequency of time rule
violations decreased to 12.6%. Only two of those incidents (0.9%) were penalized. Keeping in mind the rule
change to allow players 25s nowadays, we have to compare this number with the number of interruptions
exceeding the previous allowed time by more than 5s in the study of Kolbinger et al. (2019), which was
24.8%. Taken this into account, it seems that the number of violations halved itself, but the numbers need to
be treated with caution. The applied procedure took the score announcement as starting point, but this may
differ from the moment the chair umpire starts the serve clock. Further, in accordance with the official rules,
SplitTime2 was measured until the serve was hit instead of until the start of the service motion. Hence, we
took a separate look at those cases exceeding the time limit by more than 2s. As a consequence, the
percentage number of time violations dropped to 5.8% and penalizations raised to 2.1%. However, the fact
that SplitTime2 exceeded 25s in a high number even by more than 2s without being penalized, even supports
the concerns about the appropriate application of the serve clock. The small number of awarded time
violations indicates that either chair umpires start the serve clock late, mark the start of the next point before
the players start their service motion or just do not penalize players even if the clock ran down to Zero (visible
for all stakeholders).

Influence of the predictor variables on SplitTime1, SplitTime2 and Time
The increasing influence of PrevRL on Time and SplitTime2 can be seen as a physiological factor. Players
seem to take the time between points as a chance to recover from exhausting rallies. Kovalchik and Albert
(2017) also detected longer preparation times for players with increasing rally length of the previous point.
The increasing influence on SplitTime1, which represents the time until the chair umpire makes the score

 VOLUME -- | ISSUE - | 2020 | 9
Mühlberger et al. / The impact of the serve clock in tennis JOURNAL OF HUMAN SPORT & EXERCISE

announcement, might be due to two reasons. On the one hand, they are maybe aware of the physiological
factor of a long-lasting previous rally on the players and allow them more time. On the other hand, long rallies
are often also more spectacular than an early unforced error and the crowd applauds louder, sometimes
animated by the players who celebrate their points. Therefore, the chair umpire waits a few seconds longer
to calm down the crowd to be able to make an announcement hearable for everyone.

In contrast, the factor Game increasing Time as well as both SplitTimes seems to hark back more to the
importance of points towards the end of the set than physiological demands, as for Set the coefficient shows
a slightly negative influence, which indicates that the time between points does not just increase because the
overall duration of a match increases. Kolbinger et al. (2019) came to the same conclusion, stating that lost
service games in the late stages of a set put a player into more trouble, as less or no time is left to re-break
the opponent. In addition, Maquirriain et al. (2016) concluded that professional tennis players are able to
overcome ongoing fatigue and maintain a constant serving speed throughout a five-set-match, when
comparing the first and the final set. As in Kolbinger et al. (2019), Important Point and Tiebreak also indicate
that players tend to take more time under pressure and in the crucial time of a match. Kovalchik and Albert
(2017) also found longer preparation times associated with increased point importance.

Streak tend to reflect the patterns described above. The more pressure is on the serving player the more
time he takes. He might be thinking more about tactical components for the next point but could also try to
stop the rhythm of the opponent. In other sports time outs are often used to stop a negative flow of game (e.
g. in handball (Halldorsson, 2016)). In tennis – except for medical reasons - there shall not be any timeouts
and so prolonging the time to start the next point is the only possibility for tennis players to disrupt the rhythm
of their opponents. This observation goes along with the findings and conclusions from the study of Kolbinger
et al. (2019).

The individual habits of a player show the highest correlation with Time and SplitTime2, indicating differences
in the time the players take to serve. These results coincide with the wide-spread perception of different
player types on the tour. Fast serving player’s like Federer and Kyrgios contrast with slow paced players like
Nadal or Djokovic who have extensive rituals before they serve. The same evidence was found by Kolbinger
et al. (2019). Moreover, Kovalchik and Albert (2017) as well detected large variations among different players,
varying from 15s to 25s. Their findings further showed that variation between player’s is smaller than within,
leading to the assumption that all players react in the same way to influencing factors on their service routines.
Interestingly, PlayerMean does not influence SplitTime1. Thus, the chair umpire seems not do adapt his
routines based on the reputation of a player.

Taking a closer look at the influence of the chair umpire, it could be shown that the average time until score
announcement differed by more than 2s between chair umpires (UmpireMean1). As a consequence, players
are allowed to take more time between points depending on the chair umpire automatically, as the serve
clock is started later. Interestingly, an increase in UmpireMean also leads to an increased SplitTime2. This
means player do not have their consistent routines between points or orientate themselves always at the
same time on the serve clock running down independent from the chair umpire. Instead a player seems to
take even more time to prepare if one umpire is slower than another to start the serve clock.

Summarizing the results for SplitTime1, the conclusion that the chair umpire – hopefully unconsciously – has
an impact on the time between points is supported. Umpires seem to be aware of the score and the match
situation – indicated by the variables PrevRL, Game, Important Points and Tiebreak – and adapt their
behaviour correspondingly. This influence of the match situation on the timing of the score announcement

 10 | 2020 | ISSUE - | VOLUME -- © 2020 University of Alicante
Mühlberger et al. / The impact of the serve clock in tennis JOURNAL OF HUMAN SPORT & EXERCISE

indicates a temporal variance in the handling of the rule. Temporal variance describes the varying application
of rules under certain circumstances or during different period of a match, especially in the crunch-time. The
factors Game, Important Points, Tiebreak and PrevRL suggest a deviant behaviour from the chair umpires
which can be interpreted as temporal variance. Berman (2010) favours a temporal variant handling and
applying of rules. In his opinion, only the athletic skills should decide a close game. Standen (2013), in
contrast, criticizes a different application of rules, as rules are rules and those do not change during specific
(important) parts of a competition. He highlights that temporal variance takes away the competitive benefit
from one team and saves the offender from being penalized.

CONCLUSION

To conclude, the actual procedure of the application of the serve clock gives rise to some questions. First,
whereas the share of rule violations decreased, the aim of the tennis associations to speed up the game
could not be achieved. Regardless of the goal not being achieved, a serve clock though seems appropriate
to speed up the time of play as most of the time in tennis matches is spend in preparation of the serve
(Kovalchik, 2018; O’Donoghue and Liddle, 1998). Further, the study provides evidence for the chair umpire
directly and indirectly influencing the time between points. Umpires were found to vary the time until they
start the clock according to the match situation (temporal variance). In addition, umpires showed significant
individual patterns, for example starting the serve clock slower than other umpires, to which players adapted
by taking even more time until they start the next point. This start of a point, determined by the start of the
serving motion, is also vaguer defined than in the official rules (moment of the ball being hit).

Based on these findings, we argue that the duty of starting the serve clock should be transferred from the
chair umpire to a technological officiating aid (TOA). The widespread use of tracking technologies would
enable the tennis associations to perform this change without significant costs, as those TOAs are able to
determine the end – as well as the start – of a rally. This would avoid a possible favouritism of a player
depending on the match situation. Further, as it was already suggested by Kolbinger et al. (2019), the TOA
could be used to introduce a dynamic time limit coupled to the previous rally length. This physiological factor
is the only one that plays a comparable role to both players, so an adaption based on this would not favour
one of the players in some way.

AUTHOR CONTRIBUTIONS

Alexander Mühlberger conceived the study design, collected the data, contributed to the statistical analysis,
and drafted the manuscript. Otto Kolbinger conceived the study design, performed the statistical analysis and
drafted the manuscript. Both authors read and approved the final manuscript.

SUPPORTING AGENCIES

No funding agencies were reported by the authors.

DISCLOSURE STATEMENT

No potential conflict of interest was reported by the authors.

 VOLUME -- | ISSUE - | 2020 | 11
Mühlberger et al. / The impact of the serve clock in tennis JOURNAL OF HUMAN SPORT & EXERCISE

REFERENCES

 Arias, J. L., Argudo, F. M., & Alonso, J. I. (2011). Review of rule modification in sport. J Sport Sci Med,
 10(1), 1–8.
 ATP. (2018). USTA, ATP & WTA Implement Rules Innovations At Events Throughout Summer. Retrieved
 from https://www.atptour.com/en/news/shot-clock-implemented-in-us-summer-swing-2018
 ATP. (2019). The 2019 ATP® Official Rulebook. Retrieved from https://www.atptour.com/-
 /media/files/rulebook/2019/2019-atp-rulebook_02may.pdf
 Berman, M. N. (2010). Let’em Play: A Study in the Jurisprudence of Sport. Geo. LJ, 99, 1325–1369.
 Dohmen, T., & Sauermann, J. (2016). Referee Bias. J Econ Surv, 30(4), 679–695.
 https://doi.org/10.1111/joes.12106
 Grand Slam Board. (2019). Official Grand Slam® Rule Book. Retrieved from
 https://www.itftennis.com/media/1236/2019-grand-slam-rule-book.pdf
 Halldorsson, V. (2016). Coaches Use of Team Timeouts in Handball: A Mixed Method Analysis. The
 Open Sports Sciences Journal, 9(1), 143–152. https://doi.org/10.2174/1875399X01609010143
 ITF. (2019). ITF Rules of Tennis. Retrieved from https://www.itftennis.com/media/298557/298557.pdf
 Kim, J. W., & King, B. G. (2014). Seeing Stars: Matthew Effects and Status Bias in Major League Baseball
 Umpiring. Manage Sci, 60(11), 2619–2644. https://doi.org/10.1287/mnsc.2014.1967
 Kolbinger, O., Großmann, S., & Lames, M. (2019). A closer look at the prevalence of time rule violations
 and the inter-point time in men’s Grand Slam tennis. Journal of Sports Analytics, 5(2), 75–84.
 https://doi.org/10.3233/JSA-180277
 Kolbinger, O., & Lames, M. (2017). Scientific approaches to technological officiating aids in game sports.
 Current Issues in Sport Science (CISS), 2:001. https://doi.org/10.15203/CISS_2017.001
 Kolbinger, O., & Stöckl, M. (2019). Misbehavior During Penalty Kicks and Goalkeepers Holding the Ball
 Too Long as Trivial Offenses in Football. Frontiers in Psychology, 10:844.
 https://doi.org/10.3389/fpsyg.2019.00844
 Kovalchik, S. (2018). Why the tennis “serve clock” may be a waste of time. Significance, 15(4), 36–39.
 https://doi.org/10.1111/j.1740-9713.2018.01173.x
 Kovalchik, S. A., & Albert, J. (2017). A multilevel Bayesian approach for modeling the time-to-serve in
 professional tennis. Journal of Quantitative Analysis in Sports, 13(2), 49–62.
 https://doi.org/10.1515/jqas-2016-0091
 Maquirriain, J., Baglione, R., & Cardey, M. (2016). Male professional tennis players maintain constant
 serve speed and accuracy over long matches on grass courts. Eur J Sport Sci, 16(7), 845–849.
 https://doi.org/10.1080/17461391.2016.1156163
 Mills, B. M. (2014). Social Pressure at the Plate: Inequality Aversion, Status, and Mere Exposure.
 Manage Decis Econ, 35(6), 387–403. https://doi.org/10.1002/mde.2630
 O’Donoghue, P. D., & Liddle, S. D. (1998). A Notational Analysis of Time Factors of Elite Mens and
 Ladies Singles Tennis on Clay and Grass Surfaces. In A. Lees, I. Maynard, M. Hughes, & T. Reilly
 (Eds.), Science and Racket Sports II (pp. 241–246). London: E & FN Spon.
 Parsons, Christopher A., Johan Sulaeman, Michael C. Yates, and Daniel S. Hamermesh. 2011. "Strike
 Three: Discrimination, Incentives, and Evaluation." American Economic Review, 101 (4): 1410-35.
 https://doi.org/10.1257/aer.101.4.1410
 Pollard, G., & Noble, K. (2002). The Characteristics of Some New Scoring Systems in Tennis. In
 Proceedings of the Sixth Australian Conference on Mathematics and Computers in Sport (pp. 221–
 226). Australia: University of Technology, Sydney.

 12 | 2020 | ISSUE - | VOLUME -- © 2020 University of Alicante
Mühlberger et al. / The impact of the serve clock in tennis JOURNAL OF HUMAN SPORT & EXERCISE

 Simmonds, E., & O’Donoghue, P. (2018). Probabilistic models comparing Fast4 and traditional tennis.
 International Journal of Computer Science in Sport, 17(2), 141–162. https://doi.org/10.2478/ijcss-
 2018-0008
 Standen, J. (2013). Foot faults in crunch time: Temporal variance in sports law and antitrust regulation.
 Pepp. L. Rev., 41, 349–396.
 USA Today Sports. (2018). Citi Open implements shot clock, emulates MLB in desire to improve pace of
 play. Retrieved from https://eu.usatoday.com/story/sports/tennis/2018/07/31/tennis-shot-clock-
 follows-mlb-wish-speed-up-play/874161002/
 WTA. (2019). WTA Official Rulebook. Retrieved from
 http://wtafiles.wtatennis.com/pdf/publications/2019WTARulebook.pdf

 This work is licensed under a Attribution-NonCommercial-NoDerivatives 4.0 International (CC BY-NC-ND 4.0).
 VOLUME -- | ISSUE - | 2020 | 13
You can also read