Viral and Bacterial Pneumonia Detection using Articial Intelligence in the Era of COVID-19
←
→
Page content transcription
If your browser does not render page correctly, please read the page content below
Viral and Bacterial Pneumonia Detection using
Arti cial Intelligence in the Era of COVID-19
Mehmet Ozsoz
Near East University
Abdullahi Umar Ibrahim ( Abdullahi.umaribrahim@neu.edu.tr )
Near East University https://orcid.org/0000-0003-3850-9921
Sertan Serte
Near East University
Fadi Al-Turjman
Near East University
Polycarp Shizawaliyi Yakoi
Cyprus International University
Research Article
Keywords: COVID-19, Non-COVID-19 Viral Pneumonia, Bacterial Pneumonia, AlexNet, Chest X-rays Images
(CXR)
DOI: https://doi.org/10.21203/rs.3.rs-70158/v1
License: This work is licensed under a Creative Commons Attribution 4.0 International License.
Read Full License
Page 1/20
Abstract
Background: The outbreak of COVID-19 on the eve of January 2020 has led to global crisis around the
world. The disease was declared pandemic by World Health Organization (WHO) in mid-March. Currently
the outbreak has affected more than 150 countries with more than 20 million con rmed cases and more
than 700,000 death tolls. The standard method for detection of COVID-19 is the Reverse-Transcription
Polymerase Chain Reaction (RT-PCR) which is less sensitive, expensive and required specialized health
expert. As the number of cases continue to grow, there is high need for developing rapid screening
method that is accurate, fast and cheap.

Methods: We proposed the use of Deep Learning approach based on Pretrained AlexNet Model for
classi cation of COVID-19, non-COVID-19 viral pneumonia, bacterial pneumonia and normal Chest X-rays
Images (CXR) scans obtained from different public databases.

Result and Conclusion: For non-COVID-19 viral pneumonia and healthy datasets, the model achieved
94.43% accuracy, 98.19% Sensitivity and 95.78% Speci city. For bacterial pneumonia and healthy
datasets, the model achieved 91.43% accuracy, 91.94% sensitivity and 100% Speci city. For COVID-19
pneumonia and healthy CXR images, the model achieved 99.16% accuracy, 97.44% sensitivity and 100%
Speci city. For classi cation of COVID-19 pneumonia and non-COVID-19 viral pneumonia, the model
achieved 99.62% accuracy, 90.63% sensitivity and 99.89% Speci city. For multiclass datasets the model
achieved 94.00% accuracy, 91.30% sensitivity and 84.78% speci city for COVID-19, bacterial pneumonia
and healthy. For 4 classes (COVID-19, non-COVID-19 viral pneumonia, bacterial pneumonia and healthy,
the model achieved accuracy of 93.42%, sensitivity of 89.18% and speci city of 98.92%.

Introduction
Pneumonia is a common disease caused by different microbial species such as Bacteria, virus and Fungi
as shown in Fig 1. The word “Pneumonia” comes from the Greek word “Pneumon” which translates to
lungs. Thus, the word pneumonia is associated to lung disease. In medical terms, pneumonia is a disease
that causes in ammation of either one or both lung’s parenchyma [1]. However, pneumonia often result
from infection or not, such as food aspiration and exposure to chemicals. Based on infection, pneumonia
occur as a result of in ammation caused by pathogens which lead the lung’s alveoli to ll up with uid or
puss and thereby leading to decrease of Carbon dioxide and Oxygen exchange between blood and the
lungs, making it hard for infected persons to breathe. Some of the symptoms of pneumonia are:
shortness of breath, fever, cough, chest pain etc. Moreover, the people at risk of pneumonia are elderly
people (above 65 years), children (below the age of 5 years) and people with other complications such as
HIV/AIDS, diabetes, chronic respiratory diseases, cardiovascular diseases, cancer, hepatic disease etc. [2,
3, 4, 5]. Table 1 presents classi cation of pathogens that causes pneumonia.

Table 1. Classification of pneumonia based on Pathogens

                                                 Page 2/20
Pathogen Specie
Bacterial Streptococcus pneumoniae
Legionella pneumophila
Mycoplasma pneumoniae
Chlamydophila pneumoniae
Viruses Influenza virus
Severe Acute Respiratory Syndrome Coronavirus (SAR-CoV-1 and 2)
Middle East Respiratory Syndrome (MERS) Coronavirus
Respiratory Syncytial virus (RSV)
Adenovirus
Hantavirus
Rhinovirus
Varicella-zoster virus
Human metapneumovirus
Enteroviruses
Fungi Pneumocystis jirovecii
Aspergillus spp
Mucoromycetes
Histoplasmosis
Coccidioidomycosis
Cryptococcus
1.1 Diagnosis and Treatment of Pneumonia
There are different approaches for the diagnosis of pneumonia, some of these approaches include Chest
X-rays and CT Scan (which form the basis of our contribution), sputum test, pulse oximetry,
Thoracentesis, blood gas analysis, bronchoscopy, pleural uid culture, complete blood count etc. Mostly,
pneumonia infection is treated based on the causative pathogen. For bacterial pneumonia, antibiotics are
used, for viral pneumonia such as in uenzas, SARS and MERS, antiviral drugs are used while antifungal
drugs are used for fungal pneumonia [5, 6, 7].
1.2 COVID-19 and Pneumonia
COVID-19 is an extremely contagious disease caused by Severe Acute Respiratory Syndrome Coronavirus
2 (SAR-CoV-2), it is the recent and buzzing disease that is caused by one of the family members of
Coronaviridae family. In the past, 2 members of this family known as Severe Acute Respiratory Syndrome
(SARS) and Middle East Respiratory Syndrome (MERS) have caused global epidemic. The rst case of
COVID-19 was reported in Wuhan, Hubei province of mainland China on 31st December, 2019. The virus
spread from city to city and from one country to another leading to global health crisis. However, it was
not until March 11, 2020 that WHO declared it as pandemic [8, 9, 10].
Page 3/20COVID-19 can be transmitted through respiratory droplets that are exhaled or secreted by infected
persons. Coronaviruses invade the lung’s alveoli (an organ responsible for exchange of O2 and CO2, thus
causing pneumonia. The symptoms of COVID-19 include dry cough, fatigue, fever, septic shock, organ
failure, anorexia, dyspnea, myalgias, sputum secretion severe pneumonia, Acute Respiratory Distress
Syndrome (ARDS) etc. [11, 12, 13, 14]. The pandemic caused by SAR-CoV-2 is alarming due to the fact
there is no approved drug or vaccine [15].
In order to curb further spread of the virus, parliaments or governments of various countries and states
imposed city lockdowns, ight cancellations, border restrictions, closure of workplaces, restaurants,
postponement of sport, religious, cultural and entertainment event and activities, wearing of face mask,
social distancing of 1-2m, and creating awareness on hygiene. Many countries are facing challenges
regarding number of reported cases of COVID-19 as a result of the lack of RT-PCR test kit and delay in test
kit. This delay is detrimental as it leads to more cases due to interaction between infected patients
waiting for result with healthy population [16, 17].
1.3 Deep Learning (DL) and Transfer Learning (TL)
Deep Learning is a branch of machine learning (ML), a subset of Arti cial intelligence (AI) inspired by the
make-up of the human brain. It is termed as a sub- eld of Machine Learning (ML) that works similar to
the biology of human brains by taking data and processing the data through networks and neural
networks. Many biomedical health issues such as cancer (brain tumor and breast cancer) detections are
using computer aided diagnosis base on AI models. Precisely, DL Models can detect hidden features in
images which are not apparent or cannot be detected by medical expert. In terms of DL, Convolutional
Neural Network (CNN) is the leading DL tool that is popularly used in different sub- eld of healthcare
system due to their ability to extract features and learn to distinguish between different classes (i.e.
positive and negative, infected and healthy, cancer and non-cancer etc. Transfer learning has provided
easier approach to quickly retrain neural networks on selected dataset with high accuracy [18, 19, 20].
1.3.1 AlexNet
AlexNet model is a DL model proposed by Alex Krizhevsky which utilize Recti ed Linear Unit (ReLu) in
place of Sigmoid function which is used in traditional neural networks. The model achieved 84%
accuracy in 2012 ImageNet Large Scale Visual Recognition Challenge (ILSVRC). It contains 5 convolution
(CONV) blocks or layer with convolutional lters size 3x3 without padding and 2x2 window size of 2X2
for Max pooling operation. The last 3 layers are 2 fully connected layers (FCL) and output layer. Other
terms include Batch Normalization (BN) and Feature Map (FM). SoftMax activation function is utilized in
the output layer for classi cation. Minibatch optimization is a gradient descent that is used to improve
the model [21, 22].
1.4 Challenges
Page 4/20As the number of COVID-19 patient grows exponentially, there is high need massive detection which is
critical for prevention and control. Medical practitioners all over the world required sophisticated system
to accurately diagnose COVID-19. Different approaches are currently in used for detection of different
types of pneumonia. However, detection of different strains of pathogens using molecular testing is still
not up to standard of point of care diagnostics. Instead, specimens are collected from site of infections
are transfer to equipped or specialized laboratories for diagnosis using RT-PCR sequencing approach
which is the current gold standard [23]. This method is expensive and often lead to false result. Moreover,
underdeveloped countries and remote areas with limited testing kit and equipped hospitals with
ventilators have become the epicenter of the disease. Thus, there is high need for developing an
alternative approach which is fast, cheap, simple and reliable. The use of X-ray has proven to be an
alternative; however, this method is sometimes tedious for quali ed radiologist [24]. These challenges
can be addressed by computer aided detection method using DL approach which is accurate, fast and
precise.
1.5 Contribution
Accordingly, our contributions have been summed up as follows.
We suggested the use of Pretrained (transfer learning) AlexNet Model to detect COVID-19 pneumonia
non-COVID-19 viral pneumonia, bacterial pneumonia and normal/healthy patients using CXR image.
We trained the models separately to differentiate:
Between COVID-19 pneumonia and normal/healthy patient
Between non-COVID-19 Viral pneumonia and normal/healthy patient
Between Bacterial pneumonia and normal/healthy Patient
Between COVID-19 pneumonia and non-COVID-19 Viral pneumonia
Between COVID-19 pneumonia, Bacterial pneumonia and normal/healthy Patient
Between COVID-19 pneumonia, non-COVID-19 viral pneumonia, bacterial pneumonia and normal/healthy
Patient
We assessed the performance of the network based on accuracy, sensitivity and speci city
1.6 Related Work
The last decade has seen exponential rise for the application of DL in healthcare system. Different
studies have shown that DL models can be used for pathological cancer images, diabetic retinopathy, CT
scan of pneumonia and tuberculosis as well as microbial slide images. In the eld of pathology,
pathologist, Computer scientist and radiologist have been working together to detect diseases such as
cancer, pneumonia and tuberculosis using computer aided diagnosis [25, 26, 27].
Page 5/20In terms of application of DL models for detection of Pneumonia using CT scan and Xray images, we
provided literature review based on studies that:
1. Classi ed/distinguished between COVID-19, non-COVID-19 viral pneumonia (VP) and healthy CXR
images or between COVID-19, bacterial pneumonia (BP) and healthy images (i.e. multiclass).
2. Classi ed/distinguished between COVID-19 and Non-COVID-19 viral pneumonia (VP) or COVID-19
and healthy CXR images (i.e. 2 classes).
3. Classi ed/distinguished between Non-COVID-19 Viral Pneumonia (VP) and Healthy CXR images
Chest Scan based on Chest X-ray or Computed Tomography (CT) scan is an approach radiologist used to
distinguish between patient suffering from pneumonia and healthy person. The difference is based on
the presence of white hazy patches which is known as “Ground-glass opacity” in infected patient which is
absent in healthy person. However, as a result of scarcity of test for diagnosing COVID-19 as well as the
high cost (120-130 USD), time consuming, low sensitivity, laborious of RT-PCR method, scientist turn to
chest scan such as CT scans and X-rays as an alternative approach for diagnosis of severe pneumonia
caused by SAR-CoV-2 and Bacterial Pneumonia [28]. Moreover, this approach has its own challenges
such as shortage of expert (i.e. radiologist) that can interpret the result and the tediousness of
interpreting thousands of CT scan and Xray images. These challenges are addressed by AI driven models
which have shown high e ciency in assisting medical expert in classi cation and prediction of disease
[29, 30].
Many studies have reported the use of CXR and CT scans along with Deep Learning models in order to
achieve automated detection of COVID-19 pneumonia and other type of pneumonia such as non-COVID-
19 viral pneumonia and bacterial pneumonia. Moreover, many studies have shown the viability of using
TL models which are deep networks pretrained on the ImageNet database for classi cation of for
classi cation of pneumonia from healthy CT scans [31, 32, 33].
The approach of TL in DL is utilized by Chowdhury et al., 2020 [17] to differentiate between COVID-19 and
viral pneumonia based on dataset acquired from public database. The models were trained using 423
COVID-19, 1458 viral pneumonia and 1579 normal Chest X-ray images on 2 basis (I) augmentation and
(II) without augmentation. The models achieved higher accuracies, sensitivities and speci cities. A multi
dilation CNN is utilized by Mahmud et al., 2020 [34] to classify COVID-19 and other forms of pneumonia.
The study utilized a deep CNN as COVXNet with modi cations base on varying dilation rates for feature
extraction, optimization, stacking algorithms and gradient-based discriminative localization to train
dataset containing 1493 Non-COVID-19 viral pneumonia, 305 COVID-19 pneumonia, 2780 bacterial
pneumonia. The Model achieved 97.4% accuracy for COVID-19 vs normal, 96.9% for COVID-19 Vs non-
COVID-19 viral pneumonia, 94.7% for COVID-19 vs bacterial pneumonia and 90% for multi-class.
In order to show the difference between COVID-19 and Community Acquired Pneumonia (CAP), Li et al
2020 [35] utilized 3-Dimensional DL framework know as COVID-19 detection neural network (COVNet)
using 4352 CT scans (1292 of COVID-19, 1735 of CAP and 1325 normal CT scans). The model achieved
Page 6/2090% sensitivity and 96% speci city for detection of COVID-19 and 87% sensitivity and 92% speci city for
detection of CAP. Apostolopoulos et al., 2020 [31] utilized TL approach on dataset that contain 1427 x-ray
images (504 Normal Xray Images, 700 Bacterial Pneumonia and 224 COVID-19 Xray Images). The model
was able to achieved 96.78% accuracy, 96.46% speci city and 98.66% sensitivity. The summary of
application of AI for detection of pneumonia is presented in Table 2.
Table 2. Detection of different types of Pneumonia using AI-driven tools.
Classification Reference Type of Dataset Result
pneumonia
COVID-19, [35] COVID-19 4352 CT scans (1292 90% *SV and 96% *SF for detection of
non-COVID-19 and of COVID-19, 1735 of COVID-19 and 87% *SV and 92% *SF
VP, BP and Community CAP and 1325 normal for detection of CAP
normal CT Acquired CT scans)
scans Pneumonia
(CAP)
[17] COVID-19 423 COVID-19, 1458 The models achieved higher
and non- viral pneumonia and accuracies, sensitivities and
COVID-19 1579 normal Chest X- specificities
VP ray images
[34] COVID-19, 1493 non-COVID-19 The Model achieved 97.4% *AC for
non-COVID- viral pneumonia, 305 COVID-19 vs normal, 96.9% for COVID-
19 VP, BP COVID-19 pneumonia, 19 Vs non-COVID-19 VP, 94.7% for
2780 bacterial COVID-19 vs BP and 90% for multi-
pneumonia class
Non-COVID-19 [36] Non-COVID- 5856 X-ray images Average *Ac of 94.81% training and
VP, BP and 19 VP 93.01% for validation
normal CT (strain not
scans specified)
[37] Non-COVID- 453 CT scan images The model achieved validation *AC of
19 VP 82.9%, *SV of 84% and *SF of 80.5%,
testing *AC of 73.1%, *SV of 74% and
*SF of 67%.
[38] Viral 5863 Chest X-Ray *AC of 95.30%
pneumonia Images
(strain not
specified)
[39] VP (COVID- 618 CT scan Images *AC of 86.7%.
19,
Influenza-A)
Non-COVID-19 [40] Non-COVID- 5856 chest X-Ray *Ac of 96.2% accuracy for BP and
VP and BP 19 VP and 93.6% for non-COVID-19 VP
BP (strains
not
specified)
*Ac is Accuracy, *BP is Bacterial pneumonia *Sv is Sensitivity, *Sf is Specificity *VP is Viral Pneumonia
Methods
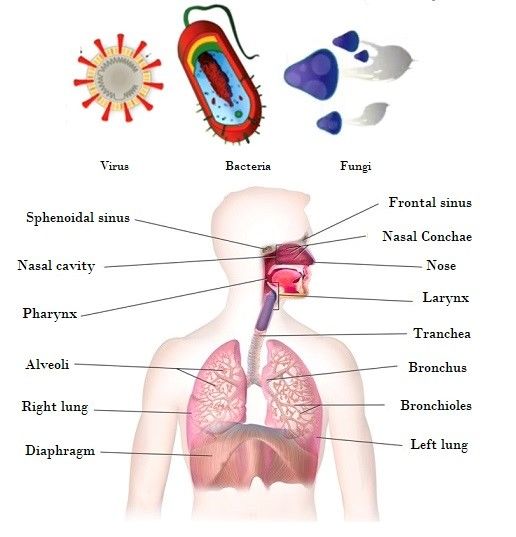
Page 7/20In this section, we detail the proposed approach procedures and its main assumptions. The work process
of the proposed approach is schematically shown in Fig 2. TL on DL Models have shown to perform
e ciently even with small amount of dataset compare to Deep Learning models build from scratch which
require large amount of dataset [41].
2.1. Dataset
Even though there are more than 20 million con rmed cases of COVID-19 globally, the amount of CT scan
images that are available online are very few and limited. As shown in Fig 3, we obtained COVID-19
pneumonia, non-COVID-19 viral pneumonia, bacterial pneumonia and normal CXR images from the
following website:
1. 153 images from GitHub (https://github.com/ieee8023/covid-chestxray-dataset)
2. 219 images from Kaggle (https://www.kaggle.com/tawsifurrahman/covid19-radiography-database).
We removed 1 image due to low contrast, making the total number of images 371. We also obtained
1341 normal Xray images, 1345 non-COVID-19 viral pneumonia
3. 1341 normal, non-COVID-19 viral pneumonia, 4274 bacterial pneumonia from
https://www.kaggle.com/sudalairajkumar/novel-corona-virus-2019-dataset
4. We obtained CXR images made available by Kermany et al., 2018 [42]. The dataset contains 3
folders (Training, validation and Testing with a total number of 5856 positive and negative cases. In
each folder there is a subfolder with names Pneumonia and normal folders. The dataset description
is based on X-ray images collected from retrospective pediatric patients between the age of 1 to 5.
The number of each CXR images used are presented in Table 3.
Table 3. Dataset Description.
Type of Dataset Number of Dataset
COVID-19 pneumonia 371
Non-COVID-19 viral pneumonia 4237
Bacterial pneumonia 4078
Healthy (i.e. Normal) 2882
2.1.1 Model Training
For training of datasets, we employed Matlab installed on personal computer with window-64-bit, 8GB
random access memory (RAM), with an intel ® Core i7-3537U and graphical Processing unit (GPU). 30%
of the dataset split as testing dataset are used evaluate the model performance as shown in Table 4.
Pretrained AlexNet model is employed due to it high accuracy in carrying out feature extraction and
image classi cation. The training is carried out using 20 epochs with 0.0001 learning rate.
Table 4. Dataset Split
Page 8/20Model Training 70% Testing (30%)
Non-COVID-19 VP and Non-COVID 19 Healthy Non-COVID 19 Healthy
Healthy VP VP
2966 2017 1271 965
BP and Healthy Bacterial Healthy Bacterial Healthy
2853 2017 1225 965
COVID-19 and Healthy COVID-19 Healthy COVID-19 Healthy
260 2017 111 965
COVID-19 and Non-COVID-19 COVID 19 Non-COVID-19 VP COVID-19 Non-COVID-19 VP
VP 260 2966 111 1271
COVID-19, BP and Healthy COVID- BP Healthy COVID- BP Healthy
19 19
260 2853 2017 111 1225 965
COVID-19, Non-COVID-19 VP, COVID- BP Non- Healthy COVID- BP Non- Healthy
BP and Healthy 19 COVID-19 19 COVID-
VP 19 VP
260 2853 2966 2017 111 1225 1271 965
*BP: Bacterial Pneumonia VP: Viral Pneumonia
2.1.2 Parameters
To assess how the trained models performed, three parameters are employed; accuracy, sensitivity and
speci city. Accuracy is termed as the ratio of correctly classi ed images over total number of images, it is
also termed as the sum of sensitivity and speci city. For evaluating the loss and accuracy of a model the
following formulas are utilized as shown in equation 1 and 2.
Sensitivity (True Positive rate) is the proportion of positive image samples that are accurately identi ed
as positive sample (i.e. it shows the percentage of positive samples that are identi ed correctly as
positives). While Speci city (False positive rate (FPR)) is the proportion of positive samples that are
identi ed incorrectly as positive samples (i.e. it shows the percentage of negative samples that are
identi ed incorrectly as positives). The formula of sensitivity and speci city are shown in equation 3 and
4 respectively.
Page 9/20Where TPS = True Positives, FNs = False Negatives, TNs = True Negatives and FPs = False Positive
Results
In this section, the performance of the models are presented based on each type of pneumonia (COVID-
19, bacterial and non-COVID-19 viral pneumonia) with healthy CXR images, COVID-19 and non-COVID-19
viral pneumonia and multiclass (1) COVID-19, bacterial pneumonia and healthy and (2) COVID-19, non-
COVID-19 viral pneumonia, bacterial pneumonia and healthy as shown in Table 5 and Fig 4. Moreover,
comparison between some state of art approaches with our models are presented based on COVID-19
and non-infected (healthy) CXR images and multiclass as shown in Table 6.
3.1 Performance Evaluation
The datasets are divided into two - 70% used in training and 30% used for testing. Performance of the
models are evaluated based on testing accuracy, sensitivity and speci city. Firstly, we carried out a pilot
study using 371 CXR images each for COVID-19, non-COVID-19, bacterial pneumonia and healthy Images.
We obtained low accuracy, sensitivity and speci city due to low amount of dataset. We carried out this
study to analyzed the linearity of the dataset by using same amount training and testing dataset due to
the fact that we have only 371 COVID-19 CXR images.
Before we carried out a multiclass classi cation, we trained each type of pneumonia with healthy (non-
pneumonia or non-infected) CXR images. For Non-COVID-19 viral pneumonia and Healthy datasets, we
achieved 94.43% Testing accuracy, 98.19% sensitivity and 95.78% Speci city. In terms of bacterial
pneumonia and healthy datasets, we achieved 91.43% Testing accuracy, 91.94% sensitivity and 100%
Speci city. This shows that the model has learned to classi ed negative images (non-infected/healthy)
accurately compare to positive CXR images (bacterial pneumonia). Moreover, majority of the recent
studies focused on COVID-19 pneumonia and Non-infected CXR dataset. Our model achieved high
evaluation performance with 99.16% Testing Accuracy, 97.44% sensitivity and 100% Speci city.
CXR scan images of a variety of viral pneumonia are similar, making it hard for radiologist to distinguish
COVID-19 with other viral pneumonia. This limitation can lead to miss-diagnosis and at the same time
can lead to non-COVID-19 viral pneumonia miss-diagnosed as COVID-19 pneumonia [17]. To addressed
this limitation, we trained our model to distinguish between COVID-19 pneumonia and non- COVID-19
Page 10/20viral pneumonia. The model was able to achieved 99.62 Testing Accuracy, 90.63% sensitivity and 99.89%
Speci city.
For multiclass dataset, before we train the whole classes, we examine the performance of the model
based on 3 classes (COVID-19, bacterial pneumonia and healthy) to see how the model will perform
before integrating non-COVID-19 viral pneumonia. The model achieved low accuracy compare to models
trained to distinguish between 2 classes with 94.00% testing accuracy, 91.30% sensitivity and 84.78%
speci city. Based on this result, we hypothesized to achieve lower performance based on 4 classes
(COVID-19, non-COVID-19 viral pneumonia, bacterial pneumonia and healthy). However, the model
achieved lower accuracy compare to 3 classes in terms of testing accuracy (93.42%) and sensitivity
(89.18%) while the model achieved higher speci city (98.92%) compare to 3 classes as shown in Table 5
and Figure 4.
Table 5. Performance Evaluation
S/N Dataset Training Testing Sensitivity Specificity
Accuracy (%) Accuracy (%) (%)
(%)
I Non-COVID-19 viral pneumonia and healthy 96.43 94.05 98.19 95.78
II Bacterial pneumonia and healthy 95.28 91.96 91.94 100.00
III COVID-19 and healthy 99.71 99.16 97.44 100.00
IV COVID-19 and non-COVID-19 viral pneumonia 99.57 99.62 90.63 99.89
V COVID-19, bacterial pneumonia and healthy 97.40 95.00 91.30 84.78
VI COVID-19, non-COVID-19 viral pneumonia, 94.18 93.42 89.18 98.92
bacterial pneumonia and healthy
3.2 Comparison between our result with State of Art
As seen in Table 5, the performances of Pretrained AlexNet Models are compared with other proposed
models. Compare to our work, the study carried out by Li et al 2020 [35] grouped viral and bacterial
pneumonia as Community Acquired Pneumonia (CAP). However, our study disputes this approach,
COVID-19 as viral disease resembles other viral pneumonia. The result we achieved when comparing
COVID-19 and other viral pneumonia has shown lower sensitivity and speci city (90.63% and 99.89%
respectively) compare to COVID-19 and healthy which achieved 97.44% sensitivity and 100% speci city.
Our claim is also supported by Chowdhury et al 2020 [17] who stated that “Models performed extremely
well when used for classifying COVID-19 and normal images compared to COVID-19 and other viral
pneumonia. Both Bai et al., 2020 [43] and Narin et al., 2020 [32] have also reported high degree of
similarity between COVID-19 and other viral pneumonia when considering physiological and clinical
prospective.
With regards to the classi cation of COVID-19 and normal CXR images, it can be observed that our model
provides signi cantly a better performance compare to studies that utilized small amount of dataset
Page 11/20such as Mahmud et al., 2020 [34] and models developed from scratch. The impressive performance of
the model is attributed to the use of TL based on pretrained models which have shown to perform
e ciently with less amount of data compare to models designed from scratch such as Tan et al., 2018
[19]. In terms of classi cation between Non-COVID-19 viral pneumonia and Healthy CXR images, several
studies utilized same dataset made available by Kermany et al., 2018 [42]. Majority of these studies
achieved higher performance of above 90% Accuracy such as Stephen et al. 2019 [36], Saravia et al.,
2019 [38] and Rajaraman et al., 2018 [40]. However, our model achieved result within same range with
94.43% Accuracy.
Table 6. Comparison between our Result and State of Art
Page 12/20Class Reference Dataset Result
Multiclass Ac Sv Sf
(3-4) [35] 4352 CT scans (1292 of - 90% 96%
COVID-19, 1735 of CAP and for for
1325 normal CT scans) COVID- COVID-
19 19
87% 92%
for for
CAP CAP
[17] 423 COVID-19, 1458 VP and - - -
1579 normal Chest X-ray
images
[34] 1493 non-COVID-19 VP, 305 90% - -
COVID-19 P, 2780 BP
Our Model (3 371 COVID-19, 4078 BP and 94.00% 91.30% 84.78%
Classes) 2882 healthy
Our Model (4 371 COVID-19, 4237 non- 93.42% 89.18% 98.92%
Classes) COVID-19 VP, 4078 BP and
2882 healthy
2 Classes [34] 305 COVID-19 P 97.4% for COVID-19 - -
vs normal
[34] 305 COVID-19 P and1493 non- 96.9% for COVID-19 - -
COVID-19 VP Vs non-COVID-19 viral
pneumonia,
[34] 305 COVID-19 pneumonia and 94.7% for COVID-19 - -
2780 bacterial pneumonia vs bacterial
pneumonia
[36] 5856 CXR images 93.01% - -
[37] 453 CXR images 73.1%, 74% 67%
[38] 5863 CXR Images 95.30% - -
[39] 618 CXR Images 86.7%. - -
[40] 5856 CXR 96.2% for BP and - -
93.6% for Non-
COVID-19 VP
Our Model (Non- 4237 Non-COVID-19 VP and 94.43% 98.19% 95.78%
COVID-19 VP and 2882 healthy datasets
healthy datasets
Our Model (BP and 4078 BP and 2882 healthy 91.43% 91.94% 100%
healthy datasets datasets,
Our Model (COVID- 371 COVID-19 and 2882 99.16% 97.44% 100%
19 and healthy healthy datasets
datasets
Our Model (COVID- 371 COVID-19 and 4237 non- 99.62% 90.63% 99.89%
19 and non- COVID- COVID-19 VP.
19 VP)
*Ac is Accuracy, *Sv is Sensitivity, *Sf is Specificity *P is Pneumonia *VP is Viral Pneumonia
*BP is Bacterial Pneumonia *CXR is Chest X-ray
Page 13/20Conclusion
This work presents the utilization of Deep Neural Network based on TL approach (known as Pretrained
AlexNet Model) for automatic detection of COVID-19 pneumonia, non-COVID-19 viral pneumonia and
bacterial pneumonia. The models were trained based on 2 classes and multiclass. For 2 classes (each of
COVID-19, non-COVID-19 viral pneumonia and bacterial pneumonia with healthy CXR Images, COVID-19
and non-COVID-19 viral pneumonia. For multiclass, the models are trained based on (1) 3 classes (COVID-
19, bacterial pneumonia and healthy CXR images) (2) 4 classes (COVID-19, non-COVID-19 viral
pneumonia and bacterial pneumonia and healthy CXR images. The models were evaluated using
Accuracy, Sensitivity and Speci city. However, the outcome has shown that these models achieved
94.43% Testing Accuracy, 98.19% Sensitivity and 95.78% Speci city for non-COVID-19 viral pneumonia
and healthy datasets. For bacterial pneumonia and healthy datasets, the model achieved 91.43% Testing
accuracy, 91.94% sensitivity and 100% Speci city. In terms of COVID-19 pneumonia and healthy CXR
images, the model achieved 99.16% Testing Accuracy, 97.44% sensitivity and 100% Speci city. For
classi cation of COVID-19 pneumonia and non-COVID-19 viral pneumonia, the model achieved 99.62
Testing Accuracy, 90.63% sensitivity and 99.89% Speci city. For multiclass datasets the model achieved
94.00% testing accuracy, 91.30% sensitivity and 84.78% speci city for 3 classes (COVID-19, bacterial
pneumonia and healthy) and testing accuracy of 93.42%, sensitivity of 89.18% and speci city of 98.92%
for 4 classes (COVID-19, non-COVID-19 viral pneumonia, bacterial pneumonia and healthy).
The higher performance achieved for classi cation of COVID-19 pneumonia and non-COVID-19 viral
pneumonia and COVID-19 pneumonia with healthy CXR images has shown that computer-aided
detection approach can be used as an alternative or con rmatory approach against RT-PCR method
which has shown to be less sensitive, time consuming and laborious. One of the limitations of this
research is the fact that we used a small dataset of COVID-19 pneumonia. This challenge makes it
di cult to generalized our result. In the future, we hope to acquire more dataset and to train the images
using deeper Neural Networks such as Pretrained GoogleNet and ResNet.
Declarations
Ethical approval
This article does not contain any studies with human participants performed by any of the authors.
Funding: No funding
Con ict of Interest: We declared no con ict of interests.
References
1. Sattar, S. B. A., & Sharma, S. (2019). Bacterial pneumonia.
Page 14/202. Pound, M. W., Drew, R. H., & Perfect, J. R. (2002). Recent advances in the epidemiology, prevention,
diagnosis, and treatment of fungal pneumonia. Current opinion in infectious diseases, 15(2), 183-
194.
3. Virkki, R., Juven, T., Rikalainen, H., Svedström, E., Mertsola, J., & Ruuskanen, O. (2002). Differentiation
of bacterial and viral pneumonia in children. Thorax, 57(5), 438-441.
4. Jones, R. N. (2010). Microbial etiologies of hospital-acquired bacterial pneumonia and ventilator-
associated bacterial pneumonia. Clinical infectious diseases, 51(Supplement_1), S81-S87.
5. Ruuskanen, O., Lahti, E., Jennings, L. C., & Murdoch, D. R. (2011). Viral pneumonia. The Lancet,
377(9773), 1264-1275.
6. World Health Organization. (2014). Revised WHO classi cation and treatment of pneumonia in
children at health facilities: evidence summaries.
7. Gao, J., Tian, Z., & Yang, X. (2020). Breakthrough: Chloroquine phosphate has shown apparent
e cacy in treatment of COVID-19 associated pneumonia in clinical studies. Bioscience trends.
8. Fan, Y., Zhao, K., Shi, Z. L., & Zhou, P. (2019). Bat coronaviruses in China. Viruses, 11(3), 210.
9. Gómez, P., Semmler, M., Schützenberger, A., Bohr, C., & Döllinger, M. (2019). Low-light image
enhancement of high-speed endoscopic videos using a convolutional neural network. Medical &
biological engineering & computing, 57(7), 1451-1463.
10. Huang, Chaolin, Yeming Wang, Xingwang Li, Lili Ren, Jianping Zhao, Yi Hu, Li Zhang et al. "Clinical
features of patients infected with 2019 novel coronavirus in Wuhan, China." The lancet 395, no.
10223 (2020): 497-506.
11. Chen, S. G., Chen, J. Y., Yang, Y. P., Chien, C. S., Wang, M. L., & Lin, L. T. (2020). Use of radiographic
features in COVID-19 diagnosis: Challenges and perspectives. Journal of the Chinese Medical
Association, 83(7), 644-647.
12. Li, Qun, Xuhua Guan, Peng Wu, Xiaoye Wang, Lei Zhou, Yeqing Tong, Ruiqi Ren et al. "Early
transmission dynamics in Wuhan, China, of novel coronavirus–infected pneumonia." New England
Journal of Medicine (2020).
13. Lai, C. C., Shih, T. P., Ko, W. C., Tang, H. J., & Hsueh, P. R. (2020). Severe acute respiratory syndrome
coronavirus 2 (SARS-CoV-2) and corona virus disease-2019 (COVID-19): the epidemic and the
challenges. International journal of antimicrobial agents, 105924.
14. Wang, Dawei, Bo Hu, Chang Hu, Fangfang Zhu, Xing Liu, Jing Zhang, Binbin Wang et al. "Clinical
characteristics of 138 hospitalized patients with 2019 novel coronavirus–infected pneumonia in
Wuhan, China." Jama 323, no. 11 (2020): 1061-1069.
15. Rothan, H. A., & Byrareddy, S. N. (2020). The epidemiology and pathogenesis of coronavirus disease
(COVID-19) outbreak. Journal of autoimmunity, 102433.
16. Mueller, M., Derlet, P. M., Mudry, C., & Aeppli, G. (2020). Using random testing to manage a safe exit
from the COVID-19 lockdown. arXiv preprint arXiv:2004.04614.
Page 15/2017. Chowdhury, M. E., Rahman, T., Khandakar, A., Mazhar, R., Kadir, M. A., Mahbub, Z. B., ... & Reaz, M. B. I.
(2020). Can AI help in screening viral and COVID-19 pneumonia?. arXiv preprint arXiv:2003.13145.
18. Yan, L. C., Yoshua, B., & Geoffrey, H. (2015). Deep learning. nature, 521(7553), 436-444.
19. Tan, C., Sun, F., Kong, T., Zhang, W., Yang, C., & Liu, C. (2018, October). A survey on deep transfer
learning. In International conference on arti cial neural networks (pp. 270-279). Springer, Cham.
20. Raghu, M., Zhang, C., Kleinberg, J., & Bengio, S. (2019). Transfusion: Understanding transfer learning
for medical imaging. In Advances in neural information processing systems (pp. 3347-3357).
21. Krizhevsky, A., Sutskever, I., & Hinton, G. E. (2012). Imagenet classi cation with deep convolutional
neural networks. In Advances in neural information processing systems (pp. 1097-1105).
22. You, Y., Zhang, Z., Hsieh, C., Demmel, J., & Keutzer, K. (2017). 100-epoch imagenet training with
alexnet in 24 minutes. arXiv preprint arXiv:1709.05011.
23. Lippi, G., Simundic, A. M., & Plebani, M. (2020). Potential preanalytical and analytical vulnerabilities
in the laboratory diagnosis of coronavirus disease 2019 (COVID-19). Clinical Chemistry and
Laboratory Medicine (CCLM), 1(ahead-of-print).
24. Chen, N., Zhou, M., Dong, X., Qu, J., Gong, F., Han, Y., ... & Yu, T. (2020). Epidemiological and clinical
characteristics of 99 cases of 2019 novel coronavirus pneumonia in Wuhan, China: a descriptive
study. The Lancet, 395(10223), 507-513.
25. Ching, T., Himmelstein, D. S., Beaulieu-Jones, B. K., Kalinin, A. A., Do, B. T., Way, G. P., ... & Xie, W.
(2018). Opportunities and obstacles for deep learning in biology and medicine. Journal of The Royal
Society Interface, 15(141), 20170387.
26. Kallianos, K., Mongan, J., Antani, S., Henry, T., Taylor, A., Abuya, J., & Kohli, M. (2019). How far have
we come? Arti cial intelligence for chest radiograph interpretation. Clinical radiology.
27. Wang, F., Casalino, L. P., & Khullar, D. (2019). Deep learning in medicine—promise, progress, and
challenges. JAMA internal medicine, 179(3), 293-294.
28. Wang, W., Xu, Y., Gao, R., Lu, R., Han, K., Wu, G., & Tan, W. (2020). Detection of SARS-CoV-2 in different
types of clinical specimens. Jama, 323(18), 1843-1844.
29. Shan, F., Gao, Y., Wang, J., Shi, W., Shi, N., Han, M., ... & Shi, Y. (2020). Lung infection quanti cation of
covid-19 in ct images with deep learning. arXiv preprint arXiv:2003.04655.
30. Yang, W., & Yan, F. (2020). Patients with RT-PCR-con rmed COVID-19 and normal chest CT. Radiology,
295(2), E3-E3.
31. Apostolopoulos, I. D., & Mpesiana, T. A. (2020). Covid-19: automatic detection from x-ray images
utilizing transfer learning with convolutional neural networks. Physical and Engineering Sciences in
Medicine, 1.
32. Narin, A., Kaya, C., & Pamuk, Z. (2020). Automatic detection of coronavirus disease (covid-19) using
x-ray images and deep convolutional neural networks. arXiv preprint arXiv:2003.10849.
33. Wang, L., & Wong, A. (2020). COVID-Net: A Tailored Deep Convolutional Neural Network Design for
Detection of COVID-19 Cases from Chest X-Ray Images. arXiv preprint arXiv:2003.09871.
Page 16/2034. Mahmud, T., Rahman, M. A., & Fattah, S. A. (2020). CovXNet: A multi-dilation convolutional neural
network for automatic COVID-19 and other pneumonia detection from chest X-ray images with
transferable multi-receptive feature optimization. Computers in biology and medicine, 103869.
35. Li, L., Qin, L., Xu, Z., Yin, Y., Wang, X., Kong, B., ... & Cao, K. (2020). Arti cial intelligence distinguishes
COVID-19 from community acquired pneumonia on chest CT. Radiology.
36. Stephen, O., Sain, M., Maduh, U. J., & Jeong, D. U. (2019). An e cient deep learning approach to
pneumonia classi cation in healthcare. Journal of healthcare engineering, 2019
37. Wang S., Sun, J., Mehmood, I., Pan, C., Chen, Y., & Zhang, Y. D. (2020). Cerebral micro‐bleeding
identi cation based on a nine‐layer convolutional neural network with stochastic pooling.
Concurrency and Computation: Practice and Experience, 32(1), e5130.
38. Saraiva, A., Ferreira, N., Sousa, L., Carvalho da Costa, N., Sousa, J., Santos, D., & Soares, S. (2019).
Classi cation of Images of Childhood Pneumonia using Convolutional Neural Networks. In 6th
International Conference on Bioimaging (pp. 112-119).
39. Rajpurkar, P., Irvin, J., Zhu, K., Yang, B., Mehta, H., Duan, T., ... & Lungren, M. P. (2017). Chexnet:
Radiologist-level pneumonia detection on chest x-rays with deep learning. arXiv preprint
arXiv:1711.05225.
40. Rajaraman, S., Candemir, S., Kim, I., Thoma, G., & Antani, S. (2018). Visualization and interpretation
of convolutional neural network predictions in detecting pneumonia in pediatric chest radiographs.
Applied Sciences, 8(10), 1715.
41. Tajbakhsh, N., Shin, J. Y., Gurudu, S. R., Hurst, R. T., Kendall, C. B., Gotway, M. B., & Liang, J. (2016).
Convolutional neural networks for medical image analysis: Full training or ne tuning?. IEEE
transactions on medical imaging, 35(5), 1299-1312.
42. Kermany, D., Zhang, K., & Goldbaum, M. (2018). Labeled optical coherence tomography (OCT) and
Chest X-Ray images for classi cation. Mendeley data, 2.
43. Bai, H. X., Hsieh, B., Xiong, Z., Halsey, K., Choi, J. W., Tran, T. M. L., ... & Jiang, X. L. (2020).
Performance of radiologists in differentiating COVID-19 from viral pneumonia on chest CT.
Radiology, 200823.
Figures
Page 17/20Figure 1
Classi cation of Pneumonia
Page 18/20Figure 2
The complete work ow is represented schematically. CXR Images are used to train the network using
Pretrained AlexNet Model for classi cation of classify (I) COVID-19 and normal (healthy) CXR scans (II)
bacterial and normal CXR scans (III) viral pneumonia and normal CXR scan (IV) COVID-19 and bacterial
CXR scans (V) COVID-19, bacterial pneumonia and normal CXR scans and (VI) COVID-19, bacterial
pneumonia, viral pneumonia and normal CXR scans.
Page 19/20Figure 3
CXR scans. (1) COVID-19 (2) non-COVID 19 viral pneumonia (3) Normal CXR scan (4) bacterial
pneumonia
Figure 4
Performance Evaluation of models based on Accuracy, Sensitivity and Speci city
Supplementary Files
This is a list of supplementary les associated with this preprint. Click to download.
MATLABNEWEDITEDCODE.docx
Page 20/20You can also read