Mixture model investigation of the inner-outer asymmetry in visual crowding reveals a heavier weight towards the visual periphery - Nature
←
→
Page content transcription
If your browser does not render page correctly, please read the page content below
www.nature.com/scientificreports
OPEN Mixture model investigation
of the inner–outer asymmetry
in visual crowding reveals a heavier
weight towards the visual
periphery
Adi Shechter1,2 & Amit Yashar1,3*
Crowding, the failure to identify a peripheral item in clutter, is an essential bottleneck in visual
information processing. A hallmark characteristic of crowding is the inner–outer asymmetry in which
the outer flanker (more eccentric) produces stronger interference than the inner one (closer to the
fovea). We tested the contribution of the inner-outer asymmetry to the pattern of crowding errors
in a typical radial crowding display in which both flankers are presented simultaneously on the
horizontal meridian. In two experiments, observers were asked to estimate the orientation of a Gabor
target. Instead of the target, observers reported the outer flanker much more frequently than the
inner one. When the target was the outer Gabor, crowding was reduced. Furthermore, when there
were four flankers, two on each side of the target, observers misreported the outer flanker adjacent
to the target, not the outermost flanker. Model comparisons suggested that orientation crowding
reflects sampling over a weighted sum of the represented features, in which the outer flanker is more
heavily weighted compared to the inner one. Our findings reveal a counterintuitive phenomenon: in
a radial arrangement of orientation crowding, within a region of selection, the outer item dominates
appearance more than the inner one.
Crowding refers to our inability to identify an object (primarily in the peripheral visual field) because it is
presented with nearby o bjects1–6. Crowding is considered to be an impediment to r eading7, face r ecognition8,
eye movements9,10, visual search3 as well as deficits like macular degeneration11, amblyopia12 and dyslexia58–60.
Research has characterized crowding and distinguished it from other spatial interferences, such as masking6,13,
lateral interaction14 and surround suppression15. Yet, the underlying processes of crowding are still unclear3,5,16,17.
Researchers have associated crowding with a variety of factors: the reduction in spatial resolution in the periph-
ery due to increased receptive field size of cells at early visual a reas18–20, decreased cortical magnification21 and
reduced attentional r esolution22–25.
A hallmark characteristic of crowding is the inner-outer asymmetry: an outer flanker (more peripheral)
produces stronger interference than an inner one (closer to the fovea)1,4,15,22,23,26,30,34 (but s ee33,57). The asym-
metry effect has been demonstrated with different stimulus types and tasks, such as letter r ecognition34, face
recognition27 and Gabor orientation d iscrimination15. Nevertheless, the mechanisms underlying this phenom-
enon remain a matter of debate.
Researchers have proposed various causes of the inner-outer asymmetry. According to the cortical magnifica-
tion account, the smaller cortical distance between the outer flanker and the target leads to stronger interference
between these two i tems21,35. Other accounts postulate that increased receptive field size in the periphery biases
sampling rate toward the outer fl anker26 or leads to sparse selection in the visual p eriphery30. Finally, the atten-
tional account attributes display layout and experimental task in biasing spatial attention outwards, leading to
anker22,23. Yet, none of the proposed accounts directly link the inner-outer asymmetry
the selection of the outer fl
with recent models of crowding.
1
The Edmond J. Safra Brain Research Center for the Study of Learning Disabilities, The University of Haifa,
Haifa, Israel. 2The Department of Learning Disabilities, Faculty of Education, The University of Haifa, Haifa,
Israel. 3The Department of Special Education, Faculty of Education, The University of Haifa, 199 Abba Khoushy
Ave, 3498838 Haifa, Israel. *email: amit.yashar@edu.haifa.ac.il
Scientific Reports | (2021) 11:2116 | https://doi.org/10.1038/s41598-021-81533-9 1
Vol.:(0123456789)www.nature.com/scientificreports/
Proposed models of crowding were often classified to either pooling m odels6,36–41 or substitution m odels17,42–44.
According to pooling models, under crowding, due to inappropriate integration field size in the periphery,
observers simultaneously detect and pool excessive information of low-level features, including those that belong
ankers6,19,36–39. In the more simple form of pooling models, crowding reflects an averaging of target and
to the fl
flanker features. For example, simple averaging errors were observed in judging target o rientation39 and target
position36. However, simple pooling models cannot explain the well-documented finding showing that under
crowding conditions observers often misreport a flanker as the t arget17,42–44. Such misreport errors led to the
proposal of substitution models, according to which increased location uncertainty in the p eriphery45–47 renders
observers failure to spatially differentiate between the target and the flankers.
In recent years, researchers were able to reconcile these conflicting findings by proposing more advanced
pooling models that can predict both averaging and misreporting errors (reviewed by Rosenholtz et al.48). For
example, several studies have proposed a population coding model that codes target and flanker features as a
weighted sum within a receptive field and can explain both averaging and misreporting errors of o rientation37,40,49,
color and spatial frequency49. Investigations of these models often use estimation reports in which observers
estimated the target feature in a continuous space; for example, reporting the orientation of the target by adjusting
the orientation of a probe. In such tasks, observers often reported the flanker instead of the t arget42,49,50. By fitting
a probabilistic mixture model with a misreport component (probability of reporting a flanker value), researchers
were able to independently assess the precision of reported item and the contribution of the flankers to the distri-
bution of the estimation errors42,49. This misreport mixture model acts similarly to the population coding model
and can, therefore, serve to determine the relative activation of each item in the population49. However, whether
the relative contribution, and hence activation, of the outer flanker is different from the inner one is still unclear.
Here, we addressed this issue by investigating the inner–outer asymmetry in a radial Gabor orientation
crowding display with an orientation estimation task. We separately assessed the contribution of the inner and
outer flankers to the pattern of crowding errors by comparing between various mixture models. Our findings
show that a misreport mixture with a separate misreport component for the inner and the outer flanker outper-
formed all other tested models. Interestingly, we revealed that the misreport rate was much higher for the outer
flanker than the inner one.
Experiment 1
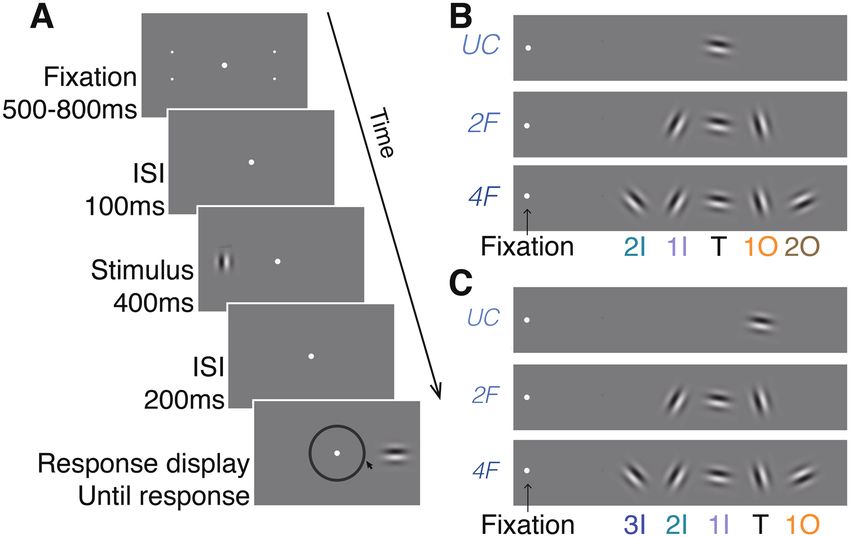
Observers performed an orientation estimation task of peripheral sinusoidal gratings (Gabor patches) in which
the target (7° eccentricity) appeared alone (uncrowded conditions) or flanked (crowded conditions) by either
two (two-flanker condition) or four (four-flanker condition) Gabors. Target and flankers were arranged on
the horizontal meridian, either to the left or to the right of fixation. The centre-to-centre distance between two
adjacent items was 1.5° (Fig. 1A). In crowded conditions, the target was always in the middle of the string of
Gabors, such that in the two-flanker condition there was one inner flanker and one outer flanker, whereas in the
four-flanker condition there were two inner flankers and two outer flankers with respect to the target (Fig. 1B).
Method
Observers. Thirteen undergraduate and graduate students (11 females: age range = 20–31 years, M = 25.23,
SD = 3.32) from The University of Haifa participated in this experiment for course credit or a 40 ILS per hour
monetary payment (around $12). On the basis of a priori power analysis, using effect sizes from previous s tudies49,
we estimated that a sample size of 12 observers was required to detect a crowding effect with 95% power, given
a 0.05 significance criterion. We collected data from one more observer in anticipation of possible dropouts or
equipment failure. All observers were naive to the purposes of the experiment. All observers reported having
normal or corrected-to-normal visual acuity and normal colour vision, and none reported attention deficits or
epilepsy. The observers signed a written informed consent form before the experiment. This study was carried
out in accordance with the relevant guidelines and regulations. The University Committee on Activities Involv-
ing Human Subjects at The University of Haifa approved the experimental procedures (No. 373/18).
Apparatus. Stimuli were programmed in Matlab (The MathWorks, Inc., Natick, MA) with the Psychophys-
ics Toolbox extensions51 and presented on a gamma-corrected 21-in CRT monitor (SGI, with 1280 × 960 resolu-
tion and 85-Hz refresh rate) connected with an IMac. Eye movements were monitored with an Eyelink 1000 Plus
(SR Research, Ottawa, ON, Canada), by using a chin rest at a 57-cm viewing distance. Observers reported their
responses by using the mouse.
Stimuli and procedure. Figure 1A,B illustrate trial sequence and stimulus conditions in “Experiment 1”.
All stimuli were presented on a grey background (56 cd/m2). Each trial began with the presentation of a fixation
display. The fixation display consisted of a fixation mark (a centred dot subtending 0.1°) along with two periph-
eral pairs of place holders, one pair in the right hemifield and one in the left hemifield (7° eccentricity and ± 2°
vertical offset from the horizontal meridian), which indicated the eccentricity of the upcoming target. Both fixa-
tion mark and place holders were white (112 cd/m2).
Following observers’ fixation for a random duration lasting between 500 and 800 ms, the fixation mark
appeared for an interstimulus interval (ISI) of 100 ms. The stimulus display appeared for 400 ms. The stimulus
display consisted of the fixation mark along with the target; a sinusoidal grating (Gabors) with a 2D Gaussian
spatial envelope (standard deviation 0.55° and 85% contrast); and a spatial frequency of 1.5 cycles per degree
(cpd). The target appeared on the horizontal meridian with 7° eccentricity, either in the right or left hemifield.
The target could appear alone (uncrowded condition) or along with two flankers (two-flanker crowded condition)
or four flankers (four-flanker crowded condition), which were located on the horizontal meridian on either side
Scientific Reports | (2021) 11:2116 | https://doi.org/10.1038/s41598-021-81533-9 2
Vol:.(1234567890)www.nature.com/scientificreports/
Figure 1. Stimulus type and crowding conditions. (A) Illustration of the sequence of events within a trial.
During the fixation display, two pairs of dots, one pair in each hemifield, indicated the two possible locations
(eccentricity) of the target. Observers estimated the orientation of the Gabor target by pointing the mouse
cursor on a wheel. (B) The three stimulus conditions in “Experiment 1”. In “Experiment 1” the target was always
the intermediate Gabor, whereas in (C) “Experiment 2”, the target was the Gabor located one position out from
the intermediate position. 3I 3rd inner flanker, 2I 2nd inner flanker, 1I 1st inner flanker, T target, 1O 1st outer
flanker, 2O 2nd outer flanker.
of the target. The centre-to-centre distance between two adjacent items was 1.5°. In the two-flanker condition,
flankers’ eccentricities were 5.5° and 8.5° for the first inner (1I) and first outer (1O) flankers respectively. In the
four-flanker condition, flankers’ eccentricities were 4°, 5.5°, 8.5° and 10° for the second inner (2I), first inner (1I),
first outer (1O) and second outer (2O) flankers respectively. Thus, all flankers appeared within the window of
crowding (< 0.5 of eccentricity). Target and flanker orientation were selected at random from a circular param-
eter space of 180 values evenly distributed between 1° and 180°, with the restriction that each of the flanker’s
orientation differed from that of the target by at least 15°.
Following the stimulus display, an additional fixation screen was presented for 200 ms, which was followed
by a response display. During the response display, observers were required to use a mouse cursor to adjust
the probe Gabor’s orientation to match the orientation of the target by selecting a position on the orientation
wheel (marked by a black circle 0.08° thick with an inner radius of 3.8° at the centre of the screen). Following
an observer’s response, a blank inter trial interval (ITI) appeared for 400 ms. In each trial, we monitored eye
fixation using an eye tracker (see “Apparatus”). Trials in which fixation was broken (> 1.5° from fixation mark)
were terminated and rerun at the end of the block.
Design. Each observer completed 15 blocks of 40 trials (600 trials in total) over a 60-min session. There
were 200 trials in each of the three crowding conditions (uncrowded condition, two-flanker condition and four-
flanker condition). Crowding conditions were randomly mixed within each block. To reduce location uncer-
tainty, observers were told that the pairs of dots have the same eccentricity as the upcoming target. The experi-
ment began with two practice blocks of 10 trials. Observers were encouraged to take a short rest between blocks.
Models and analyses. For each trial, we calculated the estimation error for orientation by subtracting the
true value of the target from the estimation value, such that zero indicates target value. To assess the contribution
of the flankers to the error distribution (i.e. models with misreport components) we calculated flankers’ values
by subtracting the true value of the target from the values of the flankers. We analyzed the error distributions by
fitting probabilistic mixture models, which were developed from the standard model as well as the standard with
misreport model28. We compared among four models:
The standard mixture model (Eq. 1), as described in Yashar et al.49, has two components: a von Mises (circular)
distribution, which describes the probability density of reports around the target’s orientation, and a uniform
distribution, which describes the probability of reports unrelated to the target (guessing rate). The model has
two free parameters (γ, σ):
Scientific Reports | (2021) 11:2116 | https://doi.org/10.1038/s41598-021-81533-9 3
Vol.:(0123456789)www.nature.com/scientificreports/
1
p(θ) = (1 − γ )f (θ)σ + γ (1)
180
where θ is the value of the estimation error, γ is the proportion of trials in which participants are randomly guess-
ing (guessing rate), and f(θ)σ is the von Mises distribution with a standard deviation (variability) σ (the mean is
set to zero), and n is the total number of possible values for the target’s feature.
The standard misreport model (Eq. 2) adds a misreport component to the standard mixture model, which
describes the probability of reporting one of the flankers to be the target. The model has three free parameters
(γ, σ, β):
m
1 1
p(θ) = (1 − γ − β)f (θ)σ + γ ( )+β f (θi∗ )σ (2)
180 m i
where β is the probability of reporting a flanker as the target, m is the total number of flankers (two or four in the
present study), and f (θ ∗ )i is the von Mises distribution around the feature of the i flanker. Notice that the von
Mises distribution of the estimation errors f (θ) describes the distribution when the observer correctly estimated
the target’s feature, thus its mean is zero; whereas, for the distribution of misreporting one flanker as the target
( f (θ ∗ )), the mean would be the feature distance of the corresponding flanker to that of the target. The variability
of the distributions for each stimulus was assumed to be the same.
To test for sampling bias over the flankers (differences in sampling weights across flankers), we also fitted
models with an independent β component for each flanker.
The two-misreport model (Eq. 3) has a separate misreport component for each of the flankers in the two-
flanker condition, one for the inner flanker and one for the outer flanker. This model has four free parameters
(γ, σ, β1I , β1O):
1 ∗
p(θ) = (1 − γ − β1I − β1O )f (θ)σ + γ ( ) + β1I f (θ1I ∗
)σ + β1O f (θ1O )σ (3)
n
where β values represent the weights for each flankers: β1I is the probability of misreporting the inner flanker as
the target, and β1O is the probability of misreporting the outer flanker as the target.
The four-misreport model (Eq. 4) has a separate misreport component for each of the flankers in the four-
flanker condition. The model has six free parameters (γ, σ, β1I , β1O,β2I ,β2O):
1 ∗ ∗ ∗ ∗
p(θ) = (1−γ −β2I −β1I −β1O −β2O )f (θ)σ +γ ( )+β2I f (θ2I )σ +β1I f (θ1I )σ +β1O f (θ1O )σ +β2O f (θ2O )σ
n
(4)
where β2I is the probability of misreporting the second inner flanker (innermost) as the target and β2O is the
probability of misreporting the second outer (outermost) flanker as the target.
emToolBox52. We compared models’ performance by
We fit the models to the individual data using the M
comparing means Akaike information criterion with correction (AICc) to the individual data.
For each fitted model, we calculated target reporting rate (PT) by subtracting the accumulative guess-
ing rate and misreport rate from 1, such that PT = 1 − γ , PT = 1 − γ − β , PT = 1 − γ − β1I − β1O
,PT = 1 − γ − β1I − β1O − β2I − β2O, for the standard mixture, misreport, two-misreport and four-misreport,
respectively.
Results
Figure 2A plots the error distribution for each condition. We first examined the bias of the errors by calcu-
lating mean error for each subject in each condition. Mean error was close to zero in the uncrowded condi-
tion (M = − 1.17, SD = 1.62), the two-flanker condition (M = − 1.33, SD = 2.46) and the four-flanker condition
(M = − 1.16, SD = 2.7). For each observer in each condition, we calculated precision as the inverse of the variance
of the errors (Fig. 2B). We conducted a one-way Analysis of Variance (ANOVA) on precision with crowding
conditions (uncrowded vs. two-flanker vs. four-flanker) as a within subject factor. A main effect on precision
was observed, F(2,24) = 28.05, p < 0.001, partial η2 = 0.70, indicating higher precision in the uncrowded condi-
tion than in the two-flanker condition, t(12) = 5.30, p < 0.001, Cohen’s d = 1.93, and in the two-flanker condition
compared to the four-flanker condition, t(12) = 2.18, p = 0.050, Cohen’s d = 0.56.
Probabilistic models. In uncrowded conditions, the standard mixture model described well the distribu-
tion of the errors (Fig. 2A). For each crowding condition we chose the best model among two relevant models
by calculating the AICc for each observer. Figure 2C shows mean AICc for the relevant models in each flanker
condition. In both crowded conditions, the model with multiple misreports outperformed the other two models.
First, the standard misreport model outperformed the standard mixture model in the two-flanker and the four-
flanker conditions, t(12) = 4.63, p = 0.001, Cohen’s d = 0.72, and t(12) = 2.57, p = 0.025, Cohen’s d = 0.64 respec-
tively. In the two-flanker condition, the two-misreport model outperformed the standard misreport model,
t(12) = 4.54, p = 0.001, Cohen’s d = 0.77. In the four-flanker condition, the four-misreport model outperformed
the standard misreport model, t(12) = 2.58, p = 0.024, Cohen’s d = 0.56. These results suggest that in crowded
conditions observers misreported specific flankers more than others.
To check for averaging errors in the inner–outer asymmetry, we tested whether observers averaged the target
with the outer flanker by calculating a mean bias toward the outer flanker (Supplementary Information). To do
this, we realigned the error directions so that the first-outer flanker was always positive with respect to the target.
Scientific Reports | (2021) 11:2116 | https://doi.org/10.1038/s41598-021-81533-9 4
Vol:.(1234567890)www.nature.com/scientificreports/
Figure 2. Error distribution and model comparison of “Experiment 1”. (A) Mean errors for each of the three
crowding conditions. Solid lines are the best performing model in each crowding condition. (B) Mean precision
(inversed SD in radiance) of the errors in each crowding condition. (C) Mean AICcs for each model subtracted
from the AICc of the best performing model (AICc2M – AICci and AICc4M – AICci, in the two-flanker and four-
flanker respectively) in each crowded condition. UC uncrowded, 2F two-flanker and 4F four-flanker. Models:
S standard mixture, M misreport, 2M two-misreport, 2B two-misreport with bias, 4M four-misreport, 4B four-
misreport with bias. Error bars are within subject ± 1 SEM.
Figure 3. Model parameters in “Experiment 1”. (A) Mean variability (σ), (B) guessing rate (γ) and (C) target
reporting rate ( PT) for each crowding condition. UC uncrowded, 2F two-flanker, 4F four-flanker. Error bars
are ± 1 SEM.
Calculation of the mean of the errors revealed a positive mean bias—i.e. mean errors were shifted towards the
outer flanker (Figure SI1). However, model comparisons revealed no advantage for models with bias compared
to models without bias (Fig. 2C), suggesting that heavier weights over the outer flanker (sampling bias) in the
two- and four-misreport models, without an additional averaging process, is sufficient to explain the mean bias.
Next, we analyzed the fitted parameters of the best performing model in each condition. Figure 3 depicts the
mean fitted variability (γ) guessing rate (σ) and target reporting rate (PT) of the best fitted models in each condi-
tion. To assess the effect of crowding on performance, we conducted one-way repeated measure analyses of vari-
ance (ANOVA) on variability, guessing rate and target reporting rate as dependent variables, with crowding con-
dition as a within subject factor. There was a main effect of crowding condition on guessing rate, F(2,24) = 5.78,
p = 0.009, partial η2 = 0.33, but not on variability, F(2,24) = 2.37, p = 0.115. There was a main effect of crowding
condition on target reporting rate, F(2,24) = 71.21, p < 0.001, partial η2 = 0.86, revealing higher probability of
reporting on the target under the uncrowded condition compared to the two-flanker condition, t(12) = 8.27,
p < 0.001, Cohen’s d = 2.93, and the four-flanker condition, t(12) = 12.35, p < 0.001, Cohen’s d = 4.74. The prob-
ability of reporting on the target under the two crowded conditions did not differ significantly, t(12) = − 1.40,
p = 0.188.
In order to test the contribution of each flanker to crowding errors, we compared the misreport rates of
the different flankers. Figure 4 depicts the distributions of reports around the value of each flanker and the
probability of reporting each presented item. Importantly, in the two-misreport model (the two-flanker condi-
tion), the misreport rate of the outer flanker was significantly higher than the misreport rate of the inner one,
t(12) = − 2.59, p = 0.024, Cohen’s d = 1.24. In the four-misreport model (the four-flanker condition), we conducted
a one-way ANOVA on misreport rate with flanker positions (second inner, first inner, first outer and second
outer) as within subject factor. Flanker position had a significant effect on misreport rate, F(3,36) = 5.74, p = 0.003,
partial η2 = 0.32, indicating that misreport rate differed across flankers. Planned comparisons revealed that the
Scientific Reports | (2021) 11:2116 | https://doi.org/10.1038/s41598-021-81533-9 5
Vol.:(0123456789)www.nature.com/scientificreports/
Figure 4. Misreporting the outer flanker as the target in “Experiment 1”. (A,B) Distribution of reports around
the value of each flanker (0) for the (A) two-flanker and (B) four-flanker conditions, along with the fitting (solid
lines) of the two-misreport model and the four-misreport model respectively. (C,D) Reporting rates for each
item in the two-flanker (C) and four-flanker (D) conditions. Flanker report rates are the fitted independent β to
each flanker in the two-misreport (C) and the four-misreport (σ) (D) models. 2I 2nd inner flanker, 1I 1st inner
flanker, T target, 1O 1st outer flanker, 2O 2nd outer flanker. Error bars are within subject ± 1 SEM.
misreport rate of the first (adjacent) outer flanker (M = 0.24, SD = 0.13), was higher compared to the averaged
probability of reporting on the other three flankers (M = 0.07, SD = 0.07), t(12) = 3.43, p = 0.005, Cohen’s d = 1.59.
These findings support the view that the inner-outer asymmetry is due to misreport of the first (adjacent) outer
flanker as the target.
The results of “Experiment 1” show that a reduction in overall precision of orientation estimation tasks
under crowding is due to reporting a flanker instead of the target rather than an increase in variability (σ) over
the representation of the target. This finding is consistant with a previous study49. Importantly, the results show
that when the target is flanked radially from both sides, observers often misreport the orientation of the outer
flanker that is adjacent to the target instead of the target. Observers misreported a flanker that was inner or not
adjacent to the target in a much smaller proportion of the trials.
Experiment 2
Following the results of “Experiment 1”, in “Experiment 2” we examined whether observers’ tendency to report
the outward item (a flanker) instead of the central one (the target) is a mutual process. If this is indeed a mutual
process, when the target is the outward item observers will often misreport the central item (a flanker) as the
target. We used the same display as in “Experiment 1”, except that now the target was shifted one Gabor outward.
That is, in the two-flanker condition, the target was the outermost Gabor, and, in the four-flanker condition,
the target was flanked by the outermost Gabor (see Fig. 1C). Note that the target eccentricity was increased in
“Experiment 2” compared to “Experiment 1”. Thus, if crowding zone size merely scales with eccentricity, we
predict stronger crowding in “Experiment 2” compared to 1 in all crowded displays. Alternatively, if the crowd-
ing zone is also skewed outward—that is, with more interference from the outer flanker—then we predict a
substantial reduction in crowding in the two-flanker condition in which the outmost item is the target, and a
strong crowding effect in the four-flanker condition, in which the target is flanked by an outer flanker.
Scientific Reports | (2021) 11:2116 | https://doi.org/10.1038/s41598-021-81533-9 6
Vol:.(1234567890)www.nature.com/scientificreports/
2F 4F
A .150 B 4 C S M 2M 2B S M 4M 4B
NF
2F 0
4F
Probability
Precision
.075 2
-50
.000
0 -100
-90 0 90 NF 2F 4F
Orientation errors Condition
Figure 5. Error distributions and model comparisons of “Experiment 2”. (A) Mean errors for each of the three
crowding conditions. Solid lines represent the best performing model in each crowding condition. (B) Mean
precision (inverse of the SD of the errors in radiance) of the errors in each crowding condition. (C) Mean
AICcs for each model subtracted from the AICc of the best performing model in each crowded condition
(the two-misreport model and the four-misreport model in the two-flanker and the four-flanker conditions,
respectively). UC uncrowded, 2F two-flanker and 4F four-flanker. Models: S standard mixture, M misreport,
2M two-misreport, 2B two-misreport with bias, 4M four-misreport, 4B four-misreport with bias. Error bars are
within subject ± 1 SEM.
Method
Observers. Fourteen undergraduate and graduate students (10 females: age range 19 to 36 years old,
M = 25.71, SD = 5.03), from The University of Haifa participated in this experiment for a course credit or a 40
ILS per hour monetary payment (around $12). All observers were naive to the purposes of the experiment. All
observers reported having normal or corrected-to-normal visual acuity and normal colour vision, and none
reported attention deficits or epilepsy. The observers signed a written informed consent form before the experi-
ment. The experimental procedures were approved by The University Committee on Activities Involving Human
Subjects at The University of Haifa (No. 373/18).
Apparatus. The apparatus was the same as described in “Experiment 1”.
Stimuli and procedure. Figure 1A,C illustrate a trial sequence and stimulus condition in “Experiment 2”.
Stimuli and procedure were the same as in “Experiment 1”, except for the location of the target. In this experi-
ment, the target appeared on the horizontal meridian with 8.5° eccentricity, either in the right or left hemifield.
In the two-flanker condition, the target was the outer item, whereas in the four-flanker condition, the target was
located near the outer flanker. Here too, the centre-to-centre distance between two adjacent items was 1.5°. In
the two-flanker condition, flanker eccentricities were 5.5° and 7° for the second inner (2I) and first inner (1I)
flankers respectively. In the four-flanker condition, flanker eccentricities were 4°, 5.5°, 7° and 10° for the third
inner (3I), second inner (2I), first inner (1I) and first outer (1O) flankers respectively.
Design. The design was the same as described in “Experiment 1”.
Models and analyses. The statistical analyses were the same as described in “Experiment 1”.
Results
Figure 5A illustrates the error distribution for each condition. Here again, we first analyzed the bias of the errors
by calculating mean error for each subject in each condition. Mean error was close to zero in the uncrowded
condition (M = − 1.01, SD = 2.29), the two-flanker condition (M = − 0.41, SD = 2.75) and the four-flanker condition
(M = 0.34, SD = 4.03). As in “Experiment 1”, we calculated precision as the inverse of the variance of the errors
for each observer in each condition (Fig. 5B). One-way ANOVA analyses on precision and crowding condition
as within subjects factor revealed a significant main effect of crowding conditions on precision, F(2,26) = 44.30,
p = 0.000, partial η2 = 0.77, indicating higher precision in the uncrowded condition compared to the two-flanker
condition, t(13) = 6.13, p = 0.000, Cohen’s d = 1.45, and in the two-flanker condition compared to the four-flanker
condition, t(13) = 4.19, p = 0.001, Cohen’s d = 1.60.
Probabilistic models. In the uncrowded condition, the standard mixture model described well the dis-
tribution of the errors (Fig. 5A). For each flanker condition, we calculated the Akaike information criterion
with correction (AICc) for each observer, in order to choose the best model among the two relevant models.
Figure 5C presents mean AICc for the relevant models in each crowding condition. In the two-flanker condition,
there was no best-fitting model, meaning that no significant differences were found between the standard misre-
port model and the standard mixture model, t(13) = 1.30, p = 0.216, and between the independent two-misreport
Scientific Reports | (2021) 11:2116 | https://doi.org/10.1038/s41598-021-81533-9 7
Vol.:(0123456789)www.nature.com/scientificreports/
Figure 6. Model parameters in “Experiment 2”. (A) Mean standard deviation (σ), (B) guessing rate (γ) and (C)
target reporting rate (PT) for each crowding condition. Model parameters are of the S, M2 and M4 models in the
uncrowded, two-flanker and four-flanker conditions, respectively. UC uncrowded, 2F two-flanker and 4F four-
flanker. Error bars are ± 1 SEM.
model and the standard misreport model, t(13) = 1.25, p = 0.232. This result is explained by small crowding inter-
ference in this condition. However, in the four-flanker condition, the standard misreport model outperformed
the standard mixture model, t(13) = 4.06, p = 0.001, Cohen’s d = 0.69, and the independent four-misreport out-
performed the standard misreport model, t(13) = 3.80, p = 0.002, Cohen’s d = 0.91. In this condition, misreport
rates were higher for some flankers compared to others. As in “Experiment 1”, we tested the fitting of models
with mean bias towards the outer flanker (Supplementary Analysis). Again, adding the mean bias component
did not improve model fitting (Fig. 5C and Figure SI2), which indicates that the misreport models are sufficient
to explain our results.
Next, we analyzed the fitted parameters of the best performing model (smallest AICc) in each condition.
Figure 6 depicts the mean fitted variabilities (σ) and guess rates (γ) of the best fitted models in each condition.
In order to examine the effect of crowding on performance, we conducted a one-way ANOVA with crowding
condition (uncrowded vs. two-flanker vs. four-flanker) as a within subject factor and variability (σ), guess rate
(γ) and target reporting rate (PT) as dependent variables. Significant differences were found between the crowd-
ing conditions for γ, F(2,26) = 9.86, p = 0.001, partial η2 = 0.43, σ, F(2,26) = 15.71, p = 0.001, partial η2 = 0.55,
and PT, F(2,26) = 71.66, p < 0.001, partial η2 = 0.85. Specifically, the probability to report on the target decreased
as the number of flankers increased, with significant differences between the uncrowded condition and the
crowded conditions (two-flanker: t(13) = 3.76, p = 0.002, Cohen’s d = 1.35, four-flanker: t(13) = 21.17, p < 0.001,
Cohen’s d = 7.17), and between the two crowded conditions, t(13) = 6.36, p = 0.001, Cohen’s d = 2.26.
We assessed the contribution of each flanker to crowding errors by comparing the misreport rates of the
different flankers. Figure 7 depicts the report distribution around the value of each flanker and the probability
of reporting each presented item. In the two-misreport model (the two-flanker condition), in which subjects
were asked to report on the outer flanker, we found insignificant effect for flankers’ positions, (t(13) = − 0.35,
p = 0.730). In the four-misreport model (four-flanker condition), we conducted a one-way ANOVA on misre-
port rate with flanker position (third inner, second inner, first inner, and first outer) as within subject factor. A
significant effect for flanker position was obtained in the four-flanker condition in which the target was located
near the outer flanker, F(3,39) = 12.94, p = 0.000, partial η2 = 0.50. Here, planned comparisons revealed that the
misreport rate of the first (adjacent) outer flanker (1O) (M = 0.44, SD = 0.25) was significantly higher compared
to the averaged misreport rate of the other flankers (M = 0.06, SD = 0.09), t(13) = 4.41, p = 0.001, Cohen’s d = 2.03.
These findings are consistent with Experiment’s 1 results, and support the view that observers often misreport
the first (adjacent) outer flanker as the target.
The results of “Experiment 2” show that the reduction of overall precision in orientation estimation task
under crowding is due to both reporting a flanker instead of the target and increased variability (σ) over the
representation of the target. Here again, we found that observers reported the adjacent flanker that was more
eccentric rather than the target. However, when the target was the outer item, crowding was reduced and there
was no significant difference in the misreport rate (PT) between the flankers. Furthermore, as shown in previous
studies6,53, in both “Experiment 1” and “Experiment 2” we found that the frequency of responses around the
target decreases with an increase in the number of flankers.
Finally, we examined the effect of flanker position on crowding interference. To do so, we conducted an inde-
pendent t-test for each crowded condition and compared the target reporting rate (PT) and standard deviation
(σ) between “Experiment 1” and “Experiment 2”. PT analyses revealed that in the uncrowded condition, target
reporting rate did not differ significantly, t(25) =− 0.39, p = 0.701, meaning that observers were unaffected by
item eccentricity per se. However, significant differences were found between the two experiments in the two
crowded conditions. In the two-flanker condition, when observers reported the outer item (“Experiment 2”)
crowding was smaller than when observers reported the item in the middle (“Experiment 1”), t(25) = − 2.69,
p = 0.013, Cohen’s d = 1.04. Although we increased the target eccentricity, crowding interference was reduced
when observers reported the outer item (“Experiment 2”), suggesting that our findings cannot be explained by
target eccentricity alone. In the four-flanker condition, when the outer target was flanked by an outer flanker
Scientific Reports | (2021) 11:2116 | https://doi.org/10.1038/s41598-021-81533-9 8
Vol:.(1234567890)www.nature.com/scientificreports/
Figure 7. Misreporting the outer flanker as the target in “Experiment 2”. (A,B) Distribution of reports around
the value of each flanker (0) for the (A) two-flanker and (B) four-flanker conditions, along with the fitting (solid
lines) of the two-misreport and the four-misreport models respectively. (C,D) Reporting rates for each item in
the two-flanker (C) and four-flanker (D) conditions. Flanker report rates are the fitted independent β to each
flanker in the two-misreport (C) and the four-misreport (D) models. 3I 3rd Inner flanker, 2I 2nd Inner flanker,
1I 1st Inner flanker, T target, 1O 1st outer flanker. Error bars are within subject ± 1 SEM.
(“Experiment 2”), crowding was stronger than when the central target was flanked by two outer flankers (“Experi-
ment 1”), t(25) = 2.40, p = 0.024, Cohen’s d = 0.92 (see54 for a similar finding). Although the four-flanker condi-
tion in “Experiment 2” might involve a higher degree of uncertainty compared to the four-flanker condition
in “Experiment 1”, the fact that observers misreported the adjacent outer flanker here too is consist with the
observed findings in “Experiment 1”. Finally, no differences were observed for σ between “Experiment 1” and
“Experiment 2”, with t-values bigger than 0.30 in each crowding condition.
Discussion
Using an orientation estimation task and probabilistic models designed to assess the contribution of each flanker
to crowding errors, we showed that the hallmark inner-outer asymmetry in crowding reflects misreports of the
outer flanker as the target. First, as in previous studies17,42,49, our results showed that orientation crowding errors
reflect reporting a flanker instead of the target (misreport errors). Second, we found that in a radial crowding
display (“Experiment 1”), in which a target is flanked on both sides, the misreport rate of the outer flanker was
significantly higher compared with the misreport rate of the inner one. Third, when two flankers appeared on
each side of the target (four-flanker condition), the misreport rate of the outer flanker adjacent to the target was
higher than the misreport rate of the most eccentric flanker. Finally, when the target was the outer item (“Experi-
ment 2”, two-flanker condition) crowding errors were substantially reduced.
Our misreport mixture models provide a stochastic approximation of previously proposed population coding
models37,40,49. These models explain crowding by a weighted summation of population coding within a receptive
field. These models rely on an integration process, and hence they can be considered pooling models48. Here,
the misreport model with independent flanker components outperformed models with either no misreport
component or a single misreport component to all flankers. Thus, our modeling explains misreport errors due
to pooling over feature representations.
Scientific Reports | (2021) 11:2116 | https://doi.org/10.1038/s41598-021-81533-9 9
Vol.:(0123456789)www.nature.com/scientificreports/
Simple pooling models of crowding predict averaging of target and flanker f eatures36,39. Within the context
of the inner–outer asymmetry, simple pooling models assert weighted average with more weight to the outer
flanker and, therefore, predict mean bias towards the outer flanker32. Here, we show that adding a mean bias as a
free parameter to the misreport model does not improve model fitting. This finding is inconsistent with previous
accounts that suggests that crowding errors reflect a combination of misreport and averaging e rrors41,50. Our
study, therefore, supports a single pooling mechanism account of crowding.
Importantly, our results show that the inner-outer asymmetry can be explained by a weighted summation in
which the peripheral (outer) item receives heavier weight than the foveal (inner) item. In terms of population
coding models, heavier weight over the peripheral item perhaps can be implemented by assuming that sum-
mation weights scale with receptive field size, such that heavier weights are assigned to more peripheral items
(larger receptive field). A similar principle was proposed with a Bayesian inference framework and with some
assumption regarding the growth of receptive field size in the visual p eriphery26. In particular, the number of
receptive fields that cover only the outer item is larger than the number of receptive fields that cover only the
inner item. Here we suggest that larger receptive fields in the periphery render errors towards the outer flanker.
Our results are inconsistent with the cortical magnification account. According to this view, crowding asym-
metry results from cortical mapping in which the outer flanker is closer to the target than the inner one6,35. This
explanation predicts that within the same display (i.e. same cortical distances), crowding interference will be
the same regardless of whether observers are reporting on the middle or the outer item. Thus, the reduction of
crowding interference in the two-flanker condition of “Experiment 2” compared to “Experiment 1” suggests that
cortical magnification alone is insufficient to explain the inner-outer asymmetry of c rowding26.
In this study we investigated the inner-outer asymmetry along the horizontal meridian by using a sym-
metrical display. Although previous studies found the asymmetry effect along the horizontal, but not along the
vertical meridian23, it is still unclear whether and how this effect is reflected in a typical symmetrical crowding
display across the visual field. Furthermore, our results are limited to orientation errors involved in crowding
asymmetry. Since recent studies found dissociation of crowding errors across dimensions, such as orientation,
color and spatial f requency49, and between color and m otion55, further work is needed to determine whether the
current findings apply to other feature dimensions. Moreover, the use of Gabor patches also limited our ability
to distinguish between object level and feature level. Due to previous studies that pointed to different processes
involved at these levels33,49,56, further work should use a different type of stimulus, which would allow a clear
distinction between those levels. Finally, this study does not directly test the predictions of simple pooling models
of crowding, which predict averaging. Future studies should compare the weighted summations (misreport)
model, as proposed here, with weighted averaging models to reconcile between the different pooling models.
Conclusions
Our findings reveal that in a typical radial crowding display, observers confuse the target with the nearby outer
flanker, but not vice versa. This confusion occurs regardless of the number of flankers and reported item position.
Probabilistic mixture models explain that these results as due to heavier weights toward the visual periphery.
These findings are consistent with recent models that explain crowding in terms of population coding with
weighted summation within receptive fields. Our results demonstrate a counterintuitive phenomenon: within a
region of selection, the more eccentric item dominates appearance.
Data availability
The data and analysis codes are available via the Open Science Framework and can be accessed at https://osf.
io/pvknd/.
Received: 7 June 2020; Accepted: 5 January 2021
References
1. Bouma, H. Interaction effects in parafoveal letter recognition. Nature 226, 177–178 (1970).
2. Lev, M., Yehezkel, O. & Polat, U. Uncovering foveal crowding? Sci. Rep. 4, 4067 (2014).
3. Whitney, D. & Levi, D. M. Visual crowding: A fundamental limit on conscious perception and object recognition. Trends Cogn.
Sci. 15, 160–168 (2011).
4. Levi, D. M. Crowding-An essential bottleneck for object recognition: A mini-review. Vis. Res. 48, 635–654 (2008).
5. Pelli, D. G. & Tillman, K. A. The uncrowded window of object recognition. Nat. Neurosci. 11, 1129–1135 (2008).
6. Pelli, D. G., Palomares, M. & Majaj, N. J. Crowding is unlike ordinary masking: Distinguishing feature integration from detection.
J. Vis. 4, 1136–1169 (2004).
7. Liu, R., Patel, B. N. & Kwon, M. Y. Age-related changes in crowding and reading speed. Sci. Rep. 7, 8271 (2017).
8. Louie, E. G., Bressler, D. W. & Whitney, D. Holistic crowding: Selective interference between configural representations of faces
in crowded scenes. J. Vis. 7, 1–11 (2007).
9. Harrison, W. J., Mattingley, J. B. & Remington, R. W. Eye movement targets are released from visual crowding. J. Neurosci. 33,
2927–2933 (2013).
10. Yildirim, F., Meyer, V. & Cornelissen, F. W. Eyes on crowding: Crowding is preserved when responding by eye and similarly affects
identity and position accuracy. J. Vis. 15, 1–14 (2015).
11. Wallace, J. M., Chung, S. T. L. & Tjan, B. S. Object crowding in age-related macular degeneration. J. Vis. 17, 1–13 (2017).
12. Bonneh, Y. S., Sagi, D. & Polat, U. Spatial and temporal crowding in amblyopia. Vis. Res. 47, 1950–1962 (2007).
13. Lev, M. & Polat, U. Space and time in masking and crowding. J. Vis. 15, 1–25 (2015).
14. Tripathy, S. P. & Cavanagh, P. The extent of crowding in peripheral vision does not scale with target size. Vision Res. 42, 2357–2369
(2002).
15. Petrov, Y., Popple, A. V. & McKee, S. P. Crowding and surround suppression: Not to be confused. J. Vis. 7, 1–9 (2007).
Scientific Reports | (2021) 11:2116 | https://doi.org/10.1038/s41598-021-81533-9 10
Vol:.(1234567890)www.nature.com/scientificreports/
16. Ronconi, L., Bertoni, S. & Bellacosa Marotti, R. The neural origins of visual crowding as revealed by event-related potentials and
oscillatory dynamics. Cortex 79, 87–98 (2016).
17. Easter, E. F., Klee, D. & Awh, E. Visual crowding cannot be wholly explained by feature pooling. J. Exp. Psychol. Hum. Percept.
Perform. 40, 1022–1033 (2014).
18. Nandy, A. S. & Tjan, B. S. Saccade-confounded image statistics explain visual crowding. Nat. Neurosci. 15, 463–469 (2012).
19. Freeman, J. & Simoncelli, E. P. Metamers of the ventral stream. Nat. Neurosci. 14, 1195–1201 (2011).
20. He, D., Wang, Y. & Fang, F. The critical role of V2 population receptive fields in visual orientation crowding. Curr. Biol. 29,
2229–2236 (2019).
21. Pelli, D. G. Crowding: A cortical constraint on object recognition. Curr. Opin. Neurobiol. 18, 445–451 (2008).
22. Petrov, Y. & Meleshkevich, O. Locus of spatial attention determines inward-outward anisotropy in crowding. J. Vis. 11, 1–11 (2011).
23. Petrov, Y. & Meleshkevich, O. Asymmetries and idiosyncratic hot spots in crowding. Vision Res. 51, 1117–1123 (2011).
24. Intriligator, J. & Cavanagh, P. The spatial resolution of visual attention. Cogn. Psychol. 43, 171–216 (2001).
25. He, S., Cavanagh, P. & Intriligator, J. Attentional resolution and the locus of visual awareness. Nature 383, 334–337 (1996).
26. Dayan, P. & Solomon, J. A. Selective bayes: Attentional load and crowding. Vision Res. 50, 2248–2260 (2010).
27. Farzin, F., Rivera, S. M. & Whitney, D. Holistic crowding of Mooney faces. J. Vis. 9, 1–15 (2009).
28. Bays, P. M., Catalao, R. F. G. & Husain, M. The precision of visual working memory is set by allocation of a shared resource. J. Vis.
9, 7–7 (2009).
29. Bouma, H. Visual interference in the parafoveal recognition of initial and final letters of words. Vis. Res. 13, 767–782 (1973).
30. Chaney, W., Fischer, J. & Whitney, D. The hierarchical sparse selection model of visual crowding. Front. Integr. Neurosci. 8, 1–11
(2014).
31. Chastain, G. & Lawson, L. Identification asymmetry of parafoveal stimulus pairs. Percept. Psychophys. 26, 363–368 (1979).
32. Dakin, S. C., Cass, J., Greenwood, J. A. & Bex, P. J. Probabilistic, positional averaging predicts object-level crowding effects with
letter-like stimuli. J. Vis. 10, 1–16 (2010).
33. Strasburger, H. & Malania, M. Source confusion is a major cause of crowding. J. Vis. 13, 1–20 (2013).
34. Banks, W. P., Bachrach, K. M. & Larson, D. W. The asymmetry of lateral interference in visual letter identification. Percept. Psy-
chophys. 22, 232–240 (1977).
35. Motter, B. C. & Simoni, D. A. The roles of cortical image separation and size in active visual search performance. J. Vis. 7, 1–15
(2007).
36. Greenwood, J. A., Bex, P. J. & Dakin, S. C. Positional averaging explains crowding with letter-like stimuli. Proc. Natl. Acad. Sci. U.
S. A. 106, 13130–13135 (2009).
37. Harrison, W. J. P. J. B. A unifying model of orientation crowding in peripheral vision. Curr. Biol. 25, 3213–3219 (2015).
38. Keshvari, S. & Rosenholtz, R. Pooling of continuous features provides a unifying account of crowding. J. Vis. 16, 1–15 (2016).
39. Parkes, L., Lund, J., Angelucci, A., Solomon, J. A. & Morgan, M. Compulsory averaging of crowded orientation signals in human
vision. Nat. Neurosci. 4, 739–744 (2001).
40. Van Den Berg, R., Roerdink, J. B. T. M. & Cornelissen, F. W. A neurophysiologically plausible population code model for feature
integration explains visual crowding. PLoS Comput. Biol. 6, 2 (2010).
41. Freeman, J., Chakravarthi, R. & Pelli, D. G. Substitution and pooling in crowding. Attention Percept. Psychophys. 74, 379–396
(2012).
42. Ester, E. F., Zilber, E. & Serences, J. T. Substitution and pooling in visual crowding induced by similar and dissimilar distractors.
J. Vis. 15, 1–12 (2015).
43. Huckauf, A. & Heller, D. What various kinds of errors tell us about lateral masking effects. Vis. cogn. 9, 889–910 (2002).
44. Strasburger, H., Harvey, L. O. & Rentschler, I. Contrast thresholds for identification of numeric characters in direct and eccentric
view. Percept. Psychophys. 49, 495–508 (1991).
45. Vul, E., Hanus, D. & Kanwisher, N. Attention as inference: Selection is probabilistic; responses are all-or-none samples. J. Exp.
Psychol. Gen. 138, 546–560 (2009).
46. Chung, S. T. L. & Legge, G. E. Precision of position signals for letters. Vis. Res. 49, 1948–1960 (2009).
47. van den Berg, R., Johnson, A., Anton, A. M., Schepers, A. L. & Cornelissen, F. W. Comparing crowding in human and ideal observ-
ers. J. Vis. 12, 13–13 (2012).
48. Rosenholtz, R., Yu, D. & Keshvari, S. Challenges to pooling models of crowding: Implications for visual mechanisms. J. Vis. 19,
1-25 (2019).
49. Yashar, A., Wu, X., Chen, J. & Carrasco, M. Crowding and binding: Not all feature dimensions behave in the same way. Psychol.
Sci. 30, 1533–1546 (2019).
50. Harrison, W. J. & Bex, P. J. Visual crowding is a combination of an increase of positional uncertainty, source confusion, and featural
averaging. Sci. Rep. 7, 45551 (2017).
51. Kleiner, M., Brainard, D. H. & Pelli, D. G. What’s new in psychtoolbox-3. Perception 36, 2 (2007).
52. Suchow, J. W., Brady, T. F., Fougnie, D. & Alvarez, G. A. Modeling visual working memory with the MemToolbox. J. Vis. 13, 1–8
(2013).
53. Põder, E. Crowding with detection and coarse discrimination of simple visual features. J. Vis. 8, 1–6 (2008).
54. Van der Burg, E., Olivers, C. N. L. & Cass, J. Evolving the keys to visual crowding. J. Exp. Psychol. Hum. Percept. Perform. 43,
690–699 (2017).
55. Greenwood, J. A. & Parsons, M. J. Dissociable effects of visual crowding on the perception of color and motion. Proc. Natl. Acad.
Sci. U. S. A. 117, 8196–8202 (2020).
56. Manassi, M. & Whitney, D. Multi-level crowding and the paradox of object recognition in clutter. Curr. Biol. 28, R127–R133 (2018).
57. Strasburger, H. Seven myths on crowding and peripheral vision. Iperception. 11, (2020).
58. Martelli, M., Di Filippo, G., Spinelli, D. & Zoccolotti, P. Crowding, reading, and developmental dyslexia. J. Vis. 9, 1-18 (2009).
59. Gori, S. & Facoetti, A. How the visual aspects can be crucial in reading acquisition: The intriguing case of crowding and develop-
mental dyslexia. J. Vis. 15, 8 (2015).
60. Joo, S. J., White, A. L., Strodtman, D. J. & Yeatman, J. D. Optimizing text for an individual’s visual system: The contribution of
visual crowding to reading difficulties. Cortex 103, 291–301 (2018).
Acknowledgements
We would like to thank Hadas Nathan Gamliel for her invaluable help with data collection.
Author contributions
A.Y. conceptualized this study. A.S. collected the data. A.S. and A.Y. contributed to the research design, statistical
analysis, interpretation of the data and writing.
Funding
This work was supported by The Israel Science Foundation Grant Nos. 1980/18 (to A. Yashar).
Scientific Reports | (2021) 11:2116 | https://doi.org/10.1038/s41598-021-81533-9 11
Vol.:(0123456789)www.nature.com/scientificreports/
Competing interests
The authors declare no competing interests.
Additional information
Supplementary Information The online version contains supplementary material available at https://doi.
org/10.1038/s41598-021-81533-9.
Correspondence and requests for materials should be addressed to A.Y.
Reprints and permissions information is available at www.nature.com/reprints.
Publisher’s note Springer Nature remains neutral with regard to jurisdictional claims in published maps and
institutional affiliations.
Open Access This article is licensed under a Creative Commons Attribution 4.0 International
License, which permits use, sharing, adaptation, distribution and reproduction in any medium or
format, as long as you give appropriate credit to the original author(s) and the source, provide a link to the
Creative Commons licence, and indicate if changes were made. The images or other third party material in this
article are included in the article’s Creative Commons licence, unless indicated otherwise in a credit line to the
material. If material is not included in the article’s Creative Commons licence and your intended use is not
permitted by statutory regulation or exceeds the permitted use, you will need to obtain permission directly from
the copyright holder. To view a copy of this licence, visit http://creativecommons.org/licenses/by/4.0/.
© The Author(s) 2021
Scientific Reports | (2021) 11:2116 | https://doi.org/10.1038/s41598-021-81533-9 12
Vol:.(1234567890)You can also read