Composition of GPRS/UMTS traffic : snapshots from a live network
←
→
Page content transcription
If your browser does not render page correctly, please read the page content below

Composition of GPRS/UMTS traffic : snapshots from a
                   live network

       Philipp Svoboda1 , Fabio Ricciato2 , Eduard Hasenleithner2 , and Rene Pilz2
  1
      Vienna Univ. of Technology, Inst. of Communications and Radio-Frequency Engineering.
                              psvoboda@nt.tuwien.ac.at,
                       2
                         Telecommunications Research Center Vienna, ftw.
                         {ricciato, ehasenle, pilz}@ftw.at

         Abstract. This paper focuses on the traffic composition in a real GPRS/UMTS
         network. We present results from two datasets covering two one-week measure-
         ment periods, in December 2004 and November 2005. We show how users and
         traffic split between access technologies (GPRS and UMTS) and services, and
         present an analysis of the per-user activity at the PDP-context level.
         The results reported here provide an up-to-date view of the traffic and user ac-
         tivity in an operational 3G network. It should help those researchers interested
         in reproducing synthetic network scenarios to gain a better understanding about
         the traffic environment in a real network. Moreover, we discuss several technical-
         ities found in performing such measurements, which should be helpful to those
         researchers active in 3G monitoring.

1 Introduction

The growing popularity of 3G terminals and services has extended the coverage of
wireless Internet access to the geographic area, and 3G networks are becoming key
components of the global Internet in Europe. However the 3G penetration and service
portfolio are still in an evolutionary phase.
    The planning and operation of a real network, as well as the related research activi-
ties, are based on a set of assumptions about the traffic and the service access patterns.
In such an evolutionary environment it is therefore of key importance to perform mea-
surements campaigns, or better maintain a continuous measurement program, in order
to extract such information and track the evolution of the network environment. This
paper is meant to represent a contribution towards a better understanding of the global
traffic composition in a real 3G network. This work results from extensive traffic mon-
itoring on top of the operational 3G network of mobilkom austria AG & Co KG, the
leading mobile operator in Austria, EU. We provide an insight into the high-level com-
position of the global traffic in the network under study, for both GPRS and UMTS,
and at the same time discuss some technical issues related to traffic monitoring in 3G.
The content of this paper should be of interest to those researchers working on 3G,
and provide them with a better understanding of how the traffic environment in a real
3G network looks like. To the best of our knowledge this is the first paper reporting
measurement results about traffic composition in UMTS.
The rest of the paper is organized as follows. Section 2 introduces the monitoring
setup and describes the analysis process. Section 3 investigates on the distribution of
users and traffic between GPRS and UMTS, and the traffic per user. In Section 4 we
look at the traffic composition with respect to different services. In Section 5 we in-
spect the per-user activity at the level of PDP-contexts. In Section 6 we reference those
few available previous papers presenting similar measurements for GPRS (no paper ap-
peared so far for UMTS). Finally in Section 7 we conclude and suggest directions for
further work.

2 Monitoring setting and analysis process

The monitoring system. The development of a large-scale passive monitoring system
- including a parser for the whole protocol stack of the 3G Core Network - and its
deployment in the operational network of mobilkom austria AG & Co KG were accom-
plished within the METAWIN project [1]. Packets are captured with DAG cards and
recorded with GPS synchronized timestamps. For privacy requirements, the frames are
completely anonymized on-the-fly before being stored on the hard-disk: all subscriber-
related fields at any layer of the 3GPP protocol stack (e.g. IMSI, MSISDN, IMEI) are
hashed with a secret non-invertible function, while the user payload at the application
layer is stripped-off.

Tracking modules. The monitoring system covers both the user- and control-plane. On
each interface an on-line stateful module tracks the current TIMSI (Temporary Interna-
tional Mobile Subscriber Identifier) for each Mobile Station (MS), so each packet can
be associated to the originating MS 1 . Furthermore, the tracking module on Gb/IuPS
links tracks the MS position (i.e. cell), while the tracking module on Gn maintains sev-
eral PDP-context attributes (e.g. APN). Such tracking modules enable some forms of
analysis and traffic slicing that would not be possible based only on stateless traces.
For instance, the analysis of per-user traffic can not be based on the IP address which
is assigned dynamically. Also, the analysis of traffic for a specific class of users, e.g.
discriminated by means of the APN, would not be possible without maintaining state
for each PDP-context. The tracking procedure is prone to some limitations, for instance
“border effects” at the boundaries of the measurement window: PDP-contexts that were
activated before the start of the measurement period will not be accounted in the final
statistics, leading to a certain under-estimation and bias against long PDP-contexts. In
our data we verified that the fraction of unassigned packets (i.e. packets that are found
in the traces but can not be referred to any fully tracked PDP-context) is less than 2%
of the total packets seen durign the first day.

 1
     Note that each MS is distinguished by a local identifier obtained by hashing the real IMSI.
     This process protects the user identity, since the real IMSI is never recorded. Furthermore the
     hash function and its parameters are undisclosed to the research staff, thus preventing real-to-
     hashed IMSI mapping associations for specific MS. For sake of simplicity in this paper we
     will maintain the term “IMSI” to refer to the local MS identifier.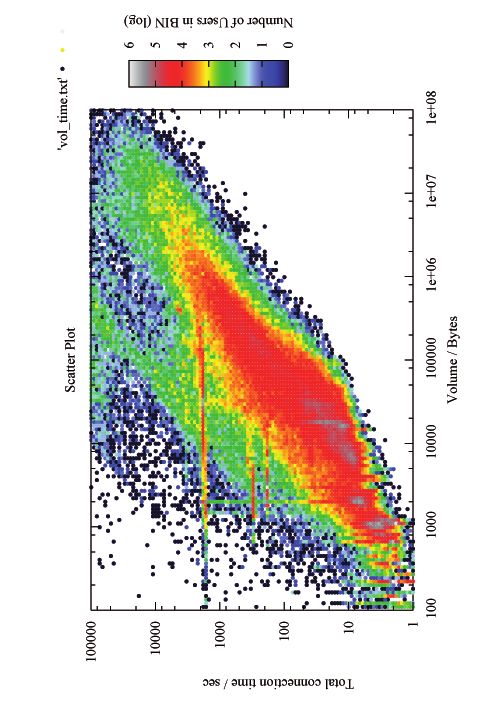
Capturing on Gn. While we passively monitor all core network interfaces (Gi, Gn,
Gb, IuPS) the results presented in this work are based exclusively on traces captured
on Gn, specifically on the links near the GGSNs. All Gn links attached to all GGSNs
were monitored, covering 100% of GPRS and UMTS traffic from home subscribers,
traffic from visiting roaming subscribers is not considered. The choice of Gn for this
type of analysis was based on the following motivations. First, capturing on Gi links
would not allow per-MS discrimination nor PDP-context analysis, since IMSIs and PDP
activations are not present on Gi. Second, complete coverage of IuPS/Gb would require
tapping more physical links. Since separate SGSNs are used for UMTS and GPRS, on
Gn it is possible to discriminate GPRS and UMTS traffic based on the IP address of the
SGSN which is found in the IP header below the GTP layer (for more details about the
3GPP protocol stack see e.g. [2, pp. 41]).

Analysis process. The analysis process works as follows. A piece of ad-hoc code parses
the entire packet trace and extracts a set of attributes for each PDP-context and for
each connection (a definition of connection for UDP is given below). The PDP-context
attributes include IMSI, start time, duration, transferred volumes (separate values for
user data and signaling and for uplink and downlink), etc. The connection attributes
include PDP-context identifier, IP addresses and ports, start time, duration, volumes,
etc.

Volumes and connections. A point of clarification is due regarding the usage of the
term “volume” and “connections”. By total volume we refer to the cumulated num-
ber of bytes at the IP layer, i.e. the GTP payload. Lower layer overhead (e.g. GTP
header and below) are not considered here. Unless differently specified the volume val-
ues given in this paper refer to the cumulated uplink and downlink traffic. Regarding
the term “connection”, in case of TCP traffic it will refer to the plain TCP connection.
For UDP traffic we define a connection as the union of all packets seen with the same
quadruple (source / destination addresses and ports) and within the same PDP-context,
with a maximum inter-packet spacing of T (we used T =10 min). This choice might be
critical when comparing the two implementation of the same service adopting different
transport protocols, e.g. WAP 1.x (over UDP) and WAP 2.0 (over TCP). We verified that
the average number of WAP connections per-user is approximately the same for both
implementations: 1.3 and 1.4 for WAP 1.x and WAP 2.0 respectively. This comforts our
definition of “connection” for UDP.

Non-disclosure policy. For proprietary reasons we can not disclose several absolute
quantitative values like traffic volumes, number of users, number of Gn links, etc. that
are considered business critical by the operator. In other words we can not disclose the
size of the user population and of the traffic aggregate but only their composition. To
comply with such policy, we provide only relative values, i.e. fractions, or re-scaled
values. In other cases we had to truncate graphs (e.g. for ranked distribution) to avoid
revealing the absolute number of users.
3 Volumes and User Population in GPRS and UMTS

As a first step we show how the total traffic and user population are split between differ-
ent services. We present results from two separate one-week periods in December 2004
and in November 2005, hereafter denoted respectively as Dec04 and Nov05 datasets.
The comparison between the two provides an insight into the historical changes in
the macroscopic traffic composition during almost one year. Attached to the 3G Core
Network there are two different Radio Access Networks (RANs), namely GPRS and
UMTS, delivering different link bandwidth (for further details see e.g. [3, pp. 23]).
Since UMTS radio deployment is more recent, the UMTS coverage is smaller than
GPRS and limited to urban and suburban areas. Note that EDGE was introduced in
August 2005, therefore the dataset Nov05 includes data traffic from EDGE terminals,
which we will account simply as “GPRS”.
    Table 1 shows the relative fractions of users and volumes found in the network for
GPRS and UMTS. Users are identified by their IMSI (see note 1 ). Note that only active
users are accounted here, i.e. with at least one PDP-context activation in the measure-
ment window. Attached but inactive users are not accounted. Note that in general UMTS
capable terminals can also access GPRS radio outside the UMTS coverage. We label as
“GPRS users” those seen exclusively on the GPRS section during the measurement pe-
riod, while those that accessed the UMTS at least once are classified as “UMTS users”.
A caveat is due here since a “UMTS user” can also generate GPRS traffic: while this
traffic is correctly accounted as GPRS, the GPRS user count in Table 1 only considers
GPRS-only users. Therefore, the average per-user traffic can not be derived from Table
1. From Table 1 it can be seen that in Dec04 the number of active UMTS users was
approximately two orders of magnitude less than GPRS, but the two groups generated
comparable traffic volumes. In fact at that time a large fraction of UTMS mobile sta-
tions were 3G datacards mounted on laptops2 coupled with flat-rate contracts, while
UMTS hand-held devices were just starting to spread among subscribers. In Nov05 the
fraction of UMTS users has increased, as the combined effect of additional UMTS sub-
scribers plus legacy GPRS users upgraded to UMTS hand-held terminals. The fact that
for UMTS the growth factor in the volume share is substantially less than for the user
share suggests that most of the new additional terminals were hand-held devices rather
than laptop datacards, under the assumption that the former ones generate less traffic
than the latter due to a combination of differences in terminal capabilities and billing
schemes. However laptop datacards are still an important subset in the UMTS terminal
population. The rough comparison between the ratios of volume to user shares antici-
pates that the average per-user traffic is larger for UMTS than GPRS. This was expected,
given that UMTS delivers a higher bandwidth and hence a better user experience than
GPRS, despite they share the same billing tariffs.
    As a next step we evaluated directly the weekly volume generated by individual
users. The per-user volume distributions for GPRS and UMTS in Nov05 are reported
in Figure 1. All values are in MB/week. Note that in these figures a single MS pro-
ducing both types of traffic (say vu and vg volumes respectively in UMTS and GPRS)
will appear as two different MSs with distinct volumes in each class (i.e., vu and vg ).
 2
     See e.g. http://www.option.com/products/3g_edge.shtml
Table 1. Fraction of users and volume in GPRS and UMTS
                                                        Dec04             Nov05
                                                   RAN   Users Volume RAN Users Volume
                                                   GPRS 98.8% 58.3% GPRS 90.7% 33.3%
                                                   UMTS 1.2% 41.7% UMTS 9.3% 66.7%

                     1                                                                      1
                                                        UMTS
                                                        GPRS                                       UMTS
                    0.8                                                                    0.8     GPRS

                                                                      Fraction of Volume
         emp CCDF

                    0.6                                                                    0.6

                    0.4                                                                    0.4

                    0.2                                                                    0.2

                     0 −4        −2            0          2
                                                                                            0 −4    −3           −2           −1    0
                     10        10            10         10                                  10     10           10           10    10
                                 Volume per User / MB                                                    Fraction of Users

                          (a) Volume per User (CDF)                 (b) Fraction of volume (y) cumulated
                                                                    by fraction of top users (x)

Fig. 1. Distribution of Volume per User in MB/week in Nov05. (The x axis is truncated to 10−4 )

Figure 1(a) reports the CCDF. It can be seen that the median is around 5.4 MB/week for
UMTS and only 43 KB/week for GPRS. The distribution spans around five orders of
magnitudes, denoting a large disparity in the user behavior. This can be seen well from
Figure 1(b), where we plot the fraction y of total volume generated by the fraction x of
top users in loglog scale. We obtain that the top 1% of UMTS users generated around
14% of total traffic, while the top 1% of GPRS users generated 52% of total traffic. For
the 10% of top users, the cumulated fraction of volume jumps to 58% for UMTS and
92% for GPRS.
The GPRS figures reveal that the vast majority of users “seen” on GPRS are generat-
ing less than 1MB/week. At the other extreme of the range are the heavy-users, who
transfer massive volumes of traffic. This suggests the possibility to classify the users
into a small set of classes, so as to distinguish sporadic, heavy and intermediate users.
In general such classification would be service-dependent, however as far as the total
network load is concerned we can ignore service-specific metrics and just consider the
total transferred volume in the measurement period. Hence we classified the users into
four groups based on arbitrarily chosen threshold values on the weekly volume v: very
low (v ≤ 10kB), low (10kB < v ≤ 1MB), medium (1 MB < v < 100 MB) and high
(v ≥ 100MB). We used the same boundary values for UMTS and GPRS. Table 2 shows
the fraction of users and volume within each group for both datasets. It can be seen
that the vast majority of users (70-90%) in GPRS have less than 1MB per week (low
and very low users), but they generate only a small fraction of the total traffic (≈3-6%).
Note that the lowest group generate a negligible amount of traffic, despite (≈25-40%)
of the users are found here. These are users that had a single or very few session (e.g.
MMS via WAP), or perhaps activated a spurious PDP-context. We also note in GPRS an
Table 2. Grouping per transferred volume (Values in fraction of total)
                                        GPRS                                     UMTS
                      Dec04     high   medium    low    very low Dec04 high    medium  low    very low
                       Users    0.1%   29.3%    29.3%    41.3%   Users 13.0%   83.3%  3.5%     0.2%
                      Volume    7.0%   89.3%    3.7%    < 0.01% Volume 61.4%   38.6% < 0.1%   < 0.01%
                      Nov05     high   medium    low    very low Nov05 high    medium  low    very low
                       Users    0.2%   11.5%    61.7%    26.6%   Users 7.6%    59.4% 28.9%     4.1%
                      Volume   24.3%   69.5%    6.2%    < 0.01% Volume 51.2%   48.5%  0.3%    < 0.01%

increase in the fraction of volume in the “high” group, from 7% to 24%: this is maybe
an indication that more laptop datacards are being used on GPRS/EDGE.
    In UMTS, we see that the “low” and “very low” groups were almost empty in Dec04
(less than 4% of users), while in Nov05 they raised to almost 33.0%. This is probably
due to the introduction of a large number of hand-held devices, while in Dec04 the
predominant terminal type was laptop datacard.

4 Service Mix

In a next step we analyzed the volume share per each service. The figures in this section
do not include custom services implemented for specific customers, which where pre-
filtered based on the APN. Also, we filtered traffic on ports tcp:135 and tcp:445, which
is used by several scanning worms (see discussion in Section 4.3). The results are pre-
sented in Figure 2 for UMTS and GPRS separately and for both datasets. In all cases
the largest volume share is on WEB. The biggest change occurred in GPRS, where the
WAP 1.0 share halved from 30% to 13%. Looking at the relative growth of volume for
each service, we found that the WAP traffic in GPRS did increase in absolute volume
(+80%), but less than other services (e.g. +339% for WEB).
     Mail (POP3 + SMTP + IMAP) grew by +170% in GPRS and +160% in UMTS.
The HTTPs service did also grow considerably on GPRS (+719%). Interestingly in
Nov05 we found 0.8% of UMTS traffic was related to a popular online game (World of
Warcraft).

4.1   Service Mix over time

Next we analyzed the stability of service shares on a day-by-day basis, limited to the
top services. Table 3 shows the fraction of volume per service accumulated within each
day. We can discriminate two different profiles for working days and for the weekend.
The WEB traffic is always dominant and its relative share increases in the weekend - in
UMTS 58-60% in working days and 65% in weekend. The share of email traffic (POP3
and SMTP) decreases in the weekend (in UMTS it roughly halves). We also notice a
decrease of “Rest UDP” (which includes tunneled traffic, e.g. IPSEC) and VPN. The
most likely explication is that this traffic is related to business people that tend not to use
their mobile access on weekends. We observe that the WAP share in GPRS is relatively
stable across all days.
Regarding the usage of e-mail it is interesting to note that GPRS and UMTS display
different levels of asymmetry: the ratio of email downloads (POP3+IMAP volume) to
(a) GPRS Dec04 (b) GPRS Nov05
(c) UMTS Dec04 (d) UMTS Nov05
Fig. 2. Service Shares for UMTS and GPRS
Table 3. Daily service shares - GPRS / UMTS Nov05
UMTS GPRS
Service Mon Tue Wed Thu Fri Sat Sun Mon Tue Wed Thu Fri Sat Sun
HTTP 58.5 60.2 58.1 59.1 59.4 65.6 64.5 50.2 49.7 48.0 48.7 49.3 54.6 55.2
HTTPs 4.9 4.7 4.8 4.5 4.4 3.5 3.7 5.1 4.9 5.0 5.1 4.8 3.6 3.6
POP3 4.7 4.5 4.9 5.0 4.4 2.4 2.5 5.5 5.3 5.5 5.9 5.4 3.3 3.1
SMTP 2.1 2.6 2.5 2.2 2.0 1.1 1.5 2.1 2.2 2.3 2.2 2.0 1.4 1.9
WAP 1.x 1.5 1.4 1.4 1.6 1.5 1.4 1.2 13.9 13.4 13.4 13.6 14.3 14.4 13.1
WAP 2.0 0.0 0.0 0.0 0.0 0.0 0.0 0.0 5.4 5.6 5.5 5.5 5.4 5.5 5.5
FTP 1.6 0.9 1.8 1.7 4.0 0.3 0.4 0.6 0.8 1.4 1.0 0.7 0.6 0.4
VPN 1.4 1.0 1.3 1.4 1.1 0.9 0.6 0.9 0.7 0.6 0.8 0.8 0.4 0.6
Rest TCP 12.7 12.5 13.2 13.6 13.1 15.0 15.1 9.0 9.3 11.1 9.9 10.3 9.9 9.6
Rest UDP 12.4 12.2 11.9 10.9 10.0 9.7 10.4 7.2 8.0 7.2 7.1 6.8 6.3 6.3
email sending (SMTP volume) is on average 2.8 for GPRS and 2.1 for UMTS. This can
be accounted to the smaller uplink bandwidth in GPRS (21.4 kbit/s) and consequently
relatively long transfer times which refrain the users from massive email sending.
Network-planning departments often refer to the busy hour to dimension their net-
works. To answer the question if the weekly traffic share can also be used to adjust
traffic shares in a busy hour simulation, we split the traffic further into bins of two
hours. The results for two sample days are presented in Figure 3 (note that the y axis
has been rescaled by an undisclosed factor in order not to disclose absolute volumes).
The shape of the curves shows the busy hour between 7 p.m and 9 p.m. The inspec-
tion of the volume shares for each bin reveals that the traffic composition is relatively
stable with the time-of-day in the range 10 am to 9 pm, with fluctuations within 5%(a) UMTS Nov05 (b) GPRS Nov05
Fig. 3. Time of day effect in Nov05 (The y axis have been renormalized - see text)
Table 4. Grouping customers per used Services (Values in fraction of total)
GPRS UMTS
Usage: WAP only WAP and Mail Internet Usage: WAP only WAP and Mail Internet
Dec04 89.3% 9.3% 1.4% Dec04 0.1% 1.4% 98.5%
Nov05 82.5% 5.5% 12.0% Nov05 25.0% 1.6% 73.4%
(note that during the night the traffic level is very low and some service disappear com-
pletely). We conclude that the daily volume statistics are representative of the peak hour
composition.
4.2 Grouping per Service
We now grouped the users according to the services they used. Following [4] we defined
the following three groups: WAP only, WAP and Mail and Internet Services (no WAP).
Table 4 shows the relative numbers of users in each of the three groups for GPRS and
UMTS in Dec04 and Nov05. The first group represents the vast majority in GPRS, users
who only use a mobile phone to browse WAP pages, download ring tones, send MMS
via WAP and so on. In Nov05 [resp. Dec04] these are 80% of the GPRS users [resp.
90%], but only generate 20% [resp. 37%] of the total traffic. This group accounted for
0.1% of the UMTS users in Dec04, but in Nov05 they raised to one quarter of the
total UMTS population (despite still the share of WAP in around 1% in UMTS). This
is consistent with the notation made above, that in Dec04 most users active on UMTS
were laptop datacard users.
The second group is able to browse WAP, transfer e-mails but does not have WEB
traffic.
In the last group there is no WAP traffic and mainly WEB volumes. This includes the
mobile offices, users who use their notebook or smart-phones for accessing the internet
outside their company. This group grew in GPRS (from 1.4% to 12%), bearing the
whole WEB traffic (50% of total). Note that the GPRS numbers for Dec04 are consistent
with the result presented in [4] on a different mobile provider.
Notably, the combined growth of the “Internet” group in GPRS and “WAP only”
in UMTS results in the two user populations being less distant now than one year ago.
This is also confirmed from the reduced differences between UMTS and GPRS in the
total service shares (Figure 2). It is possible to conjecture that the introduction of EDGEin GPRS and the ongoing replacement of handheld terminals towards UMTS-capable
devices are probably the driving forces behind such convergence.
4.3 Filtering spurious connections
During the explorative analysis a large number of packets were directed to ports tcp:135
and tcp:445, mainly TCP SYN in the uplink direction. This is due to some self-propagating
worms attached to some infected 3G terminals. The presence of such unwanted traffic
should be expected since laptops with 3G datacards - often equipped with popular op-
erating systems - coexist nowadays with handsets and smart-phones in the 3G network,
and it is well-known that unwanted traffic is a steady component of the traffic in the
wired networks since years (see for instance [5]). The detailed analysis of unwanted
traffic and its impact on the 3G network will be covered in a following separate paper.
Here is important that such traffic does not express user preference, and therefore we
filtered it out before the analysis. The filtering rules were set heuristically as follows.
For TCP we filtered out all connections with less than 2 packets in each directions (i.e.,
complete handshake plus one data packet). For UDP we filtered out all connections with
less than 1 packet in each direction. The fraction of filtered packets was 3.4% in TCP
and 2.1% in UDP in Dec04.
5 Analysis of the PDP-context activity
In this section we investigated the activity of each user at the level of PDP-contexts. The
PDP-context in a GPRS/UMTS network is comparable to a dial-up process in wired
networks: a user has to establish a PDP-context to transfer data via a mobile network
(for a detailed list see [6]). For this analysis we considered the Nov05 dataset.
5.1 Per-user activity
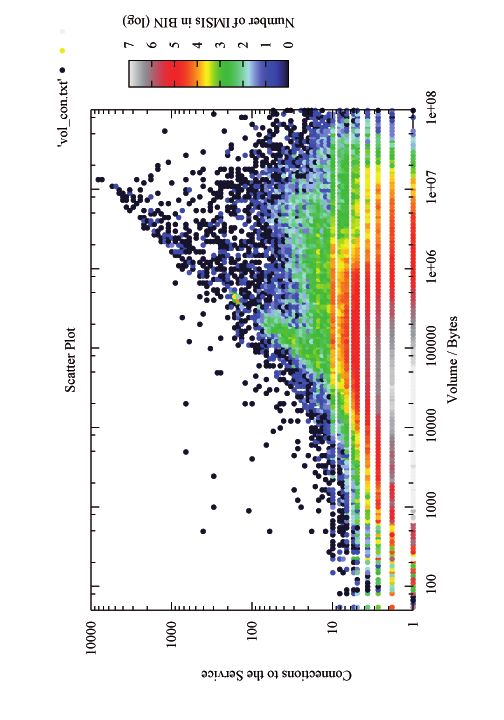
For each PDP-context j generated by MS i we extracted the total volume vji and
the duration dji . For each MS i, we considered the following Pni attributes: total num-
ber ni of PDP-contexts, total transferred volume si = j=1 vji and total on-time
Pni
ti = j=1 dji . The Figure 4 shows scatter plots of these three attributes with logarith-
mic binning, splitted to UMTS and GPRS. Each point represents the number of users
i within the loglog binning. In all plots there are boundaries due to admissible regions.
The limit in Figure 4(a) and 4(d) relates to the presence of a minimum value for the
duration of a PDP-context, say dmin , which forces a user with ni PDP-context to stay
on-line for at least si ≥ ni × dmin . We obtain that in this case GPRS and UMTS have
a similar footprint. In the Figures 4(b) and 4(e) the distribution is lower limited by the
maximum available bandwidth (cumulated uplink and downlink), which is 384 kbit/s
and 85.6 kbit/s for UMTS and respectively for GPRS. The slope of the lower boundary
of the distribution approaches this values (320 kbit/s and 80.1 kbit/s), the difference
being due to idle periods within each PDP-context.As expected the large cluster for
UMTS (Figure 4(b)) is shifted to the right compared to GPRS (Figure 4(e)), due to the
higher bandwidth. The upper limit is due to the presence of a time-out for long inactive’vol_time.txt’ ’vol_con.txt’
Scatter Plot Scatter Plot
100000 100000
Number of Users in BIN (log)
Number of IMSIs in BIN (log)
6 7
5 10000 6
10000
Connections to the Service
Total connection time / sec
5
4
4
3
1000 3
2
2
1000
1 1
0 100 0
100
10
10 1
1000 10000 100000 1e+06 1e+07 1e+08 1e+09 100 1000 10000 100000 1e+06 1e+07 1e+08
Volume / Bytes Volume / Bytes
(a) ti vs. ni (b) ti vs. si (c) ni vs. si
(d) ti vs. ni (e) ti vs. si (f) ni vs. si
Fig. 4. Logaritmic Scatter Plots of per-MS activity attributes: Number of PPD-Contexts, Total
ON-time and Total Volume for UMTS (upper row) and GPRS (lower row).
PDP-contexts.
In GPRS, for ni > 200 there is a linear cluster, with an average PDP-context duration
around 12 sec. The same cluster is also visible in Figure 4(f), indicating a constant size
of the transferred volume within each PDP-context (around 1.7 kbytes). This is likely a
cluster of automatic services, with periodic activation of short PDP-contexts. Note that
for UMTS only very few MS yield more than 200 PDP-contexts in the measurement
window.
Despite the MSs with ni > 200 are a minor part of the total population (less than 0.1%),
they generate a considerable fraction of all PDP-contexts (6.4% in UMTS and 33.6%
in GPRS), accounting for ≈3% of the total volume. Interestingly 22.8% of the UMTS-
users and 37.8% of the GPRS-users had only one PDP-context within the observation
period. This indicates that our measurement period was too small for the low frequency
caused by sporadic users.
5.2 Distribution of PDP-context duration
Based on the high dispersion of ni revealed by Figure 5, we know that a simple PDF of
dji would be biased by those few users with a very high number of PDP-contexts. These
are likely due to automatic periodic access to some custom service, with an intrinsically
different behavior from other users. We therefore decided to classify the users into two
main groups based on the total number of PDP-contexts and an arbitrary boundary
value set to ni =200. The CDF of the PDP-context duration for each group is shown in
Figure 5. The curves for the group with ni ≤ 200 fit Weibull functions with parameters
(188.5; 0.37) for GPRS and (936.0; 0.49) for UMTS. Note that the duration of PDP-
contexts is larger in UMTS than in GPRS. For the group with ni >200 the curves
show strong discrete steps, which is consistent with the hypothesis of automatically1
0.8
emp. CDF
0.6
0.4 d (n ≤200)
i i UMTS
d (n >200)
i i UMTS
d (n ≤200)
0.2 i i GPRS
d (n >200)
i i GPRS
0
0 200 400 600 800 1000
Duration of PDP−context / sec
Fig. 5. Empirical CDF of PDP-context Duration
generated procedures. In those applications where it is required to reproduce traffic
patterns from this sub-population it might be useful to have a closed form representation
of the empirical distribution. This can be approximated by a combination of discrete
steps and a fitted curve of the residual PDP-contexts, with parameters extracted from
the measurements. However we remark that such patterns are highly service-specific,
and highly volatile due to the relative small number of involved MSs: for instance the
introduction of a new service or simply a parameter change (e.g. a time-out) can have a
major impact on the overall PDP-context pattern.
6 Related works
Regarding the service shares there are several papers showing results from measure-
ments in mobile networks, but they are limited to GPRS. In [4] and [7] traffic on the
Gn interface was recorded. The dataset was correlated with RADIUS messages to eval-
uate the service usage in the GPRS network at the PDP-context level. The observation
periods were respectively 32 and 24 days recorded by a mobile operator in Hungary in
beginning 2004. The results presented there show a smaller share of WEB traffic, likely
due to the absence of laptop datacards at that time. In [8] more recent data is presented
(end 2004). The recorded interface was Gb. The observation period was from 11 a.m
to 4 p.m. on ten consecutive days. There are results for the fraction of volumes trans-
ferred with UDP and TCP, which match with our records, but no detailed information
on the volume per service. There are also older publications covering certain specific
services, mainly WAP (e.g. [9], [10]). The only other work presenting statistics about
PDP-contexts in GPRS was the technical report [4]. To the best of our knowledge no
previous paper so far has reported measurement results about the traffic composition in
a real UMTS network.
7 Conclusions and Future Work
In this paper we have presented measurement results from an operational GPRS/UMTS
network. We provided insight into aspects like traffic composition, per-user traffic dis-
tribution and per-user activity at the PDP-context level. We found that the global trafficcomposition is relatively stable on a daily basis, with some moderate differences be-
tween weekends and working days. We found a large variability in the weekly traffic
per user, with distributions spanning five orders of magnitude and most of the volume
concentrated on a small fraction of heavy-users. The inspection of the per-user activity
at the PDP-context level held similar findings: the total user on-time spans several or-
ders of magnitude. In GPRS most of the PDP-contexts are generated by a minor fraction
of terminals, likely automated terminals with periodic PDP-context activations.
These aspects should be carefully considered when trying to reproduce syntheti-
cally the network-wide environment. More specifically, they challenge the practicality
of adopting the concept of a representative “average user” in synthetic simulations.
In this work we have moved the first steps to wards the classification of separate user
groups, based on the degree of activity and of the accessed services. In the continuation
of this work we will try to zoom-in on the user behavior of some specific classes of
users. For instance, based on our traces it would be interesting to directly compare the
patterns of WEB traffic found in the 3G network with those found in the wired Internet
(e.g. following the procedure developed in [11]).
The ongoing refinement of the monitoring system will soon make it possible the
direct discrimination of the terminal type (laptop datacards, smart-phones, etc. ) based
on the the TAC code included in the IMEI identifier. This will allow the exact analysis
of traffic based on terminal type.
References
1. METAWIN Project. http://www.ftw.at/ftw/research/projects/. FTW.
2. Gunnar Heine. GPRS - signaling & protocol analysis. Inacon, 2002.
3. H. Holma and A. Toskala. Wcdma for umts, radio access for third generation mobile com-
munications, third edition. John Wiley & Sons, Ltd., 2004.
4. Kaldena, Varga, Woutersc, and Sandersd. Wireless service usage and traffic characteristics
in gprs networks. Technical report, Technical Report Vodafone, 2004.
5. R. Pang et al. Characteristics of Internet Background Radiation. Proc. of the International
Measurements Conference (IMC’04), Taormina, Sicily, Italy., October 2004.
6. TS 23.060. General Packet Radio Service (GPRS), Service description. ETSI/3GPP.
7. T. Varga, H. Bert, and B. Sanders. Analysis and modelling of wap traffic in gprs networks.
ITCSS 04 Antwerpen, pages 122–129, 2004.
8. H. Dahmouni, D. Rosse, B. Morin, and S. Vaton. Impact of traffic composition on gprs
performance. ITC 19th, pages 1405–1409, 2005.
9. P. Stuckmann and H. Finck. A wap traffic model and its appliance for the performance
analysis of wap over gprs. Proceedings of the IEEE International Conference on Third
Generation Wireless and Beyond, pages 338–343, June 2001.
10. P. Stuckmann and C. Hoymann. Performance evaluation of wap-based applications over gprs.
Communications, 2002. ICC 2002. IEEE International Conference, 5:3356–3360, 2002.
11. A. Bianco et al. Web user session characterization via clustering techniques. IEEE GLOBE-
COM, 2005.You can also read