ISIS EXPORT GATEWAY TO GLOBAL CRUDE OIL MARKETS
←
→
Page content transcription
If your browser does not render page correctly, please read the page content below
ISIS EXPORT GATEWAY TO GLOBAL CRUDE OIL MARKETS
                                   George KIOURKTSOGLOU*
                       Visiting Lecturer, University of Greenwich, London

                                     Dr Alec D COUTROUBIS
                      Principal Lecturer, University of Greenwich, London

Abstract
The Islamic State of Iraq and Syria (ISIS) began to take over oil fields in late spring 2014.
Since then, ISIS has expanded its operations by creating a loosely integrated and thriving
black economy, consisting of approximately sixty percent of Syria's oil assets and seven
oil producing assets in Iraq. The terrorist organisation has also managed to set up an
extensive network of middlemen in neighbouring territories and countries, with the aim of
trading crude oil for cash and in kind. Upon extraction, the commodity is first lightly
refined on site and then a shadow supply-chain network takes over, to bring it to the
market.
Are there any oil terminals in the South-East Mediterranean Sea used by ISIS and its
shadow network as export gateways for smuggled crude? We answer this question by
tapping into the proxy indicator of tanker charter rates. First, we look at the map for crude
oil loading terminals that geographically fall within, or border the sphere of ISIS control.
Second, for the ‘suspect’ terminals we take a closer look at the charter rates of tankers
over a period of years, seeking to establish patterns. Third, looking for ‘suspect’ pattern-
breaking charter rates, we narrow the time-frame down to the period from July 2014,
when ISIS started off its smuggling operations, until mid-February 2015.
We conclude by offering remarks on the illicit trade, while providing insights into the
criminal practices of ISIS.

Keywords: ISIS, crude oil port-terminals, smuggling, charter rates.

* Author for correspondence at george_kiourktsoglou@yahoo.com

                                                      1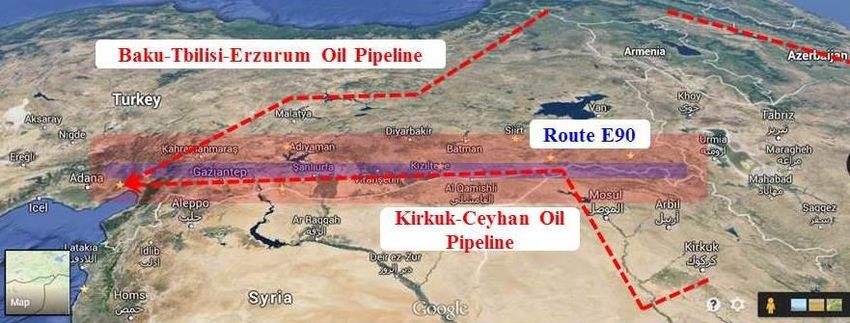
1.     Introduction: The Islamic State of Iraq and Syria (ISIS)
ISIS is a terrorist organisation. It is based in the Middle East and its stated goal is to
create a caliphate that will merge parts of Iraq, Syria and Lebanon into one Islamic state-
entity. At its inception, ISIS was a motley crew of Sunni fighters, most of them coming
from Iraq’s local Al-Qaeda franchise and Saddam Hussein’s die-hard republican army.
Head of the organisation is Abu Bakr al-Baghdadi, a well-known to the West terrorist
with a background in Iraq’s insurgency against the U.S. led coalition forces (New York
Times 2014 I).
ISIS began to morph into a proto-state by taking advantage of Syria’s civil war. Its capital
is Raqqa, located on the north bank of the Euphrates River about 160 kilometres east of
Aleppo. It is infamous for its brutality, which manifests itself, not least, through
beheadings, rape, throwing of homosexuals off the roofs of tall buildings, enslavement of
women and trafficking of children as sex-workers. Muslims are not exempt from
brutalities, a fact that in February 2014 led Al Qaeda to distance itself from its new blood-
brethren. Its practices of proselytization include the deft use of social media like
Facebook, YouTube and Twitter. In this way, the terrorist organisation has spread its
tentacles all over the globe, acting like a magnet for young aspiring jihadists. At the time
of writing of this paper, ISIS boasts 3,000 foreign fighters from all over the world (New
York Times 2014 II).
In the summer 2014, the international community started to react more forcefully against
ISIS. On the social media front, propaganda videos were taken down and as a step further
in the same direction, monitoring of material posted for reasons of proselytization became
an entrenched standard practice (The Heritage Foundation 2015). In the physical world, a
campaign of air bombardments, with the U.S. taking the lead, managed to slow down the
precipitous development of ISIS ground troops. However, the single most important event
that played the major role in the effort to mount effective resistance against the sweeping
scourge was the awakening of Iraqi tribes that took the initiative and came together to
fight the Islamic State.
The caliphate financially supports itself through extortion, crime syndication, hostage
taking, trade of Syrian and Iraqi antiquities and donations. Additionally, it’s taking
advantage of hefty cashflows generated through smuggling of crude oil (CNN 2015 a).
The present study represents the effort of the authors to delve into the potential
integration of ISIS smuggled crude within the global oil markets.

2.     The Upstream Oil Business of ISIS
Contrary to the worldwide public belief that ISIS is just another group of bloodthirsty
militants, the terrorist organisation represents the next evolutionary step of Islamic
militant fundamentalism. Whereas Osama bin Laden’s brainchild, Al-Qaeda, still depends
on international donors, ISIS managed to reactivate a long sleeping black market
economy, mainly but not exclusively, over the territories it controls. At the very epicentre
of this initiative lies the shadow network of crude oil smugglers that was initially set up
three decades ago by Saddam Hussein, with the aim of working around the U.S. economic
sanctions imposed on Iraq (Interview with Correspondent Y 2014 a). The outcome has
been astonishing, given that the Caliphate’s portfolio of assets now includes sixty percent
of Syria's oil assets and seven oil producing assets in Iraq (Brookings 2014). At some

                                             2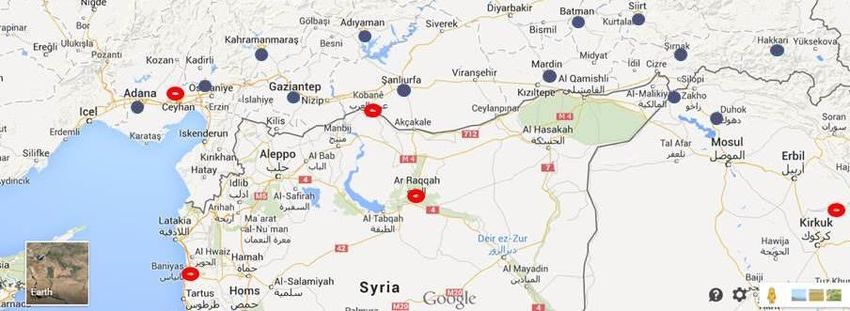
point, immediately after the launch of its crude oil venture in summer 2014, ISIS
achieved production of roughly 30,000 barrels of oil per day (CNN 2015 b). This rate has
gone up, and in February 2015 reached the mark 45,000 b/d. This is a stonking statistic
and it becomes almost baffling if one considers the fact that the commodity is being
smuggled within a war zone. Although the price of crude nosedived in the last two
quarters of 2014 (see Graph I), it is estimated that the caliphate’s cash inflows reached
levels between one and three million dollars per day (Vocativ 2014). Its key to success
was the sale of crude oil at rock-bottom prices between $60 and $25, when the price of
the commodity was correspondingly hovering around $100 and $80 per barrel. However,
it has to be mentioned that since then, the series of air raids that have been launched by
the U.S., with the support of a handful of other NATO and Gulf nations, effectively
curtailed the ISIS oil cashflows, chiefly through the destruction of oil manufacturing
facilities. An interesting point to be made is that extraction wells in the area of
bombardments have yet to be targeted by the U.S. or the air-assets of its allies, a fact that
can be readily attributed to the at times ‘toxic’ politics in the Middle East (New York
Times 2014).

                Graph I: Crude Oil Prices, (Wall Street Journal 2015)

2.1    The Geography of ISIS oil portfolio and means of oil transportation
Map I depicts the area under ISIS control (New York Times 2015). Within this vast
territory, there are a number of oil fields whose control was lost by the Syrian central
government soon after the break-out of the civil war. Most of these oil fields were assets
in the portfolio of the Al-Furat Petrolum Company, a Royal Dutch Shell affiliate. The
crude oil still produced in these oil fields is of fairly good quality, because it has low
concentration in sulphur and as such, it can be easily processed. Once pumped to the
surface, it is lightly refined either onsite in unelaborate facilities, or transported
straightaway to Turkey on truck-lorries (World Policy Blog 2014).
The tradesmen/smugglers responsible for the transportation and sale of the black gold
send convoys of up to thirty trucks to the extraction sites of the commodity. They settle
their trades with ISIS on site, encouraged by customer friendly discounts and deferred
payment schemes. In this way, crude leaves Islamic State-run wells promptly and travels

                                             3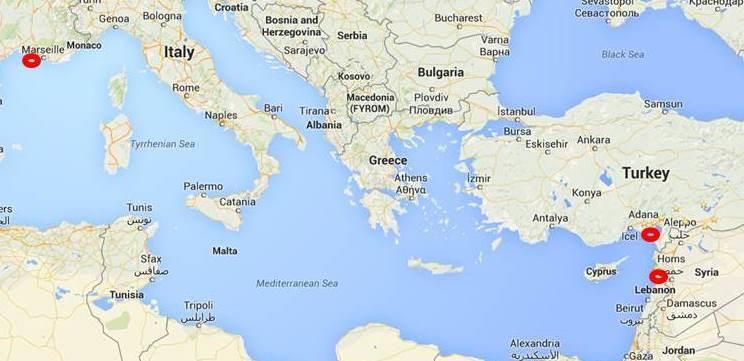
through insurgent-held parts of Syria, Iraq and Turkey, while at the same time, the
tradeflows cover local demand. ISIS also uses its oil wealth to shore up its local tribal
support-base by strengthening commercial ties with tribes in the areas under its control. It
actively urges its network to build stockpiles and allows Bedouins in the Deir al-Zor
province to tap wells, such as the Bar al Milh, al Kharata, Amra, Okash, Wadi Jureib,
Safeeh, Fahda and other extraction assets near Jebel Bushra. At least nine major tribes
have benefited out of similar regional-friendly schemes, including Iraqi ones such as the
influential Jabour tribe. As a rule of thumb, a large trailer carrying 30,000 litres of crude
can make $4,000 profit in just one journey lasting a few days (Business Insider 2014).
The result of this policy is soaring support for the caliphate.

                 Map I: ISIS controlled areas, (New York Times 2015)

As an extra measure of logistical support, the militant group allows convoys to pass more
quickly through its checkpoints. Moreover, since allied U.S. air-raids do not target the
truck lorries out of fear of provoking a backlash from locals, the transport operations are
being run efficiently, taking place most of times in broad daylight. Traders lured by high
profits are active in Syria (even in government-held territories), Iraq and south-east
Turkey. According to Correspondent X (1st and 2nd Interview 2014), in Turkey and along
the international route E90, ISIS managed to set up a string of trading hubs as depicted on
Map II. European route E 90 is an A-Class West-East route, extending from Lisbon in
Portugal in the west, to the Turkish-Iraqi border in the east. The supply chain comprises
the following localities: Sanliura, Urfa, Hakkari, Siirt, Batman, Osmaniya, Gaziantep,
Sirnak, Adana, Kahramarmaras, Adiyaman and Mardin.
The string of trading hubs ends up in Adana, home to the major tanker shipping port of
Ceyhan. In the next section 3 of the present study, the authors will try to answer the
question whether a part of ISIS smuggled crude oil is being fed into the global oil markets,
transported in tankers leaving the port of Ceyhan.

                                             4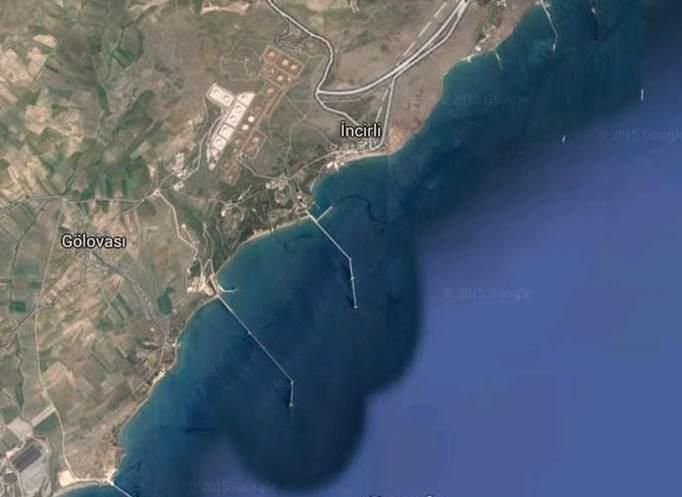
Map II: String of Smuggled Crude Trading Hubs in S.E. Turkey, (1st and 2nd
Interview with Correspondent X 2014)
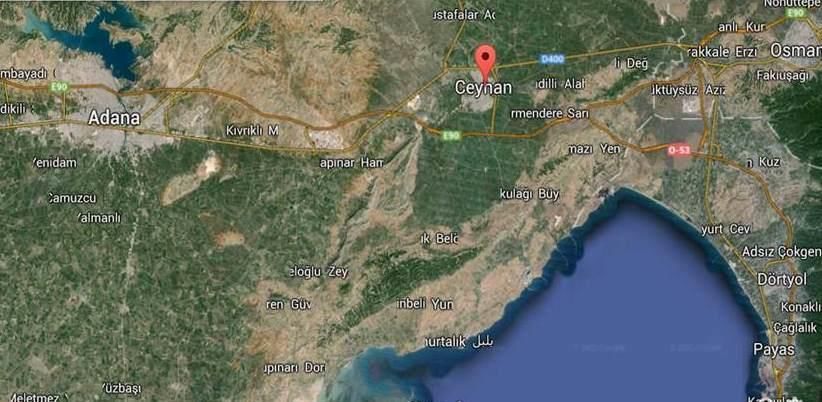
3. The Port of Ceyhan (see Map III)
Ceyhan is a city in south-eastern Turkey, with a population of 110,000 inhabitants, of
whom 105,000 live in the major metropolitan area. It is the second most developed and
most populous city of Adana Province, after the capital Adana with a population of
1,700,000. It is situated on the Ceyhan River which runs through the city and it is located
43 km east of Adana. Ceyhan is the transportation hub for Middle Eastern, Central Asian
and Russian oil and natural gas (Municipality of Ceyhan 2015). Like everywhere else on
the Turkish south-eastern Mediterranean coast, the climate is baking hot in the summer
and fairly mild in the winter.
Map III: Ceyhan via Google Maps
5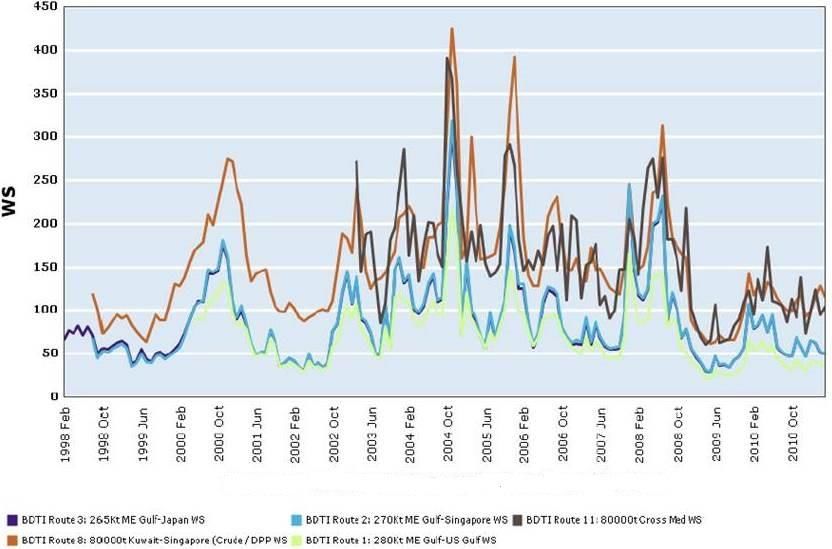
3.1    The Port Facilities (see Map IV)
The port of Ceyhan plays host to a marine oil terminal that is situated in the Turkish
Mediterranean and has been operating since 2006. It receives hydrocarbons for further
loading in tankers, which carry the commodity to world markets. The terminal is the
export gateway for crude from offshore assets in the Caspian Sea transported via the
Baku-Tbilisi-Ceyhan oil pipeline and the new pipeline - commissioned in 2013 - coming
from the Kurdish oil fields in Iraq. At times the terminal may also receive Iraqi crude via
the Kirkuk – Ceyhan pipeline (SOMO Iraqi Oil Marketing Company 2015). The terminal
covers an area of 144 hectares (1.44 sq. km) and houses a number of facilities (British
Petroleum 2015). The latter include seven crude oil storage tanks - one million barrels
each - with floating roofs, a crude export jetty - 2.6km in length - with two berths for
simultaneous loading of two tankers of up to 300,000 deadweight tonnes each, a back-up
system for monitoring and control of loading operations, six km of lines from oil storage
tanks to tanker loading area, a Volatile Organic Compounds (VOC) incineration plant, an
onsite waste water treatment plant, and accommodation facilities for management,
administration and staff. Additionally, the port features a cargo pier and an oil-terminal,
both of 23.2m depth that can load tankers of more than 500 feet in length (Ports.com
2015). The annual export capacity of the terminal runs as high as 50 million tonnes of oil.
The terminal is operated by Botas International Limited (BIL), a Turkish state company
that also operates the Baku-Tbilisi-Ceyhan pipeline on the territory of Turkey.

                     Map IV: The Port Facilities (Ports.com 2015)

                                            6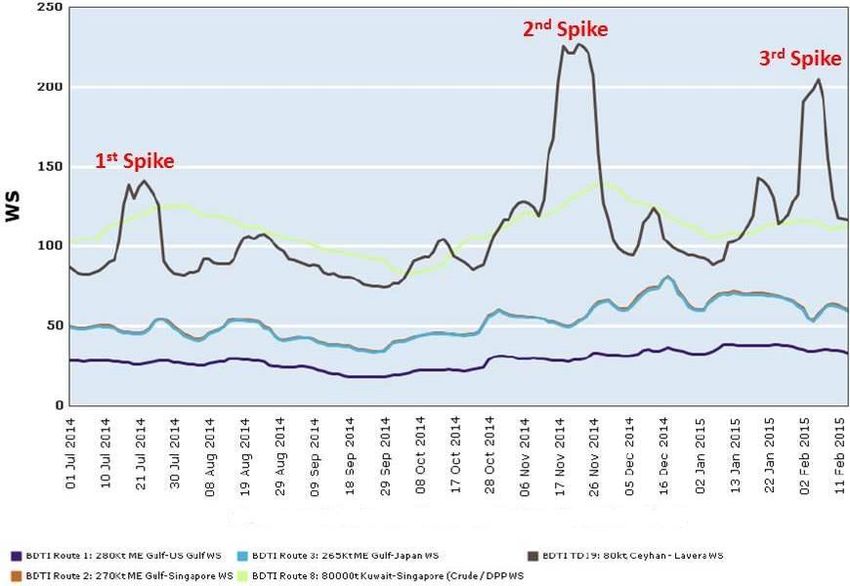
3.2    Supply Statistics (volumes of crude exported via Ceyhan)
Based on the analysis in the previous paragraph 3.1, the supply of crude to the terminal in
Ceyhan originates from three different sources (see Map V and Table I):
      1.    Offshore assets in the Caspian Sea, with crude exported via the Baku-Tbilisi-
      Ceyhan oil pipeline. In the third quarter 2014, these exports averaged 680,000 b/d
      (International Energy Association 2014 a);
      2.    Onshore assets in northern Iraq, controlled by the Kurdistan Regional
      Government (KRG), with crude exported independently of the federal Iraqi
      government via the KRG own regional pipeline, which was recently re-purposed to
      handle up to 550,000 b/d. In the third quarter 2014, these exports averaged
      approximately 200,000 b/d, with a very strong upward trend that ended up in
      December 2014 with quantities of more than 350,000 b/d. To the latter, one must
      add the quantities of crude exported by the federal Iraqi government via the same
      KRG pipeline. These quantities could average in the near future roughly 150,000
      b/d, following the deal that was struck between the KRG and the federal
      government on the 2nd of December 2014 (International Energy Association 2014
      b);
      3.    Onshore assets in northern Iraq, controlled by the federal Iraqi government,
      with crude exported via the federally-controlled pipeline to Ceyhan. In the past,
      Baghdad managed to ship up to 300,000 b/d from its northern fields, until its
      pipeline to Turkey was shut in early March 2014 due to repeated attacks by ISIS
      combatants. Since then, exports via this route have been intermittent (International
      Energy Association 2014 b).

                       Map V: Pipelines to Ceyhan via Google Maps

             Source of Crude Exports to Ceyhan                  via Pipeline   Quantity (000 b/d)

  1 Offshore assets in the Caspian Sea                      TBC                680

  2 Onshore assets in northern Iraq, controlled by the KRG new, KRG controlled btw. 350 and 500

  3 Onshore assets in northern Iraq, controlled by the FG   FG controlled      intermittent

      Table I: Pipelines to Ceyhan (International Energy Association 2014 a, b)

                                                    7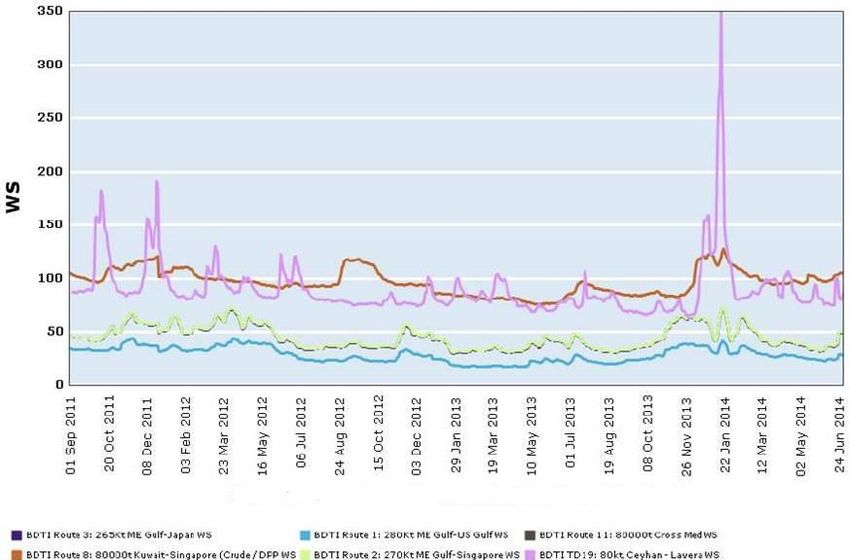
Based on Table I, it becomes obvious that the quantities of crude oil that are being
exported to the terminal in Ceyhan, exceed the mark of one million barrels per day.
Putting this number into context and given that ISIS has never been able to trade daily
more than 45,000 barrels of oil (see Section 2, ‘The Upstream Oil Business of ISIS’, page
2), it becomes evident that the detection of similar quantities of smuggled crude cannot
take place through stock-accounting methods. However, the authors of the present paper
believe that there is another proxy-indicator, far more sensitive to quantities of ultra-
cheap smuggled crude. This is the charter rates for tankers loading at Ceyhan. In the next
sub-section 3.3, the focus shifts from the supply- to the demand-side, and more
specifically to potentially sudden spikes of charter rates from Ceyhan that cannot be
explained via prevalent trends across the global crude oil market.

3.3    Tanker Charter Rates and Regression Analysis
The Baltic Exchange (2015 a) tracks the charter rates on major seaborne trading routes of
crude oil. To render its service more efficient and easily understood, it uses the system of
Baltic Dirty Tanker Indices (Baltic Exchange 2015 b). One of these indices used to be the
BDTI TD 11, 80,000 Cross Mediterranean from Baniyas, Syria to Laveras, France (see
Map VI). Route 11 was discontinued in September 2011, due to Syria’s civil war and
soon thereafter, it was replaced by BDTI TD 19 (TD19-TCE_Calculation 2015), of
exactly the same technical specifications as BDTI TD 11, with the exception of the
loading port of Ceyhan instead of Baniyas.

   Map VI: Baniyas (Syria), Ceyhan (Turkey), Laveras (France) via Google Maps

For the Middle East, the BDTI system of Baltic Exchange also includes the following
four major trading routes:
      1.   BDTI TD1: 280,000mt, Middle East Gulf to US Gulf (TD1-TCE_Calculation
      2015);

                                             8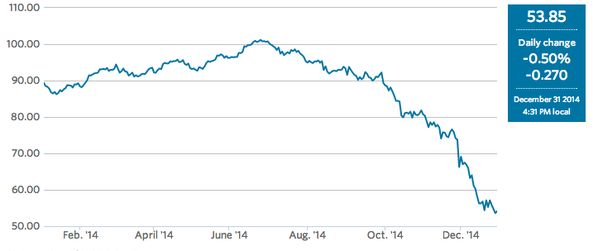
2.   BDTI TD2: 260,000mt, Middle East Gulf to Singapore;
     3.   BDTI TD3: 260,000mt, Middle East Gulf to Japan (TD3-TCE_Calculation
     2015);
     4.   BDTI TD8: 80,000mt, Crude and/or DPP Heat 135F, Kuwait to Singapore
     (TD8-TCE_Calculation 2015);
Since late 2002 and early 2003, when data on TD 11 became available, the Route has
featured a strong correlation of 58% with the previous four major trading routes from the
Middle East. (see Table II and Graph II).

   Multiple R                                                                         76%
   R Square                                                                           58%
   Adjusted R Square                                                                  58%
   Standard Error                                                                    47.2
   Observations                                                                     2,125

                                                                              Coefficients
   Intercept                                                                           36.0
   BDTI TD3: 260,000mt, Middle East Gulf to Japan (WS)                                  2.0
   BDTI TD2: 260,000mt, Middle East Gulf to Singapore (WS)                             -2.3
   BDTI TD8: 80,000mt, Crude and/or DPP Heat 135F, Kuwait to Singapore (WS)             0.4
   BDTI TD1: 280,000mt, Middle East Gulf to US Gulf (WS)                                1.3

          Table II: Regression Statistics on TD 11, (Authors’ Calculations)

     Graph II: TDI 1-2-3-8-11, (Source: Clarksons Research Services Limited)

                                              9
After September 2011, when TD 19 (from Ceyhan/Turkey to Laveras) replaced TD 11
(from Baniyas/Syria to Laveras), the former ‘decoupled’ from the four major Middle East
trading routes and its correlation with the latter fell to a meagre 22% (see Table III and
Graph III).
Multiple R 47%
R Square 22%
Adjusted R Square 21%
Standard Error 22.9
Observations 703
Coefficients
Intercept 2.3
BDTI TD3: 260,000mt, Middle East Gulf to Japan (WS) 13.6
BDTI TD2: 260,000mt, Middle East Gulf to Singapore (WS) - 13.1
BDTI TD8: 80,000mt, Crude and/or DPP Heat 135F, Kuwait to Singapore (WS) 0.8
BDTI TD1: 280,000mt, Middle East Gulf to US Gulf (WS) - 0.4
Table III: Regression Statistics on TD 19, (Authors’ Calculations)
Graph III: TDI 1-2-3-8-19, (Source: Clarksons Research Services Limited)
10However, from July 2014 when ISIS launched its crude oil venture, until February 2015,
TD 19 ‘re-coupled’, up to a certain degree, with the four major Middle East trading routes,
featuring this time a correlation of 34% (see Table IV and Graph IV).
Multiple R 58%
R Square 34%
Adjusted R Square 32%
Standard Error 29.1
Observations 161
Coefficients
Intercept - 49.0
BDTI TD3: 260,000mt, Middle East Gulf to Japan (WS) 15.9
BDTI TD2: 260,000mt, Middle East Gulf to Singapore (WS) - 17.7
BDTI TD8: 80,000mt, Crude and/or DPP Heat 135F, Kuwait to Singapore (WS) 1.2
BDTI TD1: 280,000mt, Middle East Gulf to US Gulf (WS) 4.6
Table IV: Regression Statistics on TD 19 (after July 2014), (Authors’ Calculations)
Graph IV: TDI 1-2-3-8-19 (after July 2014), (Source: Clarksons Research Services
Limited)
113.4 Spikes of Charter Rates from Ceyhan and Timeline of ISIS Activities
From July 2014 until February 2015, the curve of TD 19 features three unusual spikes
that do not match the trends featured by the rest of the Middle East trade-routes (see
Graph IV):
i. The first spike develops from the 10th of July 2014 until the 21st, lasting
approximately ten days. It coincides with the fall of Syria’s largest oil field, the Al-
Omar, in the hands of ISIS (Reuters 2014);
ii. The second spike takes place from the end of October until the end of
November 2014, lasting one month. It happens at the same time with fierce fighting
between fundamentalists and the Syrian army over the control of the Jhar and Mahr
gas fields, as well as the Hayyan gas company in the east of Homs province
(International Business Times 2014; Albawada News 214);
iii. The third spike lasts from the end of January 2015 until the 10th of February,
stretching roughly ten days. It happens simultaneously with a sustained US-led
campaign of airstrikes pounding ISIS strongholds in and around the town of Hawija
east of the oil-rich Kirkuk (Rudaw 2015);
4. Conclusions
The authors of this paper would like to make it clear from the very beginning that this has
not been the case of a ‘smoking gun’. The evidence has been inconclusive. But even if
volumes of ISIS crude found their way, beyond any reasonable doubt, to the international
crude oil markets via the Ceyhan terminal, this fact would not conclusively point to
collusion between the Turkish authorities and the shadow network of smugglers, let alone
ISIS operatives.
However, having clarified such a politically sensitive issue, the authors believe that there
are strong hints to an illicit supply chain that ships ISIS crude from Ceyhan. Primary
research points to a considerably active shadow network of crude oil smugglers and
traders (see section 2.1, page 3), who channel ISIS crude to southeast Turkey from
northeast Syria and northwest Iraq. Given the existence of Route E 90, the corresponding
transportation of oil poses no unsurmountable geographic and topological challenges.
Moreover, since the launch of the ISIS oil venture in summer 2014, tanker charter rates
from Ceyhan re-coupled up to a degree with the ones from the rest of the Middle East (see
section 3.3, page 11). This partial realignment may be attributed to additional Kurdish
crude, whose export via Ceyhan coincided with the rise of ISIS and its oil business.
Alternatively, it may be the result of boosted demand for ultra-cheap smuggled crude,
available for loading from the same port. At this point the authors cannot be categorical.
Nevertheless, primary research (Interview with Correspondent Y 2014 b) points to the
latter scenario, while making clear that the same oil traders/shippers who used to ship oil
from Baniyas, moved to Ceyhan, once Syria’s civil war brought all its seaborne trading
activities to a grinding halt.
An additional manifestation of the invisible nexus between Ceyhan and ISIS became
evident through the concurrent study of the tanker charter rates from the port and the
timeline of the terrorists’ military engagements (see section 3.4 on this page). It seems
that whenever the Islamic State is fighting in the vicinity of an area hosting oil assets, the
12exports from Ceyhan promptly spike. This may be attributed to an extra boost given to
crude oil smuggling with the aim of immediately generating additional funds, badly
needed for the supply of ammunition and military equipment. Unfortunately, in this case
too, the authors cannot be categorical.
If there is a certainty within the context of this paper and given the clear and present
danger of terrorism, it is the urgent need for further research. The focus should be on the
criminal ventures of ISIS and particularly on those that can potentially integrate it within
the global economy. As implausible as it may sound, it invokes the known adage that
‘where imagination stops, reality begins’.
Acknowledgments
Research featured in this paper would be impossible to take place without the first-hand
intelligence and crucial insights promptly provided by:
Correspondent X
Correspondent Y
Clarksons Plc
The Authors of the paper express their gratitude to all the above.
13Key Participant Interviews and References
Key Participant Interviews
1. Correspondent X, 1st Interview, online via Skype, location unknown, Date: 14
November 2014, speaking on condition of anonymity.
2. Correspondent X, 2nd Interview, online via Cisco WebEx, location unknown,
Date: 04 January 2015, speaking on condition of anonymity.
3. Correspondent Y a and b, Interview, via email, location unknown, Date: 10
December 2014, speaking on condition of anonymity
References
Analysis
1. Web Document, Analysis: Authors (2015), ‘Authors’ Calculations’, 25 February,
http://goo.gl/rbDmAf
2. Web Document, Analysis: Brookings (2014), ‘The UN Strikes Back at ISIL's
Black Economy’, 23 August, viewed 04 February 2015, http://goo.gl/J1GZ0m
3. Web Document, Analysis: International Energy Association (2015) a, ‘Oil Market
Report’, page 25, 16 January, viewed 20 February 2015, http://goo.gl/CDmRJ3
4. Web Document, Analysis: International Energy Association (2015) b, ‘Oil Market
Report’, pages 18-19, 16 January, viewed 20 February 2015, http://goo.gl/CDmRJ3
5. Web Document, Analysis: TD1-TCE_Calculation (2015), viewed 27 February
2015, http://goo.gl/v29wXm
6. Web Document, Analysis: TD3-TCE_Calculation (2015), viewed 27 February
2015, http://goo.gl/gEfj0a
7. Web Document, Analysis: TD8-TCE_Calculation (2015), viewed 27 February
2015, http://goo.gl/4mf7sg
8. Web Document, Analysis: TD19-TCE_Calculation (2015), viewed 27 February
2015, http://goo.gl/dEu9ff
Articles
1. Web Document, Article: Albawada News (2014), ‘Syrian army retakes gas fields
from ISIL’, 06 November, viewed 28 February 2015, http://goo.gl/Efa07d
2. Web Document, Article: Business Insider (2014), ‘Here's How ISIS Keeps Selling
So Much Oil Even While Being Bombed And Banned By The West’, 25 October, viewed
10 February 2015, http://goo.gl/8JWCL6
143. Web Document, Article: CNN (2015) a and b, ‘How ISIS makes (and takes)
money’, 20 February, viewed 21 February 2015, http://goo.gl/Hax4Qd
4. Web Document, Article: International Business Times (2014), ‘Isis Seizes Second
Syrian Gas Field’, 03 November, viewed 28 February 2015, http://goo.gl/W0AYnV
5. Web Document, Article: New York Times (2014), ‘In Airstrikes, U.S. Targets
Militant Cell Said to Plot an Attack Against the West’, 23 September, viewed 12
February 2015, http://goo.gl/ZyJ2RH
6. Web Document, Article: New York Times (2015), ‘Areas Under ISIS Control’, 02
January, viewed 12 February 2015, http://goo.gl/4ww5pb
7. Web Document, Article: Reuters (2014), ‘Islamic State seizes oil field and towns
in Syria's east’, 03 July, viewed 21 February 2015, http://goo.gl/XMxXAt
8. Web Document, Article: Rudaw (2015), ‘US-led airstrikes target ISIS positions
east of Kirkuk’, 09 February, viewed 28 February 2015, http://goo.gl/hX8T6W
9. Web Document, Article: Vocativ (2014), ‘ISIS’ Black Market Oil Business Could
Net up to $100 Million a Day’, 09 May, viewed 12 February 2015, http://goo.gl/XwZUzs
10. Web Document, Article: World Policy Blog (2014), ‘Understanding the Oil
Money Fueling ISIS’, 13 November, viewed 12 February 2015, http://goo.gl/XC9lH2
Portals
1. Web Portal: Baltic Exchange (2015) a, viewed 20 February 2015,
http://goo.gl/0FXYKR
2. Web Portal: Baltic Exchange (2015) b, ‘Dirty tanker Index’, viewed 20 February
2015, http://goo.gl/GVvnlA
3. Web Portal: British Petroleum (2015), ‘Ceyhan terminal’, viewed 14 February
2015, http://goo.gl/9wi6GY
4. Web Portal: Clarksons Research Service Limited (2015), viewed 25 February
2015, http://goo.gl/X6Kyg
5. Web Portal: Municipality of Ceyhan (2015), viewed 14 January 2015,
http://goo.gl/crzYWH
6. Web Portal: Ports.com (2015), ‘Botas Ceyhan Oil Terminal, Turkey’, viewed 14
February 2015, http://goo.gl/Ki7j0g
7. Web Portal: SOMO Iraqi Oil Marketing Company (2015), ‘Crude Oil Exports’,
viewed 14 February 2015, http://goo.gl/65LbZk
8. Web Portal: Wall Street Journal (2015), ‘Market Data Center’, viewed 10
February 2015, http://goo.gl/RO6cU5
15Video Clips
1. Web Document, Video Clip: New York Times (2014) I, ‘The Evolution of ISIS’,
13 December, viewed 03 February 2015, http://goo.gl/9YbgCb
2. Web Document, Video Clip: New York Times (2014) II, ‘ISIS: Behind the Group
Overrunning Iraq’, 10 June, viewed 03 February 2015, http://goo.gl/5kkbsQ
3. Web Document, Video Clip: The Heritage Foundation (2015), ‘ISIS’ Influence in
Social Media’, 04 February, viewed 23 February 2015, http://goo.gl/u2i5bD
16You can also read