Review of tropospheric temperature, absolute humidity and integrated water vapour from the HAMSTRAD radiometer installed at Dome C, Antarctica ...
←
→
Page content transcription
If your browser does not render page correctly, please read the page content below
Antarctic Science 27(6), 598–616 (2015) © Antarctic Science Ltd 2015. This is an Open Access
           article, distributed under the terms of the Creative Commons Attribution licence
           (http://creativecommons.org/licenses/by/4.0/), which permits unrestricted re-use, distribution,
           and reproduction in any medium, provided the original work is properly cited.                   doi:10.1017/S0954102015000334

                 Review of tropospheric temperature, absolute humidity and
             integrated water vapour from the HAMSTRAD radiometer installed
                               at Dome C, Antarctica, 2009–14
                  P. RICAUD1, P. GRIGIONI2, R. ZBINDEN1, J.-L. ATTIÉ1,3, L. GENONI4, A. GALEANDRO5, L. MOGGIO6,
                                         S. MONTAGUTI6, I. PETENKO7,8 and P. LEGOVINI7
                                               1
                                                Météo-France/Centre National de la Recherche Scientifique, Toulouse, France
                                                                               2
                                                                                ENEA, Roma, Italy
                                                                  3
                                                                    Laboratoire d’Aérologie, Toulouse, France
                                                                        4
                                                                          Trieste University, Trieste, Italy
                                                                          5
                                                                           Politecnico di Bari, Bari, Italy
                                                      6
                                                       Institute of Atmospheric Sciences and Climate, Bologna, Italy
                                                        7
                                                          Institute of Atmospheric Sciences and Climate, Roma, Italy
                                                        8
                                                          Obukhov Institute of Atmospheric Physics, Moscow, Russia
                                                                             philippe.ricaud@meteo.fr

                       Abstract: The HAMSTRAD (H2O Antarctica Microwave Stratospheric and Tropospheric Radiometers)
                       instrument is a microwave radiometer installed at Dome C (Antarctica, 75°06'S, 123°21'E, 3233 m a.m.s.l.)
                       dedicated to the tropospheric measurements of temperature, absolute humidity and integrated water vapour
                       (IWV). The aim of the present paper is to review the entire HAMSTRAD dataset from 2009 to 2014 with a
                       7-minute integration time from 0 to 10 km by comparison with coincident radiosondes launched at 12h00
                       UTC at Dome C. Based upon an extensive evaluation of biases and time correlation coefficients (r), we can
                       state: i) IWV is of excellent quality (r > 0.98) and can be used without retrieving significant bias,
                       ii) temperature is suitable for scientific analyses over 0–10 km with a high time correlation with radiosondes
                       (r > 0.80) and iii) absolute humidity is suitable for scientific analyses over 0–4 km with a moderate time
                       correlation against radiosondes (r > 0.70). The vertical distribution of temperature (0–10 km) and absolute
                       humidity (0–4 km) is subject to biases that need to be removed if the analyses require the use of vertical
                       profiling. The HAMSTRAD dataset is provided in open access to the scientific community.
                                                   Received 31 March 2015, accepted 28 May 2015, first published online 30 July 2015

                       Key words: ground-based microwave radiometer, polar atmosphere, radiosonde, statistical analyses,
                       troposphere

           Introduction                                                                                 At polar latitudes, the extreme conditions encountered
                                                                                                     increase the sensitivity to global warming and the speed
           Water vapour (H2O) is the main greenhouse gas emitting                                    of the temperature variations in response compared to
           and absorbing infrared radiation. Its changes directly                                    mid-latitudes (Turner et al. 2006). For example, the
           impact on the radiative balance of the Earth, affecting                                   warming of the Antarctic winter troposphere is greater
           climate evolution (Solomon et al. 2010). At global scale,                                 than anywhere else on Earth with a rate of 0.5–0.7 K per
           the H2O long-term variability both in the troposphere and                                 decade. However, the physical processes which rule
           stratosphere is still an enigma or, at least, under discussion.                           the polar climate are still misunderstood and poorly
           Indeed, neither the positive trend in methane (stratospheric                              represented in models (Hines et al. 2004).
           source of H2O) nor the negative trend of the tropopause                                      The Antarctic Plateau is one of the coldest and driest
           temperature (direct injection of H2O from the troposphere                                 places in the world (e.g. Hagelin et al. 2008). The Dome C
           to the stratosphere) can explain the positive trend in                                    station (Concordia Station) in Antarctica (75°06'S, 123°21'E,
           stratospheric H2O measured by balloon-borne instruments                                   3233 m a.m.s.l.) is a unique site with the opportunity to
           up to 2000 and the negative trend observed since (Scherer                                 actually test the quality of the measurements (Aristidi
           et al. 2008). However, in the upper troposphere–lower                                     et al. 2003, Aumann et al. 2006, de Gregori et al. 2012)
           stratosphere, climate models have been able to reproduce                                  and meteorological analyses (Genthon et al. 2010). Its
           the evolution of H2O as measured by spaceborne                                            location is geographically representative of the eastern
           instruments (Hegglin et al. 2014).                                                        Antarctic Plateau (average altitude 2500 m a.s.l.), and

                                                                                              598

Downloaded from https://www.cambridge.org/core. IP address: 46.4.80.155, on 06 Dec 2020 at 13:47:07, subject to the Cambridge Core terms of use, available at https://www.cambridge.org/core/terms
. https://doi.org/10.1017/S0954102015000334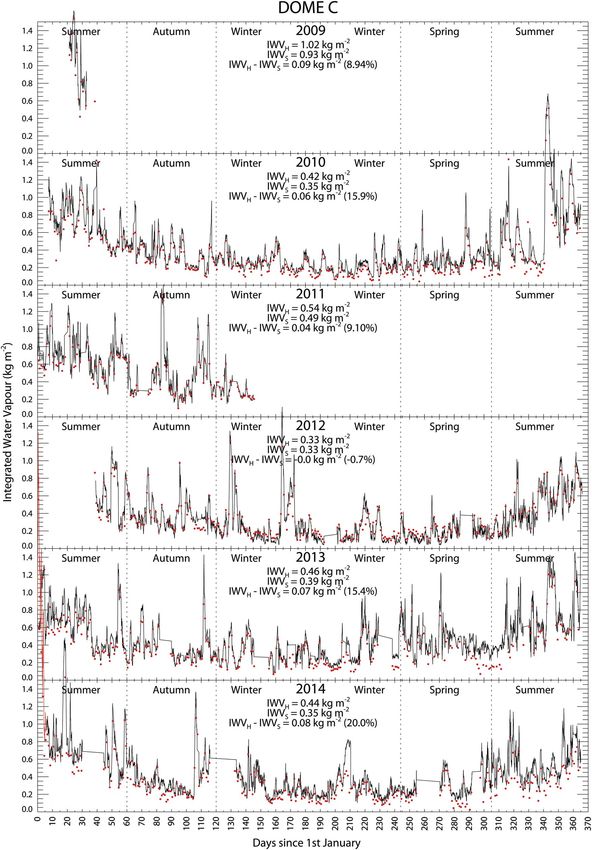
TEMPERATURE, H2O AND IWV FROM HAMSTRAD                                                                              599

        consequently, can be considered as less affected by local                                 Table I. Time evolution of the major changes in the HAMSTRAD
        phenomena, such as orographic waves, katabatic winds,                                     measurements and acquisition versions.
        oceanic breeze, etc., that are far more prominent at                                      Date                   Version Major changes
        coastal stations. Several studies have already shown the                                  22 January 2009         V7.51      Beginning of the summer campaign at
        extreme difficulty of modelling and analysis (assimilation                                                                    Dome C
        of measurements into models) to represent the time                                                                           ∙ First HAMSTRAD measurements
        evolution of the Antarctic atmosphere as measured by                                                                         ∙ Outdoor measurements
        different sensors at different time scales (diurnal cycle, e.g.                                                              ∙ Blue foam
        Genthon et al. 2010, annual evolution, e.g. Tomasi et al.                                 27 January 2009                    Blue foam replaced by white foam
        2012, and intra-seasonal variability, e.g. Argentini et al.                               2 February 2009                    End of the summer campaign
                                                                                                  8 January 2010                     Beginning of the outdoor measurements
        2007), and different vertical layers (planetary boundary                                  16 January 2010                    Beginning of the indoor measurements
        layer, e.g. Argentini et al. 2013, free troposphere and upper                             26 May 2011                        Failure of the 183-GHz noise diode
        troposphere–lower stratosphere, e.g. Ricaud et al. 2014c).                                                                   ∙ HAMSTRAD stops measuring
           For simplicity, because the Dome C station is at high                                  9 February 2012                    Replacement of the 183-GHz noise diode
        altitude, from now on ‘altitude’ will always refer to an                                                                     ∙ HAMSTRAD starts measuring again
        altitude above the surface. The HAMSTRAD (H2O                                             13 January 2013         V8.31      More scanning angles compared to V7.51
        Antarctica Microwave Stratospheric and Tropospheric                                                                          New retrievals including the liquid water
        Radiometers) radiometer has been presented in detail in                                                                      path
        Ricaud et al. 2010b. It is a state-of-the-art microwave                                   14 February 2014        V8.46      More reliable than V8.31
        radiometer dedicated to the tropospheric measurement of
        absolute humidity at 169–197 GHz (G-band, strong H2O
        line at 183.3 GHz), together with temperature from the                                    to the origin of air masses (dry and cold periods associated
        oxygen (O2) line (51–59 GHz, V-band, lower frequency                                      with Antarctic origin of air masses whilst less dry and less
        wing of the O2 line), in very cold and dry environments,                                  cold periods associated with oceanic origin of air masses).
        such as encountered at Dome C all year round. The                                         iii) Temperature versus absolute humidity correlation
        instrument was installed at Dome C in January 2009 and,                                   along the vertical from the lowermost to the middle
        except for a few periods that will be detailed later, has been                            troposphere. Finally, iv) episodes of clouds and diamond
        operational since January 2010. As reported in Ricaud et al.                              dusts above the station.
        (2010b, 2014c), the HAMSTRAD radiometer has routinely                                         Up to now, only the HAMSTRAD measurements
        sampled the whole 24-hour diurnal cycle with a 7-minute                                   performed during 2009–10 have been analysed. The aim
        integration time from 2009 to 2014, and from 0 to 10 km.                                  of this paper is, firstly, to present the entire record of the
        Although the top of the planetary boundary layer (PBL)                                    HAMSTRAD measurements of tropospheric temperature
        decreases on average from ~ 200 m in summer to ~ 30 m in                                  and absolute humidity together with integrated water
        winter (Ricaud et al. 2012), for this analysis we set the PBL                             vapour (IWV) performed routinely over a six year period
        to 200 m from the surface. Nevertheless, in summer, the                                   (2009–14) since it was deployed at the Dome C station. We
        PBL top height is extremely variable ranging from ~ 100 to                                will highlight the major changes that have occurred during
        ~ 800 m within a few days (Ricaud et al. 2012). The free                                  the six year period both regarding the hardware and the
        troposphere is defined as 200 m to 6 km, and the upper                                     software, and the availability of data depending on the
        troposphere–lower stratosphere as 6–10 km. The vertical                                   years considered. Secondly, we will quantify the biases
        resolution for both absolute humidity and temperature                                     of HAMSTRAD measurements against radiosondes
        measurements is ~ 20–50 m in the PBL, ~ 100 m in the free                                 launched on a daily basis at Dome C over the same six
        troposphere and ~ 500 m in the upper troposphere–lower                                    year period, and we will highlight the temporal correlation
        stratosphere (Ricaud et al. 2013).                                                        with the radiosonde datasets by calculating linear Pearson
           In Ricaud et al. (2010a, 2012, 2013, 2014a, 2014b,                                     correlation coefficients (r). Our six year period results will
        2014c), by considering the HAMSTRAD measurements                                          then be compared with the previous extensive 2009–10
        performed in 2009 and 2010 and in other datasets,                                         results. Finally, we will propose the debiased temperature
        e.g. in situ, radiosondes, satellite, lidar, meteorological                               and absolute humidity tropospheric vertical profiles
        analyses, back-trajectories, mesoscale models, we have                                    derived from the raw HAMSTRAD dataset.
        already studied the strengths and weaknesses of this
        instrument by calculating biases and correlations. We
        have also investigated the different processes occurring                                  Datasets
        in the Antarctic troposphere: i) Diurnal variability of
                                                                                                  HAMSTRAD
        temperature and absolute humidity in the PBL.
        ii) Seasonal variability of temperature and absolute                                      The HAMSTRAD radiometer has been presented in
        humidity in the PBL and in the free troposphere linked                                    detail in Ricaud et al. (2010b, 2014b). The goal of the

Downloaded from https://www.cambridge.org/core. IP address: 46.4.80.155, on 06 Dec 2020 at 13:47:07, subject to the Cambridge Core terms of use, available at https://www.cambridge.org/core/terms
. https://doi.org/10.1017/S0954102015000334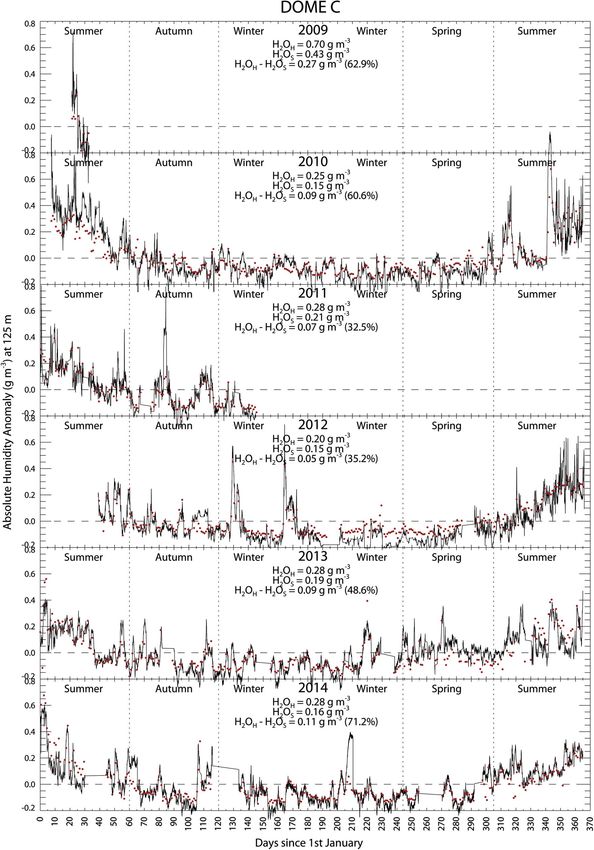
600                                                                        P. RICAUD et al.

           instrument is to sound the troposphere in very cold and                                   Table II. HAMSTRAD measurements over the year or over the period
           dry environments to obtain temperature and absolute                                       of measurements (in italics) from 2009 to 2014.
           humidity profiles, with IWV calculated from the retrieved                                                                                              Percentage of
           water vapour profile integrated from the surface to 10 km.                                                                               Number of     days over the
           The instrument requires a liquid nitrogen calibration once                                                                               days of    year (or the period
                                                                                                     Year      Period                             measurements of measurements)
           or twice per year.
              After an initial campaign in February–June 2008 at                                     2009      22 January–2 February                     12                100
           high altitude (cold and dry environment) in Europe at the                                 2010      18 January–31 December                   347                 95
                                                                                                     2011      1 January–26 May                         125                 83
           Pic du Midi Station (42°56'N, 0°08'E, 2877 m a.m.s.l.,                                    2012      10 February–31 December                  299                 82
           France) to validate the water vapour measurements                                         2013      1 January–31 December                    289                 80
           (Ricaud et al. 2010a), the radiometer was sent to                                         2014      1 January–31 December                    306                 84
           Dome C. Table I shows the history of the operation
           of HAMSTRAD at Dome C from January 2009 to
           December 2014. The very first measurements of
           HAMSTRAD were collected on 22 January 2009, using                                            To calculate the vertical profiles from calibrated
           the acquisition software V7.51 (Ricaud et al. 2013)                                       spectra measured by the radiometer, a statistical
           following deployment outdoors using a blue foam                                           approach was used, performed with a linear (V7.51) or a
           to cover the instrument that was not designed for the                                     quadratic (V8.31 and V8.46) regression based on one
           183-GHz H2O line but rather for the 22-GHz H2O                                            thousand soundings performed at the South Pole (V7.51)
           line. (For a description of the foams used by the                                         or at Dome C (V8.31 and V8.46). This inversion method
           radiometers developed by the RPG company at different                                     has the main advantage of instantly producing vertical
           frequencies and their associated optical performances                                     profiles. However, it has the main drawback of being
           see http://www.radiometer-physics.de/rpg/html/Products_                                   unable to generate mathematical functions (such as
           Radiometers_Profilers.html.) On 27 January 2009, the                                       scanning functions generated in optimal estimation) to
           white foam adapted for the 183-GHz H2O line was                                           characterize the vertical resolution of the measurement
           installed. The 2009 summer campaign ended on                                              and the contamination of the a priori information on the
           2 February 2009. In 2010, the summer campaign started                                     estimated vertical profile. Ricaud et al. (2013) showed
           on 8 January with an outdoor installation. Few days                                       that the linear/quadratic regression and the optimal
           later, the shelter dedicated to HAMSTRAD was                                              estimation methods give consistent results with respect
           completed allowing the first indoor measurements from                                      to the accuracy and the vertical resolution of the
           HAMSTRAD on 16 January 2010. From that date, the                                          measurements of absolute humidity and temperature.
           radiometer has continuously operated in that shelter with                                    Table II shows the number of days and the period of
           a daily data transfer either by email and/or by ftp to                                    measurements of the HAMSTRAD radiometer from
           France. On 26 May 2011, a major failure of the 183-GHz                                    2009 to 2014. If data from 2009, when the instrument was
           noise diode impacted on the internal calibration of the                                   deployed outdoors for 2 weeks, and from June 2011 to
           H2O spectra and prevented measurements of absolute                                        January 2012, when a major failure occurred, are
           humidity vertical profiles and IWV, and also affected the                                  excluded the efficiency of the HAMSTRAD radiometer
           60-GHz receiver (O2 line to retrieve temperature). The                                    to sound the atmosphere is rather elevated, greater than
           183-GHz noise diode was changed on 9 February 2012                                        80%. Indeed, the number of days of measurements per
           and HAMSTRAD was operational again, providing                                             year is 347 (95%) in 2010, 125 (but 83% January to May)
           meaningful measurements of temperature and absolute                                       in 2011, 299 (82%) in 2012, 289 (80%) in 2013, and
           humidity vertical profiles together with IWV. Consequently,                                306 (84%) in 2014.
           temperature vertical profiles from 26 May 2011 to                                             A number of conclusions can be drawn from the
           9 February 2012 should not be used for any scientific                                      extensive validation and scientific studies that have
           analysis and are not presented in this paper. On                                          been performed, mainly in 2009 and 2010, to assess the
           13 January 2013, an updated version of the acquisition                                    quality of the measurements and to explain some physical
           software (V8.31) was installed that used more scanning                                    processes from these measurements. The instrument shows
           angles at low elevations (10 instead of 6) in order to                                    a very high sensitivity in the PBL, a high sensitivity
           achieve better precision and resolution in the PBL.                                       in the free troposphere and a very weak sensitivity in the
           Furthermore, V8.31 offered the possibility to retrieve a                                  upper troposphere–lower stratosphere. Firstly, considering
           new parameter, namely the liquid water path, providing                                    temperature (Ricaud et al. 2014c), in the PBL, a positive
           information on the presence of cloud above the                                            bias of 2–10 K is observed between HAMSTRAD and
           observation site. Finally, on 14 February 2014, the latest                                some of the other datasets (radiosondes, in situ analyses, the
           version of the analysis software, V8.46, was installed to                                 atmospheric infrared sounder (AIRS) spaceborne sensor)
           improve the stability of the acquisition system.                                          (Tobin et al. 2006), while a negative bias from -1 to -5 K is

Downloaded from https://www.cambridge.org/core. IP address: 46.4.80.155, on 06 Dec 2020 at 13:47:07, subject to the Cambridge Core terms of use, available at https://www.cambridge.org/core/terms
. https://doi.org/10.1017/S0954102015000334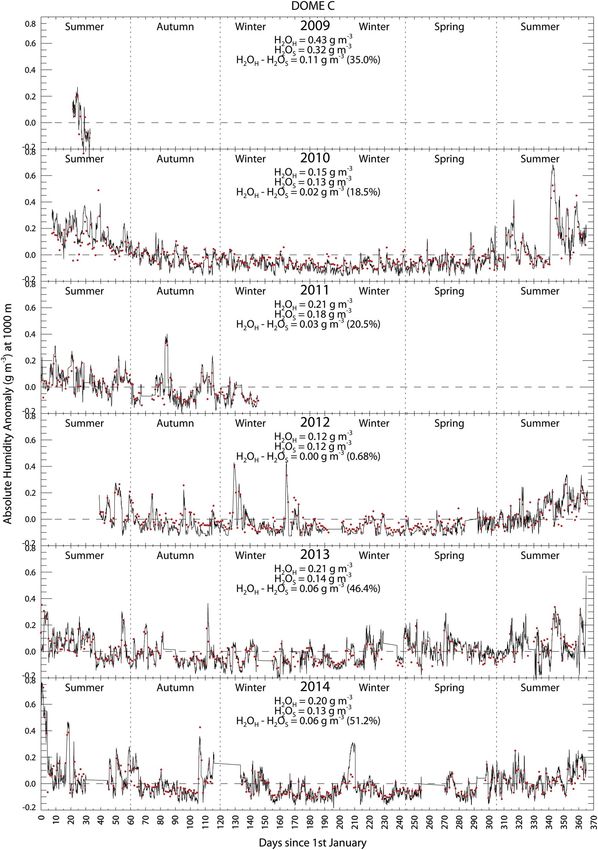
TEMPERATURE, H2O AND IWV FROM HAMSTRAD 601
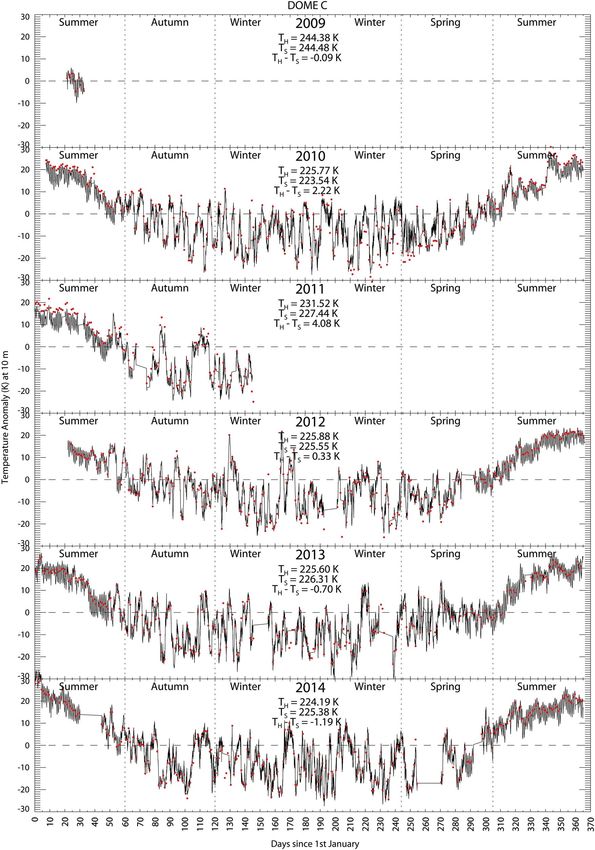
Fig. 1. Time series from 2009 to 2014 (top to bottom) of the temperature anomaly (K) at 10 m as measured by HAMSTRAD
(black line) and the radiosondes (red dots). The yearly-averaged temperatures (K) from HAMSTRAD (TH) and from the
radiosondes (TS) and the difference (TH - TS) are highlighted in each panel.
Downloaded from https://www.cambridge.org/core. IP address: 46.4.80.155, on 06 Dec 2020 at 13:47:07, subject to the Cambridge Core terms of use, available at https://www.cambridge.org/core/terms
. https://doi.org/10.1017/S0954102015000334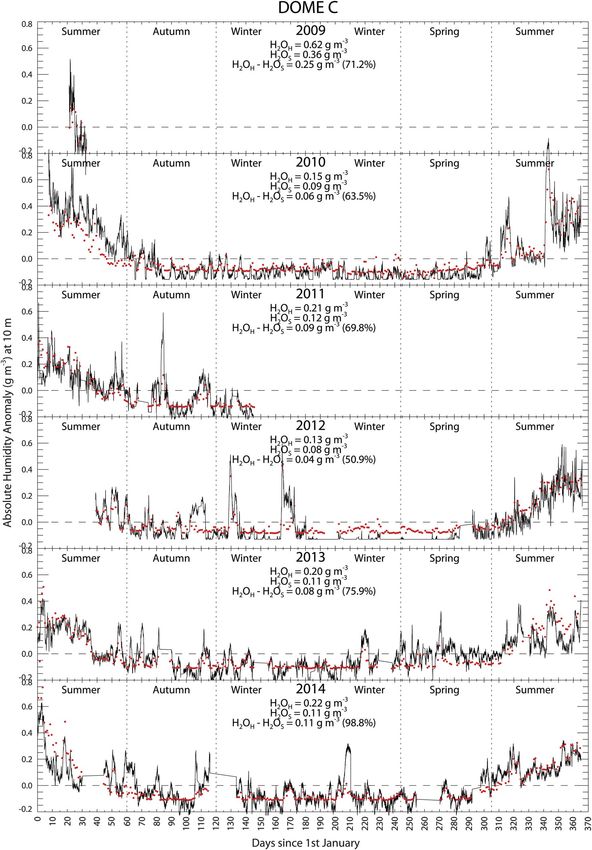
602                                                                        P. RICAUD et al.

           Fig. 2. Time series from 2009 to 2014 (top to bottom) of the temperature anomaly (K) at 125 m as measured by HAMSTRAD
             (black line) and the radiosondes (red dots). The yearly-averaged temperatures (K) from HAMSTRAD (TH) and from the
             radiosondes (TS) and the difference (TH - TS) are highlighted in each panel.

Downloaded from https://www.cambridge.org/core. IP address: 46.4.80.155, on 06 Dec 2020 at 13:47:07, subject to the Cambridge Core terms of use, available at https://www.cambridge.org/core/terms
. https://doi.org/10.1017/S0954102015000334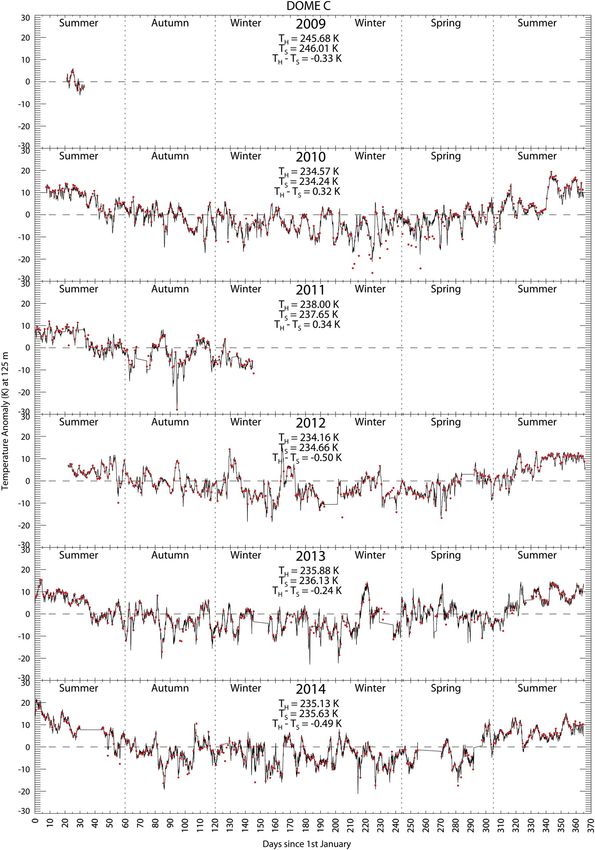
TEMPERATURE, H2O AND IWV FROM HAMSTRAD                                                                              603

        Fig. 3. Time series from 2009 to 2014 (top to bottom) of the temperature anomaly (K) at 1000 m as measured by HAMSTRAD
          (black line) and the radiosondes (red dots). The yearly-averaged temperatures (K) from HAMSTRAD (TH) and from the
          radiosondes (TS) and the difference (TH - TS) are highlighted in each panel.

Downloaded from https://www.cambridge.org/core. IP address: 46.4.80.155, on 06 Dec 2020 at 13:47:07, subject to the Cambridge Core terms of use, available at https://www.cambridge.org/core/terms
. https://doi.org/10.1017/S0954102015000334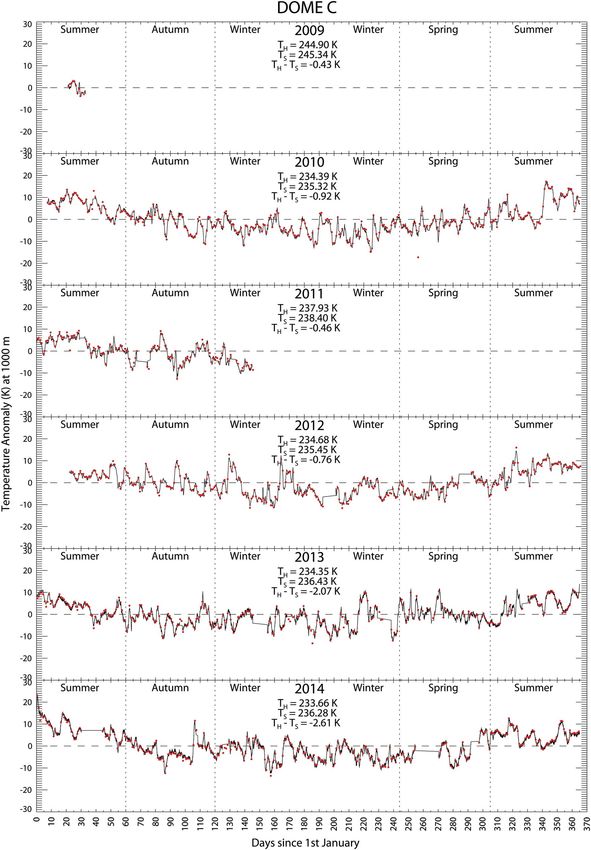
604                                                                        P. RICAUD et al.

           Fig. 4. Time series from 2009 to 2014 (top to bottom) of the temperature anomaly (K) at 5000 m as measured by HAMSTRAD
             (black line) and the radiosondes (red dots). The yearly-averaged temperatures (K) from HAMSTRAD (TH) and from the
             radiosondes (TS) and the difference (TH - TS) are highlighted in each panel.

Downloaded from https://www.cambridge.org/core. IP address: 46.4.80.155, on 06 Dec 2020 at 13:47:07, subject to the Cambridge Core terms of use, available at https://www.cambridge.org/core/terms
. https://doi.org/10.1017/S0954102015000334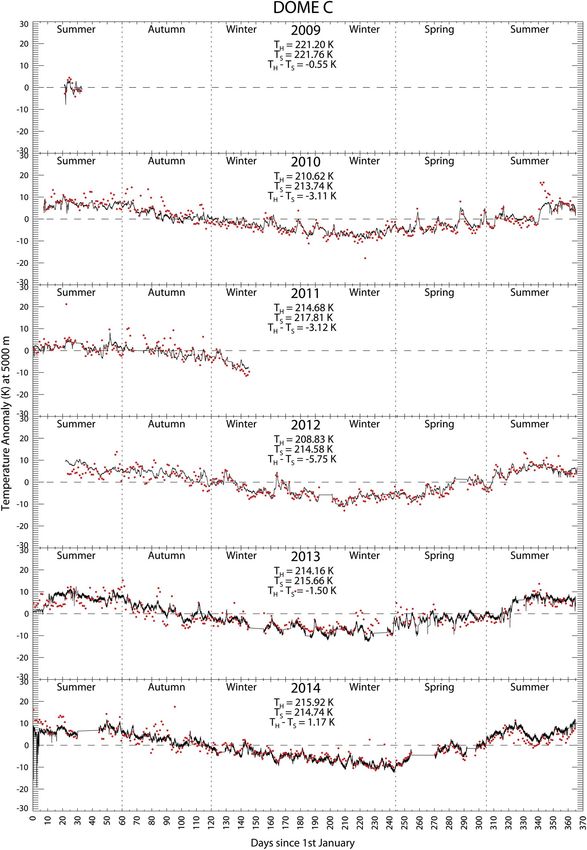
TEMPERATURE, H2O AND IWV FROM HAMSTRAD                                                                              605

                                                                                                                               Fig. 5. Vertical distribution of the
                                                                                                                                 yearly-averaged biases in temperature
                                                                                                                                 (K) of HAMSTRAD versus
                                                                                                                                 radiosondes in 2009 (black line), 2010
                                                                                                                                 (blue line), 2011 (green line), 2012
                                                                                                                                 (red line), 2013 (orange line) and 2014
                                                                                                                                 (yellow line) over the vertical ranges:
                                                                                                                                 a. 0–10 km and b. 0–500 m.

        calculated between HAMSTRAD and the infrared                                              correlation coefficients calculated in 2009 and 2010, we
        atmospheric sounding interferometer (IASI) spaceborne                                     have systematically analysed all of the HAMSTRAD
        sensor (Herbin et al. 2009). In the free troposphere,                                     data over the whole period of measurement at Dome C
        below 4 km, a 1–5 K negative bias is detected between                                     from 2009 to 2014 with a high temporal sampling of
        HAMSTRAD and all the other measurements, and a                                            ~ 7 min by comparison with radiosondes launched on a
        positive bias of ~ 5–10 K above. Secondly, IWV is of a                                    daily basis from the station.
        high quality, namely ~ 1–2% wetter than radiosondes
        and spaceborne IWV measurements. Thirdly, absolute
                                                                                                  Radiosondes
        humidity profiles are wetter by 0.1–0.3 g m-3 than all the
        other datasets below ~ 2 km and drier by ~ 0.1 g m-3 above.                               The radiosonde programme at Dome C is presented in
           Below ~ 6 km, the correlation coefficients (r) of the time                              Ricaud et al. (2014c), together with the biases according
        series of HAMSTRAD measurements versus the time                                           to temperature and absolute humidity. Here we have
        series of radiosonde, in situ, spaceborne data and                                        used the temperature and humidity profiles from RS92
        meteorological analyses are very high (r > 0.8) for                                       radiosondes using the standard Vaisala evaluation
        temperature and IWV, but are much less for absolute                                       routines with no correction of time lag or sensor heating
        humidity (r ~ 0.2–0.8). Based on the known biases and                                     effect. We recall that some corrections performed on the

                                                                                                                               Fig. 6. Vertical distribution of the linear
                                                                                                                                 Pearson correlation coefficient
                                                                                                                                 between the time evolution of
                                                                                                                                 temperature as measured by
                                                                                                                                 HAMSTRAD and radiosondes in
                                                                                                                                 2009 (black line), 2010 (blue line),
                                                                                                                                 2011 (green line), 2012 (red line),
                                                                                                                                 2013 (orange line) and 2014 (yellow
                                                                                                                                 line) over the vertical ranges:
                                                                                                                                 a. 0–10 km and b. 0–2 km.

Downloaded from https://www.cambridge.org/core. IP address: 46.4.80.155, on 06 Dec 2020 at 13:47:07, subject to the Cambridge Core terms of use, available at https://www.cambridge.org/core/terms
. https://doi.org/10.1017/S0954102015000334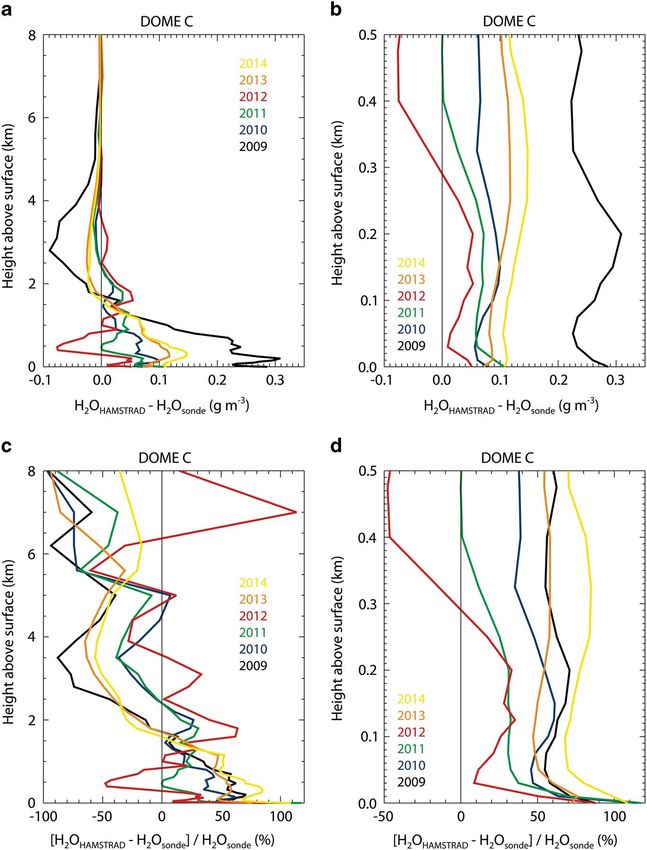
606                                                                        P. RICAUD et al.

           2009 radiosonde data according to Miloshevich et al.                                      particularly visible in winter because of the lack of solar
           (2006) exhibited a weak impact (+4% maximum on IWV)                                       radiation, is also much greater in the lowermost
           on the vertical profiles in the troposphere (Ricaud et al.                                 troposphere (± 10 K) than in the entire free troposphere
           2013). Furthermore, using the procedure developed in                                      (± 5 K at 125 m down to ± 2 K at 5000 m). During the first
           Miloshevich et al. (2009), Tomasi et al. (2011, 2012)                                     days of 2014 (1–3 January), the temperature anomaly
           found that the corresponding correction factor for                                        was unusually high from the PBL to the middle free
           humidity provided by the radiosonde at Dome C, for                                        troposphere: +30 K at 10 m compared to a maximum of
           the 630–470 hPa layer, varied between 1.10 and 1.15                                       +20 K in other years, +20 K at 125 m compared to a
           for daytime and from 0.98 to 1.00 for night-time.                                         maximum of +10–15 K in other years, and +25 K at
           The 630–470 hPa pressure range corresponds to a layer                                     1000 m compared to a maximum of +10 K in other years.
           between the surface and ~ 2 km which mainly contributes                                   At 5000 m, the HAMSTRAD temperature anomaly
           to the calculation of IWV. Regarding temperature, a cold                                  appears to be noisy over this 3-day period, with an
           bias is observed in the RS92 of 1.2 K from the surface up to                              average maximum amplitude of +5 K compared to +10 K
           4 km (Tomasi et al. 2011, 2012).                                                          in the radiosondes, but only slightly greater than the
                                                                                                     temperature anomaly of other years (~ +5 K). This 3-day
                                                                                                     period was associated with an unusual massive injection
                                                                                                     of wet and warm air masses from oceanic origins that
           Tropospheric temperature
                                                                                                     generated thick clouds (data not shown), high humidity
           The time evolution of the temperature anomaly                                             and high temperature in the entire troposphere including
           (difference between temperature and the yearly-averaged                                   the PBL and the free troposphere.
           temperature) as measured by HAMSTRAD at 7-min                                                If we now consider the yearly-averaged biases between
           temporal resolution and by the radiosondes at 10 m (PBL)                                  HAMSTRAD and the radiosonde temperatures (Fig. 5),
           is shown in Fig. 1 for 2009–14. The same evolution is                                     they range from -2 to + 6 K in the PBL (0–200 m),
           shown in Figs 2–4 for the temperature anomaly at 125 m                                    from -1.5 to +0.5 K in the lowermost troposphere
           (middle/upper PBL in summer and low free troposphere                                      (200–1000 m), from -10 to 0 K in the middle troposphere
           in the other seasons), 1000 m (free troposphere) and                                      (1–5 km) and from -2 to +25 K in the upper troposphere–
           5000 m (upper troposphere), respectively. The yearly-                                     lower stratosphere (5–10 km). Further details on the
           averaged biases along the vertical (0–10 km) between                                      greatest differences observed from year to year are
           HAMSTRAD and the radiosondes are shown in Fig. 5                                          discussed here. Firstly, in the PBL (Fig. 5, right), there is
           for 2009–14. The linear Pearson correlation coefficients                                   a large difference in the vertical distribution of the yearly-
           (r) along the vertical (0–10 km) between HAMSTRAD                                         averaged biases according to the year considered, with, at
           and the radiosondes are shown in Fig. 6 for 2009–14.                                      the surface, a positive bias of 1–6 K in 2009–12, and a
           To calculate r for a considered year, a coincidence time                                  negative bias of -1.5 K in 2013 and 2014. Furthermore,
           window of ± 20 minutes has been applied to the                                            there is a systematic local maximum of ~ 80 m in 2009–12,
           HAMSTRAD measurements at 12h00 UTC whenever a                                             that is absent in the 2013–14 yearly-averaged biases. This
           radiosonde was actually launched on a particular day.                                     obviously traces, in the 0–80 m domain, the impact of the
           Note that, consistent with Ricaud et al. (2014c), we define                                new acquisition software (version V8.31), including also
           the four seasons at Dome C as: summer (January,                                           the new retrieval method, that was implemented on
           February, November and December), autumn (March                                           13 January 2013 (Table I). This new version of the
           and April), spring (September and October) and winter                                     software should provide more precise temperature and
           (May, June, July and August). The yearly-averaged bias                                    water vapour vertical profiles in the PBL since there
           is calculated only over 12 days in 2009 (22 January to                                    are more scanning angles at low elevations to retrieve
           2 February) and 125 days in 2011 (1 January to 26 May)                                    temperature and absolute humidity data using a quadratic
           (see Table II).                                                                           instead of a linear regression method. Secondly, in the
              First, irrespective of the altitude or the year considered                             free troposphere (1–5 km), the negative yearly-averaged
           (Figs 1–4), the seasonal variation in temperature anomaly                                 biases tend to increase from 2009 (-1 K) to 2014 (-9 K). We
           is characterized by a maximum in summer and a                                             note that the biases are, in absolute, greater in 2013 (V8.31)
           minimum in winter, with an amplitude larger in the                                        and in 2014 (V8.46) than in 2009–12 (V7.51). Thirdly,
           lowermost troposphere (± 20–25 K at 10 m) than in the                                     although it is known that the instrument loses sensitivity in
           upper troposphere (± 10 K at 5000 m), consistent with                                     the upper troposphere–lower stratosphere (Ricaud et al.
           Ricaud et al. (2014c). The diurnal cycle in temperature                                   2013, 2014c), namely the retrievals are strongly impacted
           anomaly of ± 5 K amplitude is observed in summer and,                                     by the information injected in the linear or quadratic
           with a lesser amplitude (± 2 K), in autumn/spring within                                  regression method, there are large differences in the
           the lowermost troposphere at 10 m (Fig. 1), as already                                    yearly-averaged biases according to the year considered:
           shown in Ricaud et al. (2012). The day-to-day variability,                                ~ -2 K in 2012, + 5 K in 2011, +10 K in 2010, +12 K in

Downloaded from https://www.cambridge.org/core. IP address: 46.4.80.155, on 06 Dec 2020 at 13:47:07, subject to the Cambridge Core terms of use, available at https://www.cambridge.org/core/terms
. https://doi.org/10.1017/S0954102015000334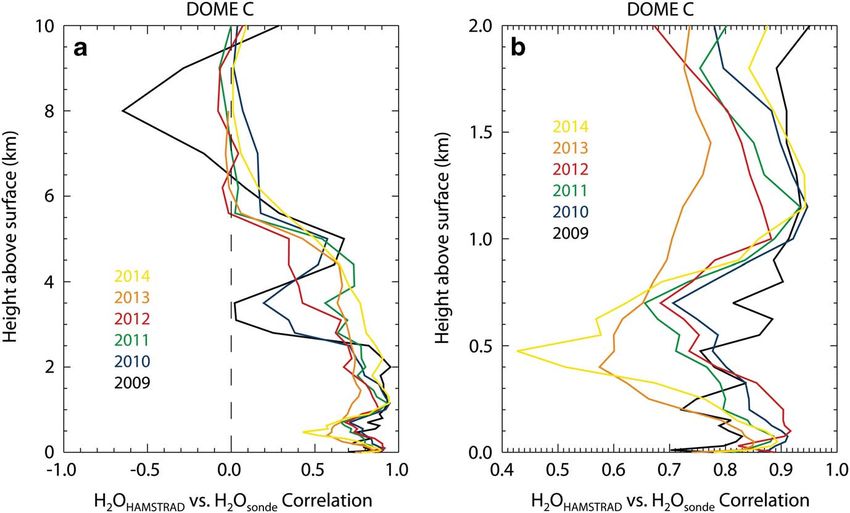
TEMPERATURE, H2O AND IWV FROM HAMSTRAD                                                                              607

        Fig. 7. Time series from 2009 to 2014 (top to bottom) of IWV (kg m-2) as measured by HAMSTRAD (black line) and the radiosondes
          (red dots). The yearly-averaged IWV (kg m-2) from HAMSTRAD (IWVH) and from the radiosondes (IWVS) and the difference
          (IWVH - IWVS) are highlighted in each panel, together with the relative difference (%). In 2010, together with the HAMSTRAD
          measurements, four radiosonde IWV are shown outside of the scale, the values are: 2.09, 1.65, 1.93 and 2.02 kg m-2 on 7 February,
          8, 9 and 10 December 2010, respectively. In 2014, together with the HAMSTRAD measurements, three radiosonde IWV are shown
          outside of the scale, the values are: 3.55, 2.45 and 1.82 kg m-2 on 1, 2 and 3 January 2014, respectively (red line).

Downloaded from https://www.cambridge.org/core. IP address: 46.4.80.155, on 06 Dec 2020 at 13:47:07, subject to the Cambridge Core terms of use, available at https://www.cambridge.org/core/terms
. https://doi.org/10.1017/S0954102015000334
608 P. RICAUD et al.
Table III. Absolute and relative yearly-averaged biases together with the one measured by the radiosonde (r > 0.8) both in the PBL
correlation coefficient (r) of HAMSTRAD versus radiosonde IWV and in the free troposphere (below 6 km) for all years. The
measurements from 2009 to 2014.
correlation degrades in the upper troposphere–lower
Year Absolute bias (kg m-2) Relative bias (%) Correlation (r) stratosphere (above 6 km) in 2009 (r ranging from -0.2
2009 0.091 8.9 0.99 to +0.5) and 2014 (r ranging from +0.4 to +0.8). Firstly,
2010 0.067 15.9 0.98 in the PBL (Fig. 6, right), the correlation is extremely high
2011 0.049 9.1 0.99 (r > 0.97) for most years, it is slightly less in 2009 (r ~ 0.95)
2012 -0.002 -0.7 0.97 and 2012 (r ~ 0.85). In 2009, the data sampling was
2013 0.072 15.5 0.98
2014 0.089 20.0 0.98
limited to only 12 days. However, in 2012, there is a good
coverage of HAMSTRAD and radiosonde measurements
for the whole year. Thus, the reduced correlation rate in
2012 cannot be related to a sampling issue. Secondly, in
2009, +13 K in 2013 and +25 K in 2014 at 7 km. Note that the free troposphere (1–5 km), the correlation is high
for 2013 (V8.31) and 2014 (V8.46) the estimated biases are (r > 0.90) for all years except 2012 (r ~ 0.7–0.8) and 2009
the worst. Finally, regardless of the altitude considered, the (r ranges from ~ 0.95 to 0.2). Thirdly, in the upper
greatest differences in the biases obtained with the same troposphere–lower stratosphere, the correlation is again
acquisition version (V7.51) in 2009 and in 2012 suggest that high (r > 0.90) for all years except 2009 (r ranges from
they are probably induced by the impact of the manual +0.2 to -0.2) and 2014 (r ranges from +0.8 to +0.4).
liquid nitrogen calibration that is performed once or twice In general, irrespective of the altitude considered, the
a year during the summer and winter. lowest correlation coefficients obtained in 2009 can be
The 1-σ root mean square (RMS) error on the 7-min explained by the lowest statistics since only 12 days are
integration time HAMSTRAD temperature is 0.25 K in taken into account. For 2012 and 2014, explaining
the PBL, 0.5 K in the free troposphere and 1 K in the why the correlation coefficients are the lowest in the
upper troposphere–lower stratosphere (Ricaud et al. whole troposphere and in the upper troposphere–lower
2013). Even considering short periods, such as for the stratosphere, respectively, is more challenging and cannot
summer in 2009 or winter in 2011, the error on the yearly- be explained by a straightforward link to the change in
averaged mean is less than ~ 0.1 K, namely much less than acquisition software and/or to the impact of the liquid
the calculated biases. Consequently, the yearly-averaged nitrogen calibration on the calibrated spectra.
biases in temperature can be considered as significant
regardless of the year and the level considered. Note
that there is also a seasonal variation of the bias in
Integrated water vapour
temperature between HAMSTRAD and the radiosonde
data of ± 2 K maximum (not shown) with a bias greater in Figure 7 shows the IWV time series (2009–14) as
winter than in summer. Finally, when considering the measured by HAMSTRAD and the radiosondes. The
yearly-averaged biases of HAMSTRAD data in time yearly-averaged absolute and relative biases between
coincidence within a ± 20 min window, with radiosonde HAMSTRAD and the radiosondes are shown in Table III
data, no significant changes were found. for 2009–14, together with the correlation coefficients (r)
Now consider the vertical distribution of the between HAMSTRAD and the radiosondes.
correlation coefficient (r) between HAMSTRAD and First, note the seasonal variations in IWV with maxima in
the radiosonde temperature measurements (Fig. 6). Note summer (averaging 0.6–1.5 kg m-2) and minima in winter
that, on average, the temporal evolution of temperature (averaging 0.1–1.0 kg m-2), consistent with the analyses
as measured by HAMSTRAD is very consistent with the presented in Tremblin et al. (2011) and Ricaud et al. (2014c).
Table IV. Seasonally-averaged HAMSTRAD IWV (kg m-2) and associated error on the seasonal mean together with the bias (kg m-2) between
HAMSTRAD and the radiosonde IWV measurements from 2009 to 2014 in time coincidence within a temporal window of ± 20 min. Note there are only
summer data for 2009.
Summer Autumn Winter Spring
Year IWV Bias IWV Bias IWV Bias IWV Bias
2009 1.012 ± 0.006 0.090 N.A. N.A. N.A. N.A. N.A. N.A.
2010 0.742 ± 0.002 0.111 0.364 ± 0.003 0.044 0.250 ± 0.002 0.050 0.306 ± 0.003 0.076
2011 0.717 ± 0.003 0.088 0.473 ± 0.003 0.029 0.314 ± 0.005 0.009 N.A. N.A.
2012 0.525 ± 0.002 0.010 0.376 ± 0.003 0.012 0.259 ± 0.002 -0.007 0.168 ± 0.003 -0.041
2013 0.678 ± 0.002 0.105 0.399 ± 0.003 0.050 0.322 ± 0.002 0.054 0.480 ± 0.003 0.131
2014 0.723 ± 0.002 0.151 0.387 ± 0.003 0.076 0.300 ± 0.002 0.071 0.306 ± 0.003 0.096
N.A. = not available.
Downloaded from https://www.cambridge.org/core. IP address: 46.4.80.155, on 06 Dec 2020 at 13:47:07, subject to the Cambridge Core terms of use, available at https://www.cambridge.org/core/terms
. https://doi.org/10.1017/S0954102015000334TEMPERATURE, H2O AND IWV FROM HAMSTRAD 609
Fig. 8. Time series from 2009 to 2014 (top to bottom) of the absolute humidity anomaly (g m-3) at 10 m as measured by
HAMSTRAD (black line) and the radiosondes (red dots). The yearly-averaged absolute humidity (g m-3) from HAMSTRAD
(H2OH) and from the radiosondes (H2OS) and the difference (H2OH – H2OS) are highlighted in each panel, together with the
relative difference (%).
Downloaded from https://www.cambridge.org/core. IP address: 46.4.80.155, on 06 Dec 2020 at 13:47:07, subject to the Cambridge Core terms of use, available at https://www.cambridge.org/core/terms
. https://doi.org/10.1017/S0954102015000334610 P. RICAUD et al.
Fig. 9. Time series from 2009 to 2014 (top to bottom) of the absolute humidity anomaly (g m-3) at 125 m as measured by
HAMSTRAD (black line) and the radiosondes (red dots). The yearly-averaged absolute humidity (g m-3) from HAMSTRAD
(H2OH) and from the radiosondes (H2OS) and the difference (H2OH – H2OS) are highlighted in each panel, together with the
relative difference (%).
Downloaded from https://www.cambridge.org/core. IP address: 46.4.80.155, on 06 Dec 2020 at 13:47:07, subject to the Cambridge Core terms of use, available at https://www.cambridge.org/core/terms
. https://doi.org/10.1017/S0954102015000334TEMPERATURE, H2O AND IWV FROM HAMSTRAD 611
Fig. 10. Time series from 2009 to 2014 (top to bottom) of the absolute humidity anomaly (g m-3) at 1000 m as measured by
HAMSTRAD (black line) and the radiosondes (red dots). The yearly-averaged absolute humidity (g m-3) from HAMSTRAD
(H2OH) and from the radiosondes (H2OS) and the difference (H2OH – H2OS) are highlighted in each panel, together with the
relative difference (%).
Downloaded from https://www.cambridge.org/core. IP address: 46.4.80.155, on 06 Dec 2020 at 13:47:07, subject to the Cambridge Core terms of use, available at https://www.cambridge.org/core/terms
. https://doi.org/10.1017/S0954102015000334612 P. RICAUD et al.
Fig. 11a. & b. Vertical distribution of
the yearly-averaged biases (g cm-3)
and c. & d. relative yearly-averaged
biases (%) in absolute humidity for
HAMSTRAD versus radiosondes in
2009 (black line), 2010 (blue line),
2011 (green line), 2012 (red line),
2013 (orange line) and 2014 (yellow
line) over the vertical ranges:
a. & c. 0–8 km and b. & d. 0–500 m.
On one hand, the maxima in IWV measured consistently measured by the radiosondes, except for 2012. Indeed, for
by HAMSTRAD and the radiosondes observed: i) on 1–3 all years except 2012, the yearly-averaged biases between
January 2014 (values exceeding 3.0 kg m-2, exceptional HAMSTRAD and the radiosondes (Table III) range
for the Dome C site) are well correlated with the maxima from 0.049 to 0.091 kg m-2 (8.9–20.0%). While in 2012 the
in temperature from the PBL to the free troposphere, yearly-averaged bias is almost null, namely -0.002 kg m-2
ii) on 8–10 December 2010 (values exceeding 2.0 kg m-2) (-0.71%). Note that the yearly-averaged biases degrade
correlate with the maxima in temperature (see Figs 1–3) in from 2012 to 2014 from -0.71% to 20.0%, respectively.
the PBL and the free troposphere, and iii) in winter 2012 The correlation coefficients (r) between HAMSTRAD
(e.g. around days 130 and 165 with values exceeding 1.0 kg and the radiosondes are extremely high, ranging from
m-2) are well correlated with the maxima in temperature in 0.97 to 0.99, over 2009–14. Although a dry bias in the
the PBL and the free troposphere (Figs 1–3). On the other radiosondes of a few percent has previously been noted
hand, the minima in IWV measured by the radiosondes (Rowe et al. 2008, Tomasi et al. 2011, 2012, Ricaud et al.
in October 2010, 2013 and 2014 (values ranging from 2013) consistent with the current analysis, both the
0.05 to 0.1 kg m-2) are much less than HAMSTRAD IWV radiosondes and HAMSTRAD track the same temporal
by 0.1 kg m-2. evolution of IWV from 2009 to 2014.
In general, the atmosphere as measured by Now consider the seasonal evolution of the bias
HAMSTRAD is slightly wetter than the atmosphere as between HAMSTRAD and the radiosondes (Table IV).
Downloaded from https://www.cambridge.org/core. IP address: 46.4.80.155, on 06 Dec 2020 at 13:47:07, subject to the Cambridge Core terms of use, available at https://www.cambridge.org/core/terms
. https://doi.org/10.1017/S0954102015000334TEMPERATURE, H2O AND IWV FROM HAMSTRAD 613
Fig. 12. Vertical distribution of the
correlation coefficient between the
time evolution of absolute humidity
as measured by HAMSTRAD and
radiosondes in 2009 (black line), 2010
(blue line), 2011 (green line), 2012
(red line), 2013 (orange line) and 2014
(yellow line) over the vertical ranges:
a. 0–10 km and b. 0–2 km.
The error associated to the HAMSTRAD seasonally- for absolute humidity in the upper troposphere–lower
averaged IWV is always less than the seasonally-averaged stratosphere (e.g. at 5000 m) due to a lack of sensitivity of
bias whatever the season and year considered, even HAMSTRAD in absolute humidity measurements (see
during periods of low numbers of measurements such as Ricaud et al. 2014c).
in the summer of 2009 and the winter of 2011. Thus, we As mentioned in the previous section regarding IWV
conclude that there is a significant bias in IWV between and in the absolute humidity study in 2010 by Ricaud
HAMSTRAD and the radiosondes. Remember that et al. (2014c), the seasonal variation of absolute humidity
the 1-σ RMS error on the 7-min integration time exhibits maxima in summer and minima in winter for all
HAMSTRAD IWV is 0.05 kg m-2 or ~ 5% (Ricaud et al. years considered 2010–14 with an amplitude larger in the
2013). In general, the summer bias (~ 0.1 kg m-2) is on lowermost troposphere (+0.4 to -0.2 g m-3 at 10 and
average twice that of the winter bias (~ 0.05 kg m-2) mainly 125 m) than in the free troposphere (± 0.2 g m-3 at
because IWV is twice as great in summer (~0.6–0.7 kg m-2) 1000 m). Unlike with temperature, the diurnal cycle in
as in winter (0.3 kg m-2). As with temperature, when absolute humidity is not obviously detected in summer
considering the yearly-averaged biases of HAMSTRAD since its amplitude is much weaker than the temperature
IWV data in time coincidence within a ± 20 min window diurnal amplitude (Ricaud et al. 2012). Nevertheless, in
with radiosonde data, no significant changes were found. the first few days of 2014 (1–3 January), the absolute
humidity anomaly was unusually high from the PBL to
the middle free troposphere: +0.8 g m-3 at 10, 125 and
1000 m compared to a maximum of +0.4 g m-3 other
Tropospheric absolute humidity
years. Note a huge increase in absolute humidity at the
The time evolution of the absolute humidity anomaly beginning of December 2010 reaching, within 3 days,
(difference between absolute humidity and the yearly- 0.8 g m-3 at 10 m and 125 m, and 0.6 g m-3 at 1000 m, that
averaged absolute humidity) as measured by HAMSTRAD is associated with an increase in temperature (Figs 1–3)
and by the radiosondes at 10 m (PBL) is shown in Fig. 8 for of ~ 10 K at 10, 125 and 1000 m. Using 5-day back-
2009–14. The same evolution is shown in Figs 9 and 10 for trajectories, Ricaud et al. (2013) attribute these episodes
the absolute humidity anomaly at 125 m (middle/upper of high temperature and high absolute humidity over
PBL in summer and low free troposphere in the other Dome C to air masses originating from oceanic wet
seasons), and at 1000 m (free troposphere), respectively. and warm areas. Conversely, dry and cold periods over
The yearly-averaged biases along the vertical (0–10 km Dome C are obviously in phase with air masses
above the ground) between HAMSTRAD and the originating from the cold and dry Antarctic continent.
radiosondes are shown in Fig. 11 for 2009–14. The Also note the plateau observed over the winter in the
correlation coefficients (r) along the vertical between HAMSTRAD absolute humidity at 10 m in 2010 and
HAMSTRAD and the radiosondes are shown in Fig. 12 2012 that is linked to the minimum values set to zero in
for 2009–14. Note that, in contrast to what has been these periods, induced by the acquisition and retrieval
shown for temperature, we do not provide any time series software V7.51 (Table I).
Downloaded from https://www.cambridge.org/core. IP address: 46.4.80.155, on 06 Dec 2020 at 13:47:07, subject to the Cambridge Core terms of use, available at https://www.cambridge.org/core/terms
. https://doi.org/10.1017/S0954102015000334614 P. RICAUD et al.
If we now quantify the yearly-averaged absolute and HAMSTRAD data in time coincidence within a ± 20 min
relative biases between HAMSTRAD and the radiosonde window with the radiosonde data.
absolute humidity (Fig. 11), they range from -0.1 to If we consider the vertical distribution of the correlation
+0.3 g m-3 (from 0 to +100%) in the PBL (0–200 m), -0.1 coefficient (r) between HAMSTRAD and the radiosonde
to +0.3 g m-3 (from -50% to +75%) in the lowermost measurements of absolute humidity (Fig. 12), we find that,
troposphere (200–1000 m), and -0.1 to 0.1 g m-3 (from from 0 to 2 km, the temporal evolution of absolute
-100% to +50%) in the middle troposphere (1–4 km). humidity is consistently measured by both techniques
Note that above 4 km both the sensitivity of the (r > 0.7) for all the years considered, except for 2013 and
HAMSTRAD instrument and the amount of absolute 2014 which show a weak correlation coefficient of 0.6 and
humidity dramatically decrease; thus, biases in the 0.4, respectively, at ~ 0.5 km. From 2 to 4 km, r slightly
domain 4–10 km will not be discussed. There are lots of decreases from 0.7 to 0.6 for all years considered, except
differences from year to year in the vertical distribution of for 2009 and 2010 at ~ 3.0 km when a very weak
the biases but the general trend is that the atmosphere correlation coefficient is calculated to be 0 and 0.2,
is much wetter in the HAMSTRAD measurements respectively. Below 2 km, the vertical distribution of r is
compared to the radiosondes below 1.5–2 km and much very consistent (r ~ 0.7–1.0) for 2009–12 processed with
drier above. If we exclude the data from the poorly- version V7.51. Above 2 km, the vertical distribution of r is
sampled 2009, we observe that, in the PBL, biases are all very consistent (r ~ 0.6–0.8) for 2013 (V8.31) and 2014
positive within 0–0.1 g m-3 (0–100%) with the smallest (V8.46). Finally note that, in contrast to temperature, the
bias in 2012 and the greatest bias in 2014. The impact of vertical distribution of r in 2012 does not significantly
the acquisition software on to the biases in the PBL is differ from other years.
not obvious. That is not the case in the free troposphere
(0.2–4 km) where the biases in 2013 and 2014 behave
consistently (versions V8.31 and V8.46, respectively) from
Conclusions
+0.12 to -0.02 g m-3 (from -75% to +75%), whilst the
biases in 2010 and 2011 behave consistently (version The HAMSTRAD (H2O Antarctica Microwave
V7.51) from +0.05 to -0.01 g m-3 (from +30% to -40%). As Stratospheric and Tropospheric Radiometers) radiometer
with temperature, regardless of the altitude considered, is a state-of-the-art microwave radiometer dedicated to
the biases obtained in 2012 compared to 2010 and 2011 the measurement of tropospheric absolute humidity at
with the same acquisition version (V7.51) are very 169–197 GHz (G-band, strong H2O line at 183.3 GHz),
different with a minimum at 0.5 km of -0.08 g m-3 together with tropospheric temperature from the oxygen
(-50%) and a maximum of +0.05 g m-3 (+60%) at (O2) line (51–59 GHz, V-band, lower frequency wing of
1.5 km. The atypical bias in 2012 suggests that the the O2 line), in very cold and dry environments, such as
manual liquid nitrogen calibration performed once or that encountered at Dome C all year round. The
twice a year during the summer and winter has an impact HAMSTRAD radiometer samples the whole 24-h
on the HAMSTRAD measurements. Finally, note that diurnal cycle with a 7-min integration time from 2009
the new acquisition software has not reduced the biases in to 2014, and from 0 to 10 km above surface, with a
absolute humidity between HAMSTRAD and the vertical resolution from ~ 30 m in the PBL to ~ 500 m in
radiosondes in either the PBL or the free troposphere. the upper troposphere–lower stratosphere. Considering
The 1-σ RMS error on the 7-min integration time the HAMSTRAD measurements in conjunction with
HAMSTRAD absolute humidity is 0.05 g m-3 (10%) in other datasets (in situ, radiosondes, satellite, lidar,
the PBL, 0.03 g m-3 (10–15%) in the free troposphere and meteorological analyses, back-trajectories, mesoscale
0.005 g m-3 (15%) in the upper troposphere–lower models), we have been able to study different processes
stratosphere (Ricaud et al. 2013). Even considering short in the Antarctic troposphere including: i) diurnal
periods, such as in the summer of 2009 or the winter of variability of temperature and absolute humidity in the
2011, the error on the yearly-averaged mean is less than PBL, ii) seasonal variability of temperature and absolute
~ 2%, namely much less than the calculated biases. humidity in the PBL and in the free troposphere,
Consequently, the yearly-averaged biases in absolute iii) temperature versus absolute humidity correlation
humidity can be considered as significant irrespective of along the vertical from the lowermost to the middle
the year and the level considered below 4 km. Note that troposphere and iv) episodes of clouds and diamond dusts
there is also a seasonal variation of the bias in absolute above the station.
humidity between HAMSTRAD and the radiosonde The measurements of tropospheric temperature and
data of ± 0.01 g m-3 maximum (not shown) with a bias absolute humidity vertical profiles together with IWV
greater in summer than in winter. Finally, as with provided by the HAMSTRAD radiometer have been
temperature and IWV, no significant changes were reviewed from 2009 to 2014 in comparison with
found when considering the yearly-averaged biases of radiosondes launched at 12h00 UTC. This exercise
Downloaded from https://www.cambridge.org/core. IP address: 46.4.80.155, on 06 Dec 2020 at 13:47:07, subject to the Cambridge Core terms of use, available at https://www.cambridge.org/core/terms
. https://doi.org/10.1017/S0954102015000334TEMPERATURE, H2O AND IWV FROM HAMSTRAD 615
enlarges the previous study that only concentrated on the National de la Recherche Scientifique (CNRS), the
2010 data but encompassed, in addition to radiosondes, Institut polaire français Paul-Emile Victor (IPEV), Météo-
in situ and spaceborne measurements, together with France and the Centre National d’Etudes Spatiales
meteorological analyses. It is well known that radiosondes (CNES). The permanently manned Concordia Station is
have biases at polar latitudes, in particular at Dome C, both jointly operated by IPEV and the Italian Programma
in terms of temperature and humidity. Nevertheless, our Nazionale Ricerche in Antartide (PNRA). We would like
previous analyses based upon data from 2010 did show to thank all the overwinter personnel who have worked at
some consistency between radiosondes and all of the other Dome C since 2009 on the two projects: HAMSTRAD and
datasets versus HAMSTRAD measurements. radiosondes. Finally, the two anonymous reviewers are
We can state the following points regarding the quality acknowledged for their fruitful comments.
of the HAMSTRAD measurements with a 7-min
integration time over the period 2009–14, based upon an
extensive evaluation of biases and time correlation Author contribution statement
coefficients (r) along the vertical. i) HAMSTRAD IWV
P. Ricaud led the research and contributed 80% to the
measurements are of excellent quality showing high time
data collection, data analysis and preparation of the
correlation with radiosonde data (r > 0.98), and can be
manuscript. P. Grigioni and R. Zbinden contributed 3%
used without retrieving significant bias. ii) HAMSTRAD
towards the research. J.-L. Attié, L. Genoni, A. Galeandro,
temperature measurements are suitable for scientific
L. Moggio, S. Montaguti, I. Petenko and P. Legovini
analyses over the range of 0–10 km with high time
contributed 2% towards the data collection.
correlation with radiosondes (r > 0.80). Nevertheless, the
vertical distribution of temperature from 0 to 10 km
is subject to biases that need to be removed if the
scientific analyses require the use of vertical profiling. References
iii) HAMSTRAD absolute humidity measurements ARISTIDI, E., AGABI, A., VERNIN, J., AZOUIT, M., MARTIN, F., ZIAD, A. &
are suitable for scientific analyses but all within the FOSSAT, E. 2003. Antarctic site testing: first daytime seeing monitoring
range of 0–4 km with a moderate time correlation at Dome C. Astronomy and Astrophysics, 406, 19–22.
ARGENTINI, S., PIETRONI, I., MASTRANTONIO, G., VIOLA, A. &
with radiosondes (r > 0.70). Nevertheless, the vertical ZILITINCHEVICH, S. 2007. Characteristics of the night and day time
distribution of absolute humidity from 0 to 4 km is subject atmospheric boundary layer at Dome C, Antarctica. EAS
to biases that need to be removed if the scientific analyses Publications Series, 25, 49–55.
require the use of vertical profiling. Above 4 km, the ARGENTINI, S., PETENKO, I., VIOLA, A., MASTRANTONIO, G., PIETRONI, I.,
instrument loses sensitivity and the amount of absolute CASASANTA, G., ARISTIDI, E. & GENTHON, C. 2013. The surface layer
observed by a high-resolution sodar at DOME C, Antarctica. Annals
humidity falls down. Using HAMSTRAD data from
of Geophysics, 56, 10.4401/ag-6347.
2009 to 2014 we confirm the findings of previous studies AUMANN, H., GREGORICH, D. & BROBERG, S. 2006. AIRS observations of
from 2009 and 2010. Dome C in Antarctica and comparison with automated weather
The whole HAMSTRAD dataset including temperature, stations. Proceedings of the Fifteenth International TOVS Study
absolute humidity and IWV covering 2009–14 with a time Conference, 140–147.
DE GREGORI, S., DE PETRIS, M., DECINA, B., LAMAGNA, L., PARDO, J.R.,
resolution of 7 minutes is provided in open access to the
PETKOV, B., TOMASI, C. & VALENZANO, L. 2012. Millimetre and
scientific community at http://www.cnrm.meteo.fr/spip. submillimetre atmospheric performance at Dome C combining
php?article961&lang=en. In addition, the yearly-averaged radiosoundings and atm synthetic spectra. Monthly Notices of the
biases along the vertical for 2009–14 are also provided for Royal Astronomical Society, 425, 10.1111/j.1365-2966.2012.21430.x.
scientific studies that consider vertical profiling. By these GENTHON, C., TOWN, M.S., SIX, D., FAVIER, V., ARGENTINI, S. &
PELLEGRINI, A. 2010. Meteorological atmospheric boundary layer
means, the HAMSTRAD measurements will contribute
measurements and ECMWF analyses during summer at Dome C,
to the investigation of physical processes above the Antarctica. Journal of Geophysical Research - Atmospheres, 115,
Dome C station by combining HAMSTRAD data with 10.1029/2009JD012741.
other measurements (e.g. aerosol lidar, radiation budget, HAGELIN, S., MASCIADRI, E., LASCAUX, F. & STOESZ, J. 2008. Comparison
meteorological parameters, etc.) both short-term, e.g. ice of the atmosphere above the South Pole, Dome C and Dome A: first
attempt. Monthly Notice of the Royal Astronomical Society, 387,
crystal episodes (diamond dust), and long-term, e.g. trends
10.1111/j.1365-2966.2008.13361.x.
in temperature and absolute humidity, and/or for the HEGGLIN, M.I., PLUMMER, D.A., SHEPHERD, T.G., SCINOCCA, J.F.,
validation of satellite data. ANDERSON, J., FROIDEVAUX, L., FUNKE, B., HURST, D., ROZANOV, A.,
URBAN, J., VON CLARMANN, T., WALKER, K.A., WANG, H.J.,
TEGTMEIER, S. & WEIGEL, K. 2014. Vertical structure of stratospheric
water vapour trends derived from merged satellite data. Nature
Acknowledgements Geoscience, 7, 768–776.
HERBIN, H., HURTMANS, D., CLERBAUX, C., CLARISSE, L. & COHEUR, P.F.
The HAMSTRAD programme is funded by the Institut 2009. (H2O)-O-16 and HDO measurements with IASI/MetOp.
National des Sciences de l’Univers (INSU)/Centre Atmospheric Chemistry and Physics, 9, 9433–9447.
Downloaded from https://www.cambridge.org/core. IP address: 46.4.80.155, on 06 Dec 2020 at 13:47:07, subject to the Cambridge Core terms of use, available at https://www.cambridge.org/core/terms
. https://doi.org/10.1017/S0954102015000334616 P. RICAUD et al.
HINES, K.M., BROMWICH, D.H., RASCH, P.J. & IACONO, M.J. 2004. RICAUD, P., GENTHON, C., DURAND, P., ATTIÉ, J.-L., CARMINATI, F.,
Antarctic clouds and radiation within the NCAR climate models. CANUT, G., VANACKER, J.-F., MOGGIO, L., COURCOUX, Y., PELLEGRINI, A.
Journal of Climate, 17, 10.1175/1520-0442(2004)017. & ROSE, T. 2012. Summer to winter diurnal variabilities of temperature
MILOSHEVICH, L.M., VÖMEL, H., WHITEMAN, D.N. & LEBLANC, T. 2009. and water vapour in the lowermost troposphere as observed by the
Accuracy assessment and corrections of Vaisala RS92 radiosonde HAMSTRAD radiometer over Dome C, Antarctica. Boundary-Layer
water vapour measurements. Journal of Geophysical Research - Meteorology, 143, 10.1007/s10546-011-9673-6.
Atmospheres, 114, 10.1029/2008JD011565. ROWE, P.M., MILOSHEVICH, L.M., TURNER, D.D. & WALDEN, V.P. 2008.
MILOSHEVICH, L.M., VÖMEL, H., WHITEMAN, D.N., LESHT, B.M., Dry bias in Vaisala RS90 radiosonde humidity profiles over
SCHMIDLIN, F.J. & RUSSO, F. 2006. Absolute accuracy of water Antarctica. Journal of Atmospheric and Oceanic Technology, 25,
vapour measurements from six operational radiosonde types 10.1175/2008JTECHA1009.1.
launched during AWEX-G and implications for AIRS validation. SCHERER, M., VÖMEL, H., FUEGLISTALER, S., OLTMANS, S.J. & STAEHELIN, J.
Journal of Geophysical Research - Atmospheres, 111, 10.1029/ 2008. Trends and variability of midlatitude stratospheric water vapour
2005JD006083. deduced from the re-evaluated Boulder balloon series and HALOE.
RICAUD, P. 2014a. Variabilités de la vapeur d'eau et de la température Atmospheric Chemistry and Physics, 8, 1391–1402.
troposphérique au Dôme C (station Concordia), Antarctique. Partie I: SOLOMON, S., ROSENLOF, K.H., PORTMANN, R.W., DANIEL, J.S.,
l’instrument HAMSTRAD. La Météorologie, 84, 10.4267/2042/ DAVIS, S.M., SANFORD, T.J. & PLATTNER, G.-K. 2010. Contributions
53184. of stratospheric water vapour to decadal changes in the rate of global
RICAUD, P. 2014b. Variabilités de la vapeur d’eau et de la température warming. Science, 327, 1219–1223.
troposphérique mesurées par le radiomètre micro-onde HAMSTRAD TOBIN, D.C., REVERCOMB, H.E., KNUTESON, R.O., LESHT, B.M.,
au Dôme C, Antarctique. Partie II: Résultats scientifiques. STROW, L.L., HANNON, S.E., FELTZ, W.F., MOY, L.A., FETZER, E.J.
La Météorologie, 85, 10.4267/2042/53749. & CRESS, T.S. 2006. Atmospheric radiation measurement site
RICAUD, P., GABARD, B., DERRIEN, S., ATTIÉ, J.-L., ROSE, T. & atmospheric state best estimates for atmospheric infrared sounder
CZEKALA, H. 2010a. Validation of tropospheric water vapour as temperature and water vapor retrieval validation. Journal of
measured by the 183-GHz HAMSTRAD radiometer over the Geophysical Research - Atmospheres, 111, 10.1029/2005JD006103.
Pyrenees Mountains, France. IEEE Transactions on Geoscience and TOMASI, C., PETKOV, B.H. & BENEDETTI, E. 2012. Annual cycles of
Remote Sensing, 48, 2189–2203. pressure, temperature, absolute humidity and precipitable water from
RICAUD, P., GABARD, B., DERRIEN, S., CHABOUREAU, J.-P., ROSE, T., the radiosoundings performed at Dome C, Antarctica, over the 2005–
MOMBAUER, A. & CZEKALA, H. 2010b. HAMSTRAD-Tropo, 2009 period. Antarctic Science, 24, 10.1017/S0954102012000405.
A 183-GHz radiometer dedicated to sound tropospheric water vapor TOMASI, C., PETKOV, B., BENEDETTI, E., VALENZIANO, L. & VITALE, V. 2011.
over Concordia Station, Antarctica. IEEE Transactions on Geoscience Analysis of a 4 year radiosonde data set at Dome C for characterizing
and Remote Sensing, 48, 10.1109/TGRS.2009.2029345. temperature and moisture conditions of the Antarctic atmosphere. Journal
RICAUD, P., CARMINATI, F., ATTIÉ, J.-L., COURCOUX, Y., ROSE, T., of Geophysical Research - Atmospheres, 116, 10.1029/2011JD015803.
GENTHON, C., PELLEGRINI, A., TREMBLIN, P. & AUGUST, T. 2013. TREMBLIN, P., MINIER, V., SCHNEIDER, N., DURAND, G.AL., ASHLEY, M.C.B.,
Quality assessment of the first measurements of tropospheric water LAWRENCE, J.S., LUONG-VAN, D.M., STOREY, J.W.V., DURAND, G.AN.,
vapour and temperature by the HAMSTRAD radiometer over REINERT, Y., VEYSSIERE, C., WALTER, C., ADE, P., CALISSE, P.G.,
Concordia Station, Antarctica. IEEE Transactions on Geoscience CHALLITA, Z., FOSSAT, E., SABBATINI, L., PELLEGRINI, A., RICAUD, P. &
and Remote Sensing, 51, 10.1109/TGRS.2012.2225627. URBAN, J. 2011. Site testing for submillimetre astronomy at Dome C
RICAUD, P., CARMINATI, F., COURCOUX, Y., PELLEGRINI, A., ATTIÉ, J.-L., in Antarctica. Astronomy and Astrophysics, 535, 10.1051/0004-
EL AMRAOUI, L., ABIDA, R., GENTHON, C., AUGUST, T. & WARNER, J. 6361/201117345.
2014c. Statistical analyses and correlation between tropospheric TURNER, J., LACHLAN-COPE, T.A., COLWELL, S., MARSHALL, G.J. &
temperature and humidity at Dome C, Antarctica. Antarctic CONNOLLEY, W.M. 2006. Significant warming of the Antarctic winter
Science, 26, 10.1017/S0954102013000564. troposphere. Science, 311, 10.1126/science.1121652.
Downloaded from https://www.cambridge.org/core. IP address: 46.4.80.155, on 06 Dec 2020 at 13:47:07, subject to the Cambridge Core terms of use, available at https://www.cambridge.org/core/terms
. https://doi.org/10.1017/S0954102015000334You can also read