Multi-core Optical Fibers with Bragg Gratings as Shape Sensor for Flexible Medical Instruments
←
→
Page content transcription
If your browser does not render page correctly, please read the page content below
This article has been accepted for publication in a future issue of this journal, but has not been fully edited. Content may change prior to final publication. Citation information: DOI 10.1109/JSEN.2019.2905010, IEEE Sensors
                                                                                                                  Journal
                                                                                                                                                                                                                 1

                   Multi-core Optical Fibers with Bragg Gratings as
                    Shape Sensor for Flexible Medical Instruments
                              Fouzia Khan, Alper Denasi, David Barrera, Javier Madrigal, Salvador Sales, and Sarthak Misra

                 Abstract—This article presents a technique to reconstruct the
              shape of a flexible instrument in three dimensional Euclidean
              space based on data from Fiber Bragg Gratings (FBG) that
              are inscribed in multi-core fibers. Its main contributions are
              the application of several multi-core fibers with FBGs as shape
              sensor for medical instruments and a thorough presentation of
              the reconstruction technique. The data from the FBG sensors
              is first converted to strain measurements, which is then used to
              calculate the curvature and torsion of the fibers. The shape of
              the instrument is reconstructed using Frenet-Serret equations
              in conjunction with the calculated curvature and torsion of
              the instrument. The reconstruction technique is validated with
              a catheter sensorized with 4 multi-core fibers that have FBG
              sensors. The catheter is placed in 8 different configurations
              and the reconstruction is compared to the ground truth. The
              maximum reconstruction error among all the configurations is
              found to be 1.05 mm. The results show that shape sensing for
              flexible medical instruments is feasible with FBG sensors in multi-                                 Fig. 1. Multi-core optical fibers can be placed in numerous flexible medical
              core fibers.                                                                                        instruments due to their small size, flexibility, light weight, immunity to elec-
                Index Terms—Fiber Bragg grating, bio-medical, robotics,                                           tromagnetic interference and compatibility with medical imaging modalities.
                                                                                                                  Fibers with Bragg Gratings (FBG) are shown embedded in a) a catheter and
              shape sensing, medical instrument, 3D reconstruction, multi-core                                    b) an endoscope.
              optical fiber.

                                               I. I NTRODUCTION                                                      Optical sensors can be used in numerous medical instru-
                                                                                                                  ments such as endoscopes and catheters as illustrated in Fig-
                 The spatial information of a medical instrument inside                                           ure 1. They are well suited for the medical environment, since
              the patient during a procedure is crucial for the accurate                                          they are small in size, flexible, lightweight, immune to elec-
              manipulation of the instrument. There exist a range of clinical                                     tromagnetic interference and compatible with medical imaging
              applications which can benefit from the instruments spatial                                         modalities [5]. Thus, they have been utilized in numerous stud-
              information, such as epidural administration, colonoscopy,                                          ies to provide feedback from medical instruments. They have
              biopsies, and cardiac procedures [1], [2]. Among the afore-                                         been used to monitor muscle fatigue, cardiac activities and
              mentioned applications, in the case of epidural administration                                      body temperature [6]–[8]. In addition, they have been applied
              procedure, a catheter is inserted into the epidural space in                                        in cardiovascular diagnosis, artery pressure detection, artery
              order to deliver drugs for pain relief. In practice, most doctors                                   detection, intra-aortic balloon pumping, prostatic implants, and
              identify the epidural space based on the resistance felt through                                    urology [1], [9]. There are also many patents on medical
              the catheter and in some cases ultrasound or fluoroscopy is                                         instruments that use these sensors [10]–[13]. Particularly, FBG
              utilized. However, each method has their drawbacks, the tactile                                     sensors are used as force sensors to recognize the interface
              feedback is very subjective, the catheter can be invisible in ul-                                   between different tissues in order to aid in accurately placing
              trasound images and the patient is exposed to harmful radiation                                     a catheter in the epidural space [14]. They have also been used
              in fluoroscopy [3], [4]. An alternative to these methods is to                                      to display the shape of a colonoscope and the shape of a needle
              use optical sensors in the catheter for its spatial information.                                    in real-time [2], [15]. Moreover, FBG sensors have been ap-
                                                                                                                  plied to many different shape sensing applications. They have
                This project has received funding from the European Union’s Horizon                               been used for 3D shape recognition of solid objects, shape
              2020 research and innovation programme under grant agreement #688279
              (EDEN2020). It was also partially supported by the Spanish Ministry of                              recognition of flexible morphine wing and curvature detection
              Economy and Competitiveness under the project DIMENSION TEC2017-                                    of a continuum manipulator [16]–[18]. The studies presented
              88029- R. F. Khan, A. Denasi and S. Misra are affiliated with Surgical                              thus far use FBG sensors in single core fiber however FBG
              Robotics Laboratory, Department of Biomedical Engineering, University of
              Groningen and University of Medical Center Groningen, 9713 GZ, The                                  sensors can also be present in multi-core fiber. FBGs in multi-
              Netherlands. They are also affiliated with Department of Biomechanical                              core fiber have been shown to work as curvature sensor and 3D
              Engineering, Engineering Technology, University of Twente, 7522 NB, The                             shape sensor [19]–[25]. Multi-core fibers are more expensive
              Netherlands. D. Barrera, J. Madrigal and S. Sales are with the ITEAM
              Research Institute, Universitat Politècnica de València, Camino de Vera, 46022                    than single core fibers, whereas the cross sectional area of
              València, Spain.                                                                                   the shape sensor with multi-core fibers is smaller than the

     1558-1748 (c) 2018 IEEE. Personal use is permitted, but republication/redistribution requires IEEE permission. See http://www.ieee.org/publications_standards/publications/rights/index.html for more information.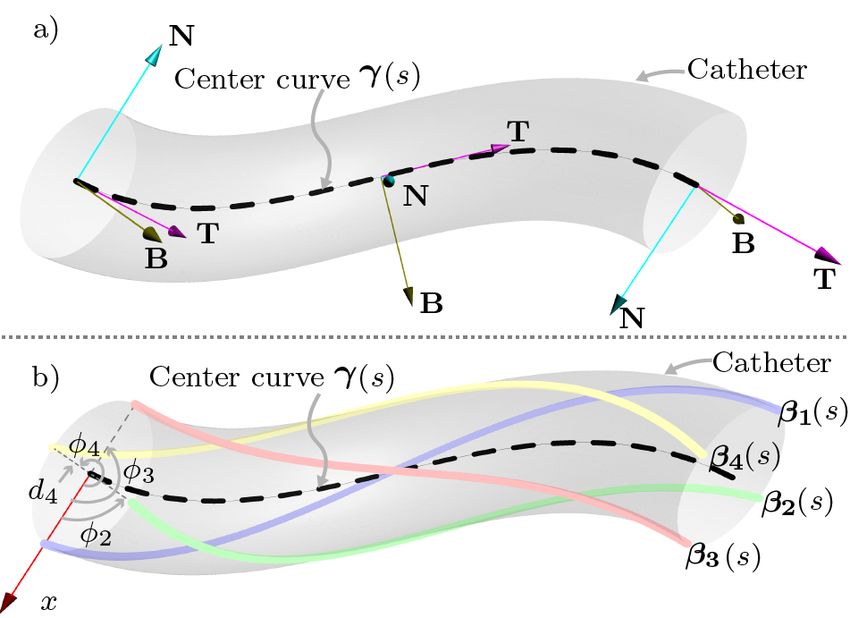
This article has been accepted for publication in a future issue of this journal, but has not been fully edited. Content may change prior to final publication. Citation information: DOI 10.1109/JSEN.2019.2905010, IEEE Sensors
                                                                                                                  Journal
                                                                                                                                                                                                                 2

              shape sensor with single core fibers. For certain instruments,
              such as the one used in this study, multi-core fibers have to
              be utilized due to the limited space. Moreover, in multi-core
              fibers the cores are mechanically coupled, the relative distance
              between the cores remain constant and the cores experience
              identical temperature. These properties make multi-core fibers
              more advantageous than single core fiber. Therefore, in this
              study, Fiber Bragg Grating (FBG) sensors written on multi-
              core optical fibers are used as shape sensors for flexible                                          Fig. 2. A Fiber Bragg Grating (FBG) sensor reflects back a certain range of
              instruments.                                                                                        wavelength, λ ∈ R>0 for a given input and transmits the rest. The Bragg
                                                                                                                  wavelength λB ∈ R>0 is the wavelength at which the power P ∈ R≥0 of
                 This study is unique for its application of several multi-                                       the reflected spectrum is the highest.
              core fibers with FBGs as a shape sensor for a catheter.
              More specifically, four multi-core fibers are used although a                                       wavelength is related to the applied strain and temperature as
              single multi-core fiber with 3 or more cores that have FBG                                          follows [27]:
              sensors is sufficient for reconstructing the shape of a flexible                                                         dλB
              instrument. Redundant number of multi-core fibers increases                                                                    = Sd + ΣdT,                    (1)
                                                                                                                                        λB
              the reliability of the sensing system against individual FBG
              sensor failure. A technique is presented in this article to                                         where S ∈ R is the gauge factor and Σ ∈ R is the temperature
              reconstruct the catheter’s center curve based on measurements                                       sensitivity. The differentials dλ, d and dT are of the wave-
              from the FBG sensors on the four multi-core fibers. The                                             length, strain and temperature, respectively. Integrating (1)
              technique is experimentally validated using Plexiglas plates                                        results in:
              and 3D printed rig which serve as ground truth. The theoretical                                                      λB
                                                                                                                                ln       = S( − 0 ) + Σ(T − T0 ),         (2)
              framework utilized in the study is presented in Section II. This                                                     λB0
              is followed by the description of the experimental setup and                                        where  ∈ R is the strain, T ∈ R is the temperature and λB0 ∈
              the corresponding shape reconstruction results in Section III.                                      R>0 is the reference Bragg wavelength at the reference strain
              Finally, the conclusion is provided in Section IV.                                                  0 ∈ R and reference temperature T0 ∈ R. The change in strain
                                                                                                                  and temperature are related to the FBG sensor measurements
                                    II. T HEORETICAL F RAMEWORK                                                   by (2). This relation can be used to obtain the strain when the
                                                                                                                  temperature remains constant i.e. T = T0 and the reference
                 This section presents the theoretical framework utilized to                                      strain (0 ) along with the reference Bragg wavelength (λB0 )
              reconstruct the shape of a catheter sensorized by four fibers                                       are known.
              inscribed with FBG sensors. The shape of the catheter is
              characterized by its center curve that is described in Sec-
                                                                                                                  B. Shape reconstruction for a single multi-core fiber
              tion II-C. The proposed reconstruction technique consists of
              the following four steps. First, the strain on each fiber is                                           The shape of a fiber is reconstructed using the curvature and
              calculated using the measurements obtained from the FBG                                             torsion parameters which can be calculated from the strains on
              sensors, as presented in Section II-A. Next, the curvature and                                      the fiber [28]. The fibers used in this study have four cores with
              the torsion of each fiber is calculated using those strains,                                        multiple sets of FBG sensors. A section of the fiber in pure
              Section II-B. Then, the curvature and torsion of the catheters                                      bending and a set of FBG sensors are shown in Figure 3. A
              center curve is determined based on the four fibers’ curvature                                      set consists for four FBG sensors that are co-located and have
              and torsion, Section II-C. Lastly, the catheters center curve                                       the same reference wavelength. The sensor sets are distributed
              is determined using the calculated curvature and torsion in                                         along the length of the fiber, L ∈ R>0 . The location of the sets
              conjunction with the Frenet-Serret equations in Section II-C.                                       on the fiber and other associated quantities such as strains are
                                                                                                                  parametrized using the arc length parameter, s ∈ R defined in
                                                                                                                  the interval Ω ⊂ R with Ω = (0, L). The arc length is defined
              A. Strain calculation based on FBG sensors                                                          for the neutral axis of the fiber. The relation between the strain
                 The strain on an individual fiber can be calculated at                                           i on an FBG sensor in core i and the curvature κ is based
              discretized locations where the FBG sensors are present.                                            on mechanics of a bending beam presented in Chapter 6.3 of
              An FBG is a periodic or quasi-periodic modulation of the                                            [28]. The relation is given as:
              refractive index of the fiber core. This perturbation causes light
                                                                                                                                  i (s) = −κ(s)yi (s) = −κ(s)ri cos(θi (s)),                                 (3)
              to be coupled from the incident core mode to the core mode
              propagated in the opposite direction [26]. Thus, part of the                                        where i : Ω → R is the strain, κ : Ω → R is the curvature
              light spectrum is reflected back and the wavelength at which                                        and i ∈ {a, b, c, d} is the index of the four cores. Further,
              the reflection is the highest is called the Bragg wavelength,                                       yi : Ω → R is the orthogonal distance between the neutral
              λB ∈ R>0 . Figure 2 illustrates an FBG sensor and its working                                       surface and the FBG sensor on core i, ri ∈ R>0 is the radial
              principle.                                                                                          distance from the center of the fiber cross-section to the FBG
                 If the FBG sensor experiences strain or change in temper-                                        sensor on core i and θi : Ω → (−π, π] is the angle between
              ature, then the Bragg wavelength, λB , is shifted. The Bragg                                        the curvature direction vector α : Ω → R3 and ri (see Figure

     1558-1748 (c) 2018 IEEE. Personal use is permitted, but republication/redistribution requires IEEE permission. See http://www.ieee.org/publications_standards/publications/rights/index.html for more information.
This article has been accepted for publication in a future issue of this journal, but has not been fully edited. Content may change prior to final publication. Citation information: DOI 10.1109/JSEN.2019.2905010, IEEE Sensors
Journal
3
Fig. 3. Multi-core fiber with one set of Fiber Bragg Grating (FBG) sensors.
The arc length of the neutral axis is represented with the variable s ∈ R
defined in the interval Ω ⊂ R with Ω = (0, L). The index i for the cores
are a, b, c and d, respectively. At a given cross-section with FBG sensors,
the curvature direction vector α(s) is orthogonal to the neutral surface. The
angle between α(s) and core a is θa , whereas the angles between core a
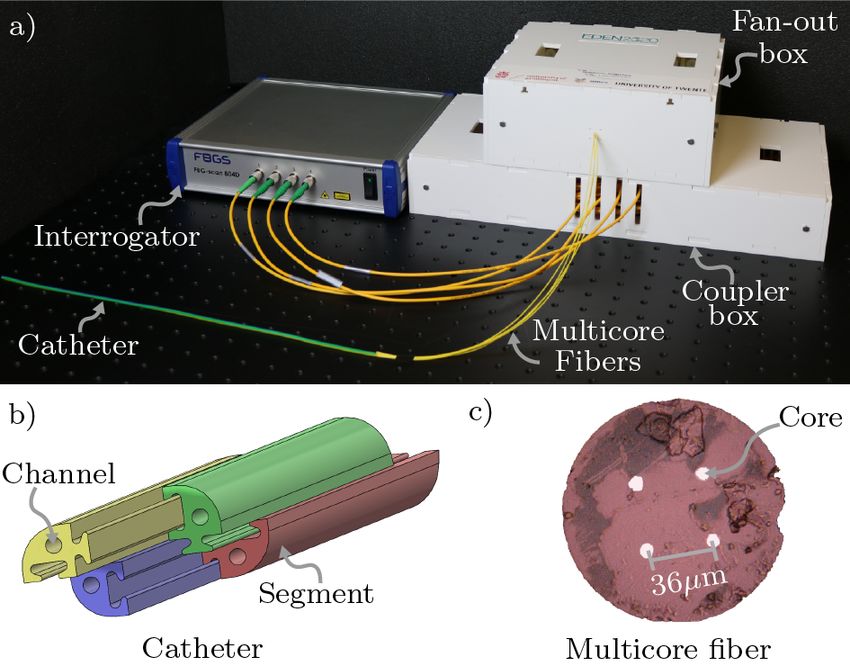
and the other cores are θab , θac and θad , respectively. The radial distance Fig. 4. a) The center curve of the catheter with the Frenet-Serret frames b)
from the center of the fiber to the center of the cores are labeled as ra , rb , Catheter with four multi-core fibers where each fiber is represented with a
rc and rd , respectively. The perpendicular distance from the neutral surface curve β 1 : Ω → R3 , β 2 : Ω → R3 , β 3 : Ω → R3 and β 4 : Ω → R3 ,
to the cores a and c are ya and yc , respectively. respectively. The distance from the center of the catheter to fiber 4 is d4 ∈
R>0 . The angles from the reference x-axis to fiber 2, 3, and 4 are φ2 , φ3
and φ4 , respectively. The center curve of the catheter is γ(s) where s is the
3). The curvature direction α(s) in this study is a unit vector arc length parameter of the curve.
that lies on the plane of a fiber cross section. Further, it is
orthogonal to the neutral surface and it points towards the By solving (10) for v(s), a solution for the angle θa (s) and
compressed region of the cross section. curvature κ(s) can be found. The solution v(s) from (10) can
The measurement im : Ω → R from the FBG sensor in be computed as:
core i includes the effects of both the change in strain and
temperature experienced by the FBG sensor. According to (2) v(s) = M† m (s), (11)
the measurement im (s) is
where M† is the Moore-Penrose pseudo-inverse of M. Using
im (s) = Si (i (s) − i0 ) + Σi (T (s) − T0 (s)), (4) the relation (11), the curvature κ(s), the torsion τ (s) with
τ : Ω → R and the angle θa (s) can be obtained as follows:
where the subscript m denotes a measurement. Substituting q
(3) in (4) results in κ(s) = v12 (s) + v22 (s), (12)
θa (s) = atan2 (v2 (s), v1 (s)) , (13)
im (s) = Si (−κ(s)ri cos(θi (s)) − i0 ) + Σi (T (s) − T0 (s)).
(5) dθa (s)
τ (s) = . (14)
In the following derivations, it is assumed that the term ds
Σi (T (s) − T0 (s)) in (5) is the same for all the four cores In (12), the positive solution is selected for the curvature
due to the close proximity of the cores. For the ease of the because the Frenet-Serret formulation assumes κ > 0. The
following derivations, the term Σi (T (s) − T0 (s)) is repre- sign of the curvature determines the direction of bending in
sented by a new variable t (s). In addition, by selecting the a planar curve, however for 3D curves the torsion is used
reference strain to be zero the following equations apply to for the bending direction. The derivative operator introduced
the measurements from the sensors in the four cores: for the torsion parameter τ (s) in (14) can be numerically
approximated as follows:
am (s) = −Sa κ(s)ra cos(θa (s)) + t (s), (6)
θa (s) − θa (s − ∆s)
bm (s) = −Sb κ(s)rb cos(θa (s) + θab ) + t (s), (7) τ (s) ≈ (15)
∆s
cm (s) = −Sc κ(s)rc cos(θa (s) + θac ) + t (s), (8) where ∆s is the difference in the arc length between the two
dm (s) = −Sd κ(s)rd cos(θa (s) + θad ) + t (s), (9) consecutive FBG sensor sets. Consequently, the curvature and
torsion for a single fiber can be found using (12) and (14) at
where θab = π2 , θac = π and θad = 3π 2 for the multi-core the locations where the FBG sensor sets are present.
fiber used in this study. The relations given by (6)-(9) can be
represented in matrix form as follows: C. Center curve reconstruction for a catheter
am (s)
−Sa ra 0
1 The curvature (12) and torsion (14) derived for an individual
bm (s) 0 κ(s) cos(θa (s)) fiber in the previous section are used to obtain the curvature
Sb rb 1
cm (s) = Sc rc
κ(s) sin(θa (s)) . and torsion of the center curve of the catheter shown in Figure
0 1
t (s) 4. In the following derivation, it is assumed that the center
dm (s) 0 −Sd rd 1 | {z }
| {z } | {z } v(s) curve is represented as a unit speed space curve that is smooth
m (s) M and has a non-zero curvature along its arc length [29]. This
(10) curve can be reconstructed with the knowledge of its own
1558-1748 (c) 2018 IEEE. Personal use is permitted, but republication/redistribution requires IEEE permission. See http://www.ieee.org/publications_standards/publications/rights/index.html for more information.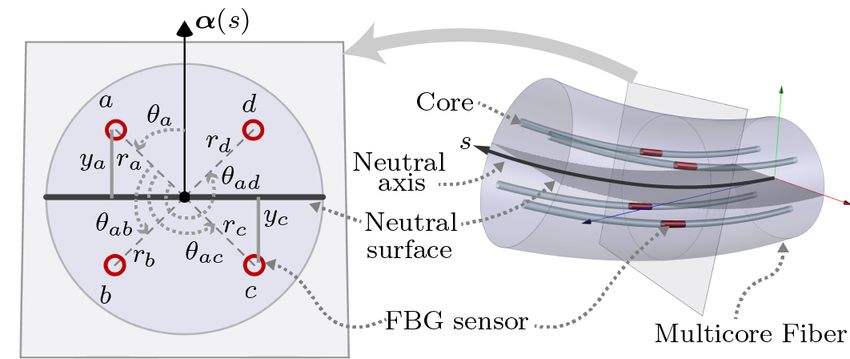
This article has been accepted for publication in a future issue of this journal, but has not been fully edited. Content may change prior to final publication. Citation information: DOI 10.1109/JSEN.2019.2905010, IEEE Sensors
Journal
4
e : Ω → R and torsion τe : Ω → R parameters using
curvature κ respectively. The following algorithms are described for the
the Frenet-Serret equations as follows: case of 6 FBG sensor sets and 118 interpolation points.
dγ(s) However, they can be generalized to arbitrary numbers of FBG
= T(s), (16) sensor sets and interpolation points.
ds
dT(s) Algorithm 1 Reconstruction of the center curve of the catheter.
=κ
e(s)N(s), (17)
ds Input λi is a 4 × 6 matrix; each column is the data from one
dN(s) FBG set on the ith fiber. Output γ is a 3×118 matrix that holds
= −e
κ(s)T(s) + τe(s)B(s), (18)
ds the 3D co-ordinates of the 118 points of the catheter’s center
dB(s) curve. Variables κi , τ i , κcath and τ cath are 1 × 6 vectors.
= −e
τ (s)N(s), (19)
ds Variables κinterp , τ interp and l are 1 × 118 vectors. X0 is a
where γ : Ω → R3 is the position vector, T : Ω → R3 , 4 × 4 matrix
N : Ω → R3 and B : Ω → R3 are the tangent, the normal and Input: λi where i = (1, 2, 3, 4)
the bi-normal orthogonal vectors, respectively. The relations Output: γ
(16)-(19) can be rewritten in matrix form as follows: ReconstructCath:
1: for i = 1 to 4 do
d
X(s) = X(s)A(s), (20) 2: [κi , τ i ] ← getShape(λi )
ds
3: end for
where the pose X(s) : Ω → SE(3) and the twist A(s) : Ω → 4: κcath ← mean(κ1 , κ2 , κ3 , κ4 )
se(3) are given by: 5: τ cath ← mean(τ 1 , τ 2 , τ 3 , τ 4 )
6: κinterp ← linear interpolation κcath
R(s) γ(s) T(s) N(s) B(s) γ(s)
X(s) = = 7: τ interp ← linear interpolation τ cath
0T3 1 0 0 0 1
8: l ← points on catheter center curve at which the values
(21) of κcath and τ cath are interpolated
9: X0 ← initial condition
0 −e κ(s) 0 1
10: γ ← reconstruct( κinterp , τ interp , l, X0 )
κ (s) 0 −eτ (s) 0
A(s) = . (22)
e
0 11: return γ
τe(s) 0 0
0 0 0 0
Algorithm 2 The getShape function in Algorithm 1. Input λ
In (21), R(s) = T(s) N(s) B(s) with R : Ω → SO(3)
is 4 × 6 matrix, each column is the data from one FBG set on
describes the orthonormal frame in terms of the vectors T(s),
the fiber. Output κ and τ are 1 × 6 vectors, the ith element
N(s), and B(s) [30]. Further, 03 is a three dimensional vector
is the curvature and torsion value at the ith FBG set location
of zeros. The aforementioned frame is illustrated at three
on the fiber. The value ra = rb = rc = rd = 25.46 µm, this
different locations on the center curve of the catheter in Figure
is from the manufacture’s datasheet for the fiber. The strain
4a. In order to reconstruct the center curve described by the
gauge factor Sa = Sb = Sc = Sd = 0.777 that is the default
position vector γ(s), the relation (20) should be solved. The
value from the interrogator’s user manual [31].
solution to (20) can be obtained assuming that A(s) is held
constant between two consecutive discretized locations on the Input: λ
center curve. Thus, Equation 20 can be discretized as: Output: κ, τ
getShape:
X(s + ∆s) = X(s) exp (A(s)∆s) . (23) 1: for j = 1 to 6 do
2: for i = 1 to 4 do
Consequently, the position vector γ(s) can be extracted from
λ(i, j)
the last column of the solution given by (23). The center curve 3: m (i) ← ln
of the catheter described by the vector γ(s) and the shape of λB0 (i, j)
4: end for
each individual fiber described by βj : Ω → R3 (see Figure
5: κ(j) ← solution to (12)
4b) are related as follows:
6: τ (j) ← solution to (15)
βj (s) = γ(s) + dj (−cos(φj )N (s) + sin(φj )B(s)) (24) 7: end for
8: return [ κ, τ ]
where j ∈ {1, 2, 3, 4} is the index of the fiber. Further, dj ∈
R>0 is the distance from the center of the catheter to the j th
fiber’s center and φj is the angle between the x axis and the III. E XPERIMENTS
vector from the center of the catheter to the center of the The reconstruction technique presented in Section II is
j th fiber (see Figure 4b) [29]. For a given small dj in (24), validated with experimental setup that is described in Section
βj (s) ≈ γ(s) holds. Consequently, the curvature and torsion III-A and the results are given in Section III-B.
calculated for the fibers can be used for the reconstruction of
the center curve of the catheter. A. Experimental setup
The theoretical framework described throughout the Section The hardware used in the experiments is shown in Figure 5.
II can be implemented using the Algorithms 1, 2 and 3, The catheter is 2.5 mm in diameter and has 4 segments that
1558-1748 (c) 2018 IEEE. Personal use is permitted, but republication/redistribution requires IEEE permission. See http://www.ieee.org/publications_standards/publications/rights/index.html for more information.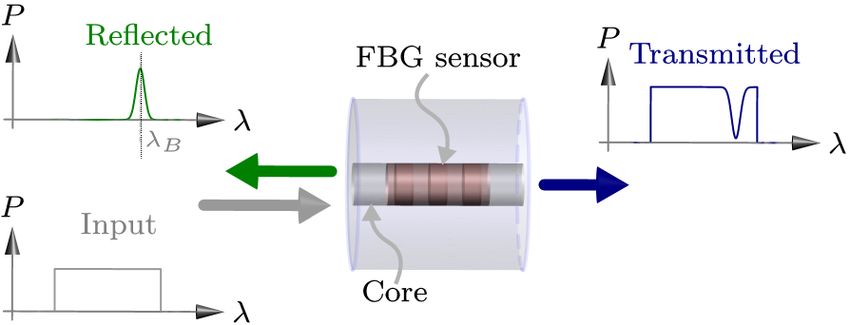
This article has been accepted for publication in a future issue of this journal, but has not been fully edited. Content may change prior to final publication. Citation information: DOI 10.1109/JSEN.2019.2905010, IEEE Sensors
Journal
5
Algorithm 3 The reconstruct function in Algorithm 1. The TABLE I
inputs κ, τ , l are 1×118 vectors. κ and τ contain the curvature D ESCRIPTION OF THE GROUND TRUTH CONFIGURATIONS . C1 AND C2 ARE
PLANAR CURVES WITH CONSTANT CURVATURE . C3 - C5 ARE PLANAR
and torsion of the catheter’s center curve at the arclength given
CURVES AND THE CURVATURE INCREASES LINEARLY ALONG THE ARC
in l, respectively. X0 is a 4 × 4 matrix that holds the initial LENGTH . C6 - C8 ARE THREE DIMENSIONAL CURVES WITH CONSTANT
value of the catheter’s center curve. CURVATURE AND CONSTANT TORSION .
Input: κ, τ , l, X0
Config Curvature (mm−1 ) Torsion (mm−1 )
Output: ρ C1 constant: 0.0057 constant: 0
reconstruct: C2 constant: 0.0020 constant: 0
1: X(1) ← X0 C3 linearly varying: 4e−3 to 12.5e−3 constant: 0
C4 linearly varying: 4e−3 to 10e−3 constant: 0
2: ρ ← the fourth column of X(1)
C5 linearly varying: 4e−3 to 8.3e−3 constant: 0
3: for i = 1 to 118 do C6 constant: 16.7e−3 constant: 2.77e−4
0 −e κ(i) 0 1 C7 constant: 14.3e−3 constant: 6.11e−4
κ e(i) 0 −e τ (i) 0 C8 constant: 12.5e−3 constant: 3.12e−4
4: A← 0
from (22)
τe(i) 0 0
0 0 0 0
5: if i > 1 then
6: δ ← l(i) − l(i − 1)
7: else
8: δ←1
9: end if
Fig. 6. Representative images of the ground truth configurations. a) Computer
10: X(i + δ) ← X(i) exp(Aδ) from (23) Aided Design (CAD) model of configuration C1, which is a planar curve with
11: ρ(i + δ) ← the fourth column of X(i + δ) a constant curvature of 0.0057 mm−1 . Configurations C1 till C5 are created
12: end for by laser cutting Plexiglas plates. b) CAD model of configuration C7, which is
a curve with constant curvature of 14.3e−3 and constant torsion of 6.11e−4 .
13: return ρ Configurations C6 till C8 are 3D printed.
are interlocked and the segments can slide relative to each all the cores, as a result the FBG sensors in all cores are co-
other [32]. Every segment has a channel, thus four multi-core located and have the same wavelength. The reference Bragg
fibers can be placed in the catheter. The fibers have four cores wavelength of the FBG sensors is unique for every set. The
that are straight and in a cross sectional view of the fiber the data from the FBG sensors of one set is required for the
cores fall on the corners of a 36 µm wide square. There are curvature and torsion calculations. Thus, every fiber has 6
6 sets of 10 mm long FBG sensors that are equally spaced locations where the curvature and torsion can be calculated.
over a distance of 118 mm on every fiber. A set consists of The fan-out box holds four fan-outs, each fan-out connects
4 FBG sensors, one on each core, with the same reference the 4 cores of a multi-core fiber to four single core fibers.
Bragg wavelength. The sets are inscribed using continuous The 16 outputs from the fan-out box are merged to 4 outputs
wave frequency-doubled Argon-ion laser and a phase mask using four 1 × 4 optical couplers in order to measure them
technique. The FBG sensors are simultaneously inscribed in using the channels of the interrogator. Lastly, the interrogator
is the device which provides the light source and measures the
reflected light from the FBGs in the fibers.
The catheter is designed by the Mechatronics In Medicine
Lab (London, United Kingdom) and produced by Xograph
(Stonehouse, United Kingdom). The FBG sensors are in-
scribed on the multi-core fiber in the iTeam lab (Valencia,
Spain). The multi-core fibers and the fan-outs are from Fiber-
core (Southampton Science Park, United Kingdom) and the
product number is FAN-4C and SM-4C1500, respectively. The
optical couplers are from Newport Corporation (California,
USA) with the product number F-CPL-B14350-FCAPC. The
model of the interrogator is FBG-scan 840D from FBGS
International NV (Geel, Belgium).
The catheter is sensorized by inserting four multi-core
fibers into the channels of the catheter’s segments and fixing
the fibers at the base of the catheter. The experiments to
validate the reconstruction procedure consists of placing the
sensorized catheter in known configurations and observing the
Fig. 5. a) The experimental setup consists of an interrogator, a coupler box,
a fan-out box, multi-core fibers and a multi-segment catheter. b) The catheter
error between the known configuration and the reconstructed
consists of four segments and channels for multi-core fiber. c) Photograph of catheter shape. The values of curvature and torsion in the
the multi-core fiber’s cross sectional view under a microscope. configurations were selected such that they are similar to
1558-1748 (c) 2018 IEEE. Personal use is permitted, but republication/redistribution requires IEEE permission. See http://www.ieee.org/publications_standards/publications/rights/index.html for more information.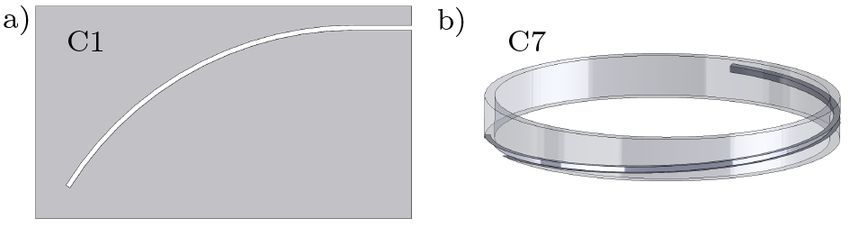
This article has been accepted for publication in a future issue of this journal, but has not been fully edited. Content may change prior to final publication. Citation information: DOI 10.1109/JSEN.2019.2905010, IEEE Sensors
Journal
6
the values expected in future in-vitro and ex-vivo studies. a) 120
b) c) d)
Past experiments with similar catheters show that it can take
on curvatures in the range of 0.002 mm−1 to 0.02 mm−1 ; 100
thus, the curvature values within that range are selected for
the configurations. The catheter is expected to have min-
imal torsion as a result small torsion values are used in 80
this study [33]. Table I gives the description of the eight
configurations used for validating the reconstruction procedure 60
and the Computer Aided Design (CAD) of configurations C1
and C7 are illustrated in Figure 6.
40
B. Shape Reconstruction Results
20
The sensorized catheter is placed in all of the configurations
described in Table I. For every configuration the data from
the interrogator is collected and the catheter’s center curve is 0
-80 -60 -40 -20 0
reconstructed offline in MATLAB according to Algorithm 1.
The reconstruction of the fiber and the catheter is compared to
the ground truth via absolute error re ∈ R≥0 , normalized error a) b) 1c) d)
ren ∈ R≥0 and mean error rem ∈ R≥0 which is calculated as
0.8
follows:
0.6
re (k) = krgt (k) − γ(k)k, (25)
0.4
re (k)
ren (k) = , (26) 0.2
k
n
1X 0
rem = re (k), (27) 0 20 40 60 80 100 120
n
k=1
where, k ∈ Z≥0 representing the 118 points along the arc
length at which the error calculation is conducted, rgt ∈ R3 a) b) c) 5d)
is the ground truth curve and γ is the reconstruction based on
proposed technique from Section II. The reconstruction and the
error re in reconstruction over the arc length for the catheter
is shown in Figure 7 and the maximum error measures re = 0
max(re ) and ren = max(ren ) in conjunction with the mean -100
error for catheter is given in Table II.
-50
TABLE II
C ATHETER R ECONSTRUCTION ERRORS . 80
60
re = MAX(re ) AND ren = MAX(ren ) WHERE re AND ren ARE FROM (25) 40
0 20
AND (26), RESPECTIVELY. rem IS FROM (27). 0
Config C1 C2 C3 C4 C5 C6 C7 C8
a) b) c) d)
re (mm) 0.96 0.19 0.54 0.82 1.05 0.49 0.84 0.41 0.8
ren (%) 0.9 0.2 0.8 0.7 0.9 0.4 0.7 0.4
rem (mm) 0.44 0.12 0.35 0.13 0.21 0.13 0.23 0.12
0.6
The reconstruction error re as defined in (25) is shown in
0.4
Figure 7b and 7d. The error increases with the arc length be-
cause the reconstruction is conducted by numerical integration 0.2
thus the error accumulates. However, the maximum absolute
error and maximum mean error in the 8 configurations is 0
1.05 mm and 0.44 mm, respectively. This error can be due 0 20 40 60 80 100 120
to the difference between the catheter center curve and the 1
configuration curve caused by placement inaccuracies during Fig. 7. a) Reconstruction plots of the planar curves, configuration C1-C5. b)
the experiments. It could also be due to misalignment in The error re plot along the arc length of the catheter for the planar curves,
the longitudinal axis of the FBGs in the four fibers due to configuration C1-C5. c) Reconstruction plots of the 3D curves, configuration
C6-C8. d) The error re plot along the arc length of the catheter for the 3D
misplacement of the fibers in the catheter. Lastly, since the curves, configuration C6-C8.
fibers were not fixed along the length of the catheter the twist
experienced by the catheter may not be transferred completely
to the fibers.
1558-1748 (c) 2018 IEEE. Personal use is permitted, but republication/redistribution requires IEEE permission. See http://www.ieee.org/publications_standards/publications/rights/index.html for more information.This article has been accepted for publication in a future issue of this journal, but has not been fully edited. Content may change prior to final publication. Citation information: DOI 10.1109/JSEN.2019.2905010, IEEE Sensors
Journal
7
IV. C ONCLUSIONS [14] B. Carotenuto, A. Micco, A. Ricciardi, E. Amorizzo, M. Mercieri,
A. Cutolo, and A. Cusano, “Optical guidance systems for epidural space
A shape reconstruction technique which uses redundant identification,” IEEE Journal of Selected Topics in Quantum Electronics,
number of multi-core fibers with FBG sensors as shape vol. 23, no. 2, pp. 371–379, 2017.
[15] R. J. Roesthuis, M. Kemp, J. J. van den Dobbelsteen, and S. Misra,
sensor for flexible medical instruments is proposed in this “Three-dimensional needle shape reconstruction using an array of fiber
work. The technique is validated on a multi-segment catheter bragg grating sensors,” IEEE/ASME Transactions on Mechatronics,
where each segment contains a multi-core fiber with FBG vol. 19, no. 4, pp. 1115–1126, Aug 2014.
[16] L. Xu, J. Ge, J. H. Patel, and M. P. Fok, “3-dimensional soft shape sensor
sensors inscribed on it. The presence of several multi-core based on dual-layer orthogonal fiber bragg grating mesh,” in Proceedings
fibers increases the reliability of the shape sensing system of the Optical Fiber Communications Conference and Exhibition (OFC),
against sensor failure. The proposed technique is experimen- pp. 1-3, California, USA, March 2017.
[17] G. Sun, Y. Wu, H. Li, and L. Zhu, “3d shape sensing of flexible morphing
tally validated for 8 different configurations where a maximum wing using fiber bragg grating sensing method,” Optik, vol. 156, pp. 83
reconstruction error of 1.05 mm is observed. Further, it can – 92, 2018.
be deduced that shape sensing using several multi-core fibers [18] S. Sefati, M. Pozin, F. Alambeigi, I. Iordachita, R. H. Taylor, and
M. Armand, “A highly sensitive fiber bragg grating shape sensor for
for flexible medical instruments is feasible. continuum manipulators with large deflections,” in Proceedings of IEEE
Sensors, pp. 1-3, Glasgow, UK, Oct 2017.
ACKNOWLEDGMENTS [19] F. M. Araújo, L. A. Ferreira, and J. L. Santos, “Simultaneous deter-
mination of curvature, plane of curvature, and temperature by use of
The authors would like to thank the Mechatronics In a miniaturized sensing head based on fiber bragg gratings,” Applied
Medicine Lab (Imperial College London) for providing the Optics, vol. 41, no. 13, pp. 2401–2407, 2002.
[20] D. Zheng, J. Madrigal, H. Chen, D. Barrera, and S. Sales, “Multicore
computer aided design and the samples of the catheter. We fiber-bragg-grating-based directional curvature sensor interrogated by a
appreciate the help of Luigi Capuano (Surface technology and broadband source with a sinusoidal spectrum,” Optics Letters, vol. 42,
tribology group, University of Twente) for generating the cross no. 18, pp. 3710–3713, 2017.
[21] G. M. H. Flockhart, W. N. MacPherson, J. S. Barton, J. D. C. Jones,
sectional photograph of the multi-core fiber. L. Zhang, and I. Bennion, “Two-axis bend measurement with bragg
gratings in multicore optical fiber,” Optics Letters, vol. 28, no. 6, pp.
387–389, 2003.
R EFERENCES [22] J. P. Moore and M. D. Rogge, “Shape sensing using multi-core fiber
optic cable and parametric curve solutions,” Optics Express, vol. 20,
[1] D. Tosi, E. Schena, C. Molardi, and S. Korganbayev, “Fiber optic no. 3, pp. 2967–2973, 2012.
sensors for sub-centimeter spatially resolved measurements: Review and [23] J. P. Moore, “Shape sensing using multi-core fiber,” in Proceedings of
biomedical applications,” Optical Fiber Technology, vol. 43, pp. 6 – 19, Optical Fiber Communications Conference and Exhibition (OFC), pp.1-
2018. 3, California, USA, March 2015.
[2] Y. Xinhua, W. Mingjun, and C. Xiaomin, “Deformation sensing of [24] D. Barrera, I. Gasulla, and S. Sales, “Multipoint two-dimensional
colonoscope on fbg sensor net,” TELKOMNIKA : Indonesian Journal curvature optical fiber sensor based on a nontwisted homogeneous four-
of Electrical Engineering, vol. 10, pp. 2253–2260, 2012. core fiber,” Journal of Lightwave Technology, vol. 33, no. 12, pp. 2445–
[3] M. Nikooseresht, M. Hashemi, S. A. Mohajerani, F. Shahandeh, and 2450, 2015.
M. Agah, “Ultrasound as a screening tool for performing caudal epidural [25] A. Denasi, F. Khan, K. J. Boskma, M. Kaya, C. Hennersperger,
injections,” Iranian Journal of Radiology, vol. 11, no. 2, 2014. R. Göbl, M. Tirindelli, N. Navab, and S. Misra, “An observer-based
[4] H. Gharries, “Is ultrasound guided spine injection safe,” Journal of fusion method using multicore optical shape sensors and ultrasound
Anesthesia & Critical Care: Open Acesss, vol. 10, no. 4, pp. 131–138, images for magnetically-actuated catheters,” in Proceedings of the IEEE
2018. International Conference on Robotics and Automation (ICRA), pp. 50-
[5] V. Mishra, N. Singh, U. Tiwari, and P. Kapur, “Fiber grating sensors in 57, Brisbane, Australia, May 2018.
medicine: Current and emerging applications,” Sensors and Actuators [26] K. O. Hill and G. Meltz, “Fiber bragg grating technology fundamentals
A: Physical, vol. 167, no. 2, pp. 279 – 290, 2011. and overview,” Journal of Lightwave Technology, vol. 15, no. 8, pp.
[6] D. Polito, M. A. Caponero, A. Polimadei, P. Saccomandi, C. Massaroni, 1263–1276, 1997.
S. Silvestri, and E. Schena, “A needle like probe for temperature moni- [27] J. V. Roosbroeck, C. Chojetzki, J. Vlekken, E. Voet, and M. Voet,
toring during laser ablation based on fiber bragg grating: Manufacturing “A new methodology for fiber optic strain gage measurements and its
and characterization,” Journal of Medical Devices, vol. 9, no. 4, 2015. characterization,” in Proceedings of the SENSOR+TEST Conferences,
[7] K. Chethana, A. S. G. Prasad, S. N. Omkar, and S. Asokan, “Fiber bragg vol. OPTO 2 - Optical Fiber Sensors, pp.59 - 64, Nürnberg, Germany,
grating sensor based device for simultaneous measurement of respiratory May 2009.
and cardiac activities,” Journal of Biophotonics, vol. 10, no. 2, pp. 278 [28] R. C. Hibbeler, Mechanics of materials, 8th ed. Upper Saddle River,
– 285, 2017. New Jersey, United States: Pearson Prentice Hall, 2011.
[8] P. F. Nascimento, A. P. G. O. Franco, R. Fiorin, M. A. de Souza, H. J. [29] A. Gray, Modern Differential Geometry of Curves and Surfaces with
Kalinowski, and I. Abe, “Case study of muscle fatigue in parafunctional Mathematica. Boca Raton, Florida, United States of America: Chapman
patient using occlusal device with fiber bragg grating sensors,” Journal of & Hall/CRC, 2006.
microwaves, optoelectronics and electromagnetic applications, vol. 17, [30] S. Patil, J. Pan, P. Abbeel, and K. Goldberg, “Planning curvature
no. 2, pp. 306 – 318, 2018. and torsion constrained ribbons in 3d with application to intracavitary
[9] S. C. M. Ho, W. Li, M. Razavi, and G. Song, “Fiber bragg grating based brachytherapy,” IEEE Transactions on Automation Science and Engi-
arterial localization device,” Smart Materials and Structures, vol. 26, pp. neering, vol. 12, no. 4, pp. 1332–1345, 2015.
1–10, 2017. [31] Manual ‘ILLumiSense’ software, Version 2.3, FBGS International, Bell
[10] G. W. T. Hooft, “Optical shape sensing system and method for sensing Telephonelaan 2H, Geel Belgium.
a position and/or shape of a medical device using backscatter reflectom- [32] A. Leibinge, M. J. Oldfield, and F. B. Rodriguez, “Minimally disruptive
etry,” Patent US20 180 128 600A1, June 08, 2016. needle insertion: a biologically inspired solution,” INTERFACE FOCUS,
[11] G. Leo, N. Aeby, and D. Inaudi, “Medical apparatus system having vol. 6, no. 3, 2016.
optical fiber sensing capability,” Patent US9 907 618B2, Jan 25, 2012. [33] L. Frasson, F. Ferroni, S. Y. Ko, G. Dogangil, and F. Rodriguez y
[12] D. K. Gifford, F. Barbagli, S. Y. Chang, A. B. Kowshik, O. J. Wagner, Baena, “Experimental evaluation of a novel steerable probe with a
M. D. Paris, and M. E. Froggatt, “Force sensing in a distal region of programmable bevel tip inspired by nature,” Journal of Robotic Surgery,
an instrument including single-core or multi-core optical fiber,” Patent vol. 6, no. 3, pp. 189–197, 2012.
US20 180 128 599A1, March 06, 2018.
[13] T. Bosselmann and O. Schuetz, “Medical instrument for insertion
into an examination subject, and medical examination/treatment device
employing same,” Patent US6 470 205B2, Oct 22, 2002.
1558-1748 (c) 2018 IEEE. Personal use is permitted, but republication/redistribution requires IEEE permission. See http://www.ieee.org/publications_standards/publications/rights/index.html for more information.You can also read