STRAIN-BASED DAMAGE ASSESSMENT OF STIFFENED COMPOSITE PANELS FOR STRUCTURAL HEALTH MONITORING PURPOSES
←
→
Page content transcription
If your browser does not render page correctly, please read the page content below
IX ECCOMAS Thematic Conference on Smart Structures and Materials
 SMART 2019
 A. Benjeddou, N. Mechbal and J.F. Deü (Eds)

 STRAIN-BASED DAMAGE ASSESSMENT OF STIFFENED
 COMPOSITE PANELS FOR STRUCTURAL HEALTH MONITORING
 PURPOSES

 DIMITRIOS P. MILANOSKI AND THEODOROS H. LOUTAS

 Laboratory of Applied Mechanics and Vibrations
 Dept. of Mechanical Engineering and Aeronautics, University of Patras
 Patras University Campus, GR-26504, Rio-Patras, Greece
 e-mail: d.milanoski@g.upatras.gr; thloutas@upatras.gr

Key words: Parametric finite element model, Composite stiffened panel, Structural health
monitoring, Fiber Bragg gratings, Non-linear buckling analysis.

Abstract. A common defect of composite stiffened panel structures is the disbond at the
interface between the two constituents (skin/stringer), as a result of inefficient manufacturing
process or foreign object impacts in service. Generally, discontinuities within the volume of an
elastic solid media subjected to mechanical load, cause anomalies on the strain field in the near
vicinity of the discontinuity. Utilizing this observation, the current work investigates the effect
of artificially induced disbonds between skin/stiffener at a co-cured CFRP/epoxy single-
stiffener generic element. A structural health monitoring methodology is developed, leveraging
on numerically simulated strains along the stringer foot which aims to assess the health state of
the sensorized structure as compared with a pristine baseline. The study is implemented with a
parametric finite element model generating various disbonded cases. Longitudinal strain values
are acquired at the exact points where in reality actual Fiber Bragg Grating sensors will be
located.

1 INTRODUCTION

 Primary airframe structures made of composites tend to increasingly replace more
conventional materials. Their advantages correlate to the high specific mechanical properties
over metallic materials. Nevertheless, these materials suffer from hidden damages, such
delaminations/disbonds which arise major concerns if not identified at an early stage. In this
direction, researchers utilize Structural Health Monitoring technologies to identify and assess
damage. Fiber optic sensors (FOS) technology has gained increasing popularity as an
alternative method of real-time strain measurements during structural service with minimum
additive weight. A popular category of FOS are fiber Bragg grating sensors (FBGs) [1]. Quite
a few researchers developed health monitoring methodologies like Li et al. [2], who proposed
an automated algorithm based on static strain FBG readings on naval composite T-joints. A
baseline of the pristine specimen was developed through which disbond cases were qualitatively
Dimitrios P. Milanoski and Theodoros H. Loutas

detected. A new method to identify strain modification along disbonds, exploiting Artificial
Neural Networks (ANNs), was proposed by Kesavan and co-authors on the aforementioned
specimens [3]. Takeda et al. [4] investigated interlaminar damage occurred by low-velocity
impacts on CFRP stiffened panels. They used embedded FBGs to monitor the reflection spectra
using the central wavelength of the sensors. A framework utilizing FBG strain readings was
proposed by Airoldi et al. [5]. The authors developed an integrated Health and Usage
Monitoring System (HUMS) of composite spars belong to wing-box, aiming to monitor both
load and damage. A study based on static strains obtained by closely placed optical fibers with
FBGs, was implemented in [6]. In this case, the differential strain of closely attached sensors
placed away from damage, maintained a linear relation with respect to a reference strain, while
sensors closest to damage showed a non-linear behavior. Sbarufatti et al. [7] followed a model-
based methodology leveraging on a global-local finite element model of a helicopter tail boom
in order to evaluate real fatigue crack propagation events. Damage detection was enabled by
utilizing the Mahalanobis distance, considering a damage index calculated at each sensor. The
methodology was validated experimentally using permanently placed FBGs to record strain
data. Finally, a parametric numerical model was created by Zarouchas and Alderliesten [8] to
evaluate the damage tolerance capabilities of aluminum stiffened panels. A non-linear buckling
analysis was applied, and critical stability aspects of the panel regarding the disbond
characteristics, i.e. position and size were highlighted.
 The objective of the present paper is to study the effect of disbonds in the strain-field
developed on the feet of single-stiffener panels (SSPs) and propose strain-based Health
Indicators (HIs) capable of identifying and monitoring structural damage and specifically
skin/stringer disbonding. Parametric numerical modeling is implemented to this direction.

2 NUMERICAL ANALYSIS

 The numerical modeling procedure is presented in the following. First, the SSP specimen is
introduced and its geometrical characteristics are detailed. The test article is consisting of two
individual parts, a thin composite flat plate, the skin, and a composite T-section stiffening beam,
called i.e. the stringer. The present study investigates the distribution of longitudinal static
strains on the outer surface of each stringer foot in health and defected scenarios. The main
objective of this work is to utilize the baseline and the strain alterations caused by skin/stiffener
disbond and propose suitable HIs to assess/monitor the health state of the structure. The
interrogation points are selected in a manner to simulate permanently installed optical fiber
sensors, with Bragg gratings in pre-selected locations. Initially, strains from the pristine
(healthy) SSP are obtained. Then, a parametric finite element model is created, simulating
several disbond cases, in order to assist the objective of this study. Further details regarding the
parameterized way of modeling are given below.

2.1 Single-Stiffener Panel configuration

 The geometrical dimensions of the SSP, expressed in mm are provided in Figure 1,
accompanied by the stacking sequences of each member. The material used in this study is an
IM7/8552 carbon/epoxy unidirectional continuum fiber-reinforced prepreg, with nominal cured

 2
Dimitrios P. Milanoski and Theodoros H. Loutas

ply thickness 0.131 mm [9] and mechanical properties [10] as detailed in Table 1. From a
numerical analysis point of view, the final geometry of the two members is modelled
considering a co-bonding manufacturing technique, without adhesive film in the interfacial
region.

 1.31
 [45/-45/0/45/-45]s

 46.5
 1.834
 [45/-45/0/45/90/-45/0]s

 a) b) 65.5
 165

 Figure 1: Dimensions of SSP specimen, a) perspective and b) cross-sectional view

 Table 1: Engineering and interlaminar properties of IM7/8552 [10]

 E11 (GPa) E22 (GPa) G12 (GPa) v12 GIc (N/mm) GIIc (N/mm) η (-)
 150 9.08 5.29 0.32 0.277 0.788 1.6

2.2 Finite Element Model

 The numerical model created, simulates the quasi-static compression of the pre-defined
SSP. The SSP is loaded under displacement control, in an attempt to simulate the real test
procedure. Cast-tab pots are used as load/support members to uniformly transmit the load to the
specimen. Hence, two 30 mm exterior regions on the longitudinal direction bind to the pots. A
schematic illustration of the test article is showed in Figure 2, indicating also the two
SMARTapes® accommodating the optical fibers with FBGs (provided by SMARTEC-
Switzerland) and the respective sensor spacing. These tapes are made of GFRP/epoxy and
protect the accommodating optical fibers from harsh environmental conditions. The global
coordinate system (XYZ) of the model is located at the symmetry plane of the top loading tab.
Also, a local system (xyz) is defined at the start of each SMARTape® (one illustrated in Figure
2). Results regarding disbonds underneath this region will be expressed at the local coordinate
system, as shown in Chapter 3.
 The numerical study was implemented using the commercial finite element code
Abaqus/Standard® [11]. Both members are modelled as one discrete layer of 4-node
quadrilateral shell elements with reduced integration (S4R) and three integration points along
the thickness. Every layer of composite laminates was modelled as a transverse isotropic
material, according to the properties presented at Table 1, with thickness equal to the cured ply
thickness the material provider suggests i.e. 0.131 mm. Earlier experimental works highlighted
that degradation of the material properties is negligible in the early post-buckling region [12].
Thus, for the numerical modeling tasks associated with the present study, progressive

 3
Dimitrios P. Milanoski and Theodoros H. Loutas

degradation of the material properties and intralaminar damage initiation/evolution were
neglected. Instead of explicitly modeling the tabs, equivalent boundary conditions (BCs) have
been imposed to the associated SSP partitions. On the support tab region, all six nodal degrees
of freedom have been restrained, while on the loading one, the only degree set free is the spatial
displacement Uz. Displacement control condition was applied on the loading tab region. Also,
the filler region between the two radii (Figure 1b) was omitted in the modeling. Among the
individual constituents i.e. the skin and the stringer, tie constraints were applied to their surfaces
to guarantee common interface degrees of freedom and thus common kinematics. Regarding
the strain interrogation points, each FBG numerically represented by a row of nodes with
overall 10 mm length, as the common FBGs. Thus, ten node sets were created mimicking the
actual FBGs. In every location where the FBG sensor is designed to be placed, the average
strain of the contained nodes is extracted and assumed as the strain reading of each sensor. Two
important observations are highlighted. First, in real conditions the SMARTape® is adhesively
bonded in each foot and that might affect the strain readings. Second, the strains are
extrapolated by the ambient elements to each (FBG) node.

 30 Free Length = 240 30

 L = 140
 Loading Support
 tab tab

 Loading s ki n
 tab

 x
 ri ght 12 z
 X foot
 (1) (2) (3) (4) (5) SMARTape
 Z
 65.5

 (6) (7) (8) (9) (10)
 FBGs l eft
 foot

 50 5 10 20 10 20 10 20 10 20 10 5 50

 Figure 2: Conceptual design of sensorized specimen

 The numerical analysis is divided in two steps, as (buckling) instability issues arise under
these load conditions. Initially, a linear buckling analysis is executed for the estimation of the
buckling (eigen)modes and associated eigenvalues. A compressive unit load is applied which
means that the eigenvalues express the critical buckling load with respect to the corresponding
mode. Since linear perturbation analysis is not predicting stresses and strains but rather a
normalized displacement field of the structure, a non-linear buckling analysis is compulsory.
An important role is played by appropriate imperfections acting as triggering mechanism for
the buckling initiation (bifurcation point). In general, two main categories of imperfections are
considered in the literature [8] and described as:

 • Normalized nodal displacements obtained via linear buckling analysis are

 4
Dimitrios P. Milanoski and Theodoros H. Loutas

 introduced in the imminent non-linear analysis, following the pattern of the
 considering buckling modes
 • A constant, low amplitude force acting along the buckling direction

The second method can alter the strain field in the adjacent region of the actuation point, while
the second represents a more sensible way to model the buckling behavior. In the present study,
the first way of introducing imperfections is chosen, especially due to the need to obtain as
much as possible reliable strain estimations. These imperfections in general are defined by
superimposing multiple eigenmodes, and have the following amplitude form with respect to the
global coordinate system:

 (1)
 = ∑
 =1

where wi is the scale factor correlated with the i-th mode shape φi. Only the 1st buckling mode
was introduced as the lowest modes are frequently more critical, and a scale factor equal to 10%
of the stiffener thickness was used. A static Newton-Raphson (N-R) solver, incorporating non-
linear geometry formulation was utilized to solve the equilibrium of the non-linear problem. A
maximum displacement equal to 0.25 mm was set for loading BC, as deep post-buckling
analysis was not relevant with the current study. Due to such excitation, buckling occurred and
characterized by the non-linear relation between the reaction force and displacement of the
panel. Also, the maximum lateral deflection of skin midplane reached 4.7 mm. So, as buckling
load considered the limit load where the linear load-displacement relation is maintained. A
mesh convergence study was implemented, regarding the buckling load as this was obtained
from both linear and non-linear analysis.

 13 25
 Linear analysis
 12.5 Initial linear path
 Critical buckling load, Pcr [kN]

 Nonlinear analysis 20
 12
 Load, P [kN]

 11.5 15

 Bifurcation point Post-buckling region
 11
 10

 10.5 Considered loads for SHM
 5
 10

 9.5 0
 a) 0 5000 10000 15000 20000 25000 30000 b) 0 0.05 0.1 0.15 0.2 0.25 0.3
 Number of elements, n [-] End shortening [mm]

 Figure 3: a) Mesh convergence and b) load-displacement curve for considered mesh density
The relevant results are depicted in Figure 3 and the load-displacement curve of the chosen
mesh density is illustrated in Figure 3. Convergence was achieved in much lower number of
elements, but in order to increase the fidelity of the model, an approximate element size of 2.00

 5
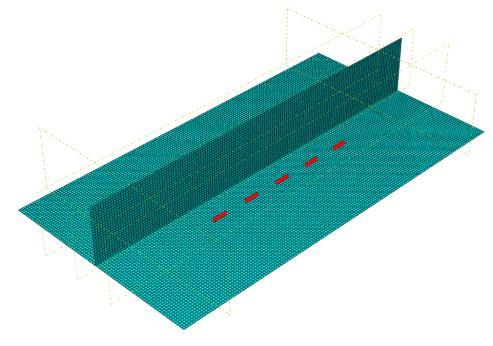
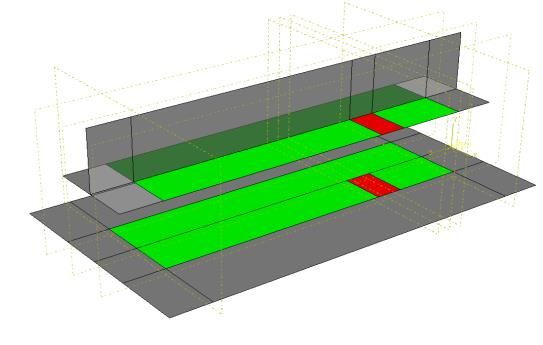
Dimitrios P. Milanoski and Theodoros H. Loutas

mm was selected producing a total discretization of 20550 elements, as shown in Figure 4.
Implementation of the Virtual Crack Closure Technique (VCCT) [13] also requires refined
(global) mesh configurations or local refinement.

2.3 Parametric Analysis

 The next task deals with the development of a parametric finite element model of the SSP
with an artificially induced skin/stiffener, rectangle disbond. The parameterization concerns the
position and the size of the disbond assuming a constant width along the right foot, as shown
in Figure 4. In order to generate repetitive disbond scenarios at the skin/stiffener interface, a
script written in Python® [14] was elaborated. The advantage of this method was the easy
applicability, while the script was executed directly via the interface of Abaqus®. Most
importantly, all manual tasks regarding the modeling using Graphical User Interface (GUI) of
Abaqus® could be expressed in Python® language using proper libraries of the program. So, the
script was created on the basis of iteratively generate the geometry, including the parametric
position and size of the disbond, while it entailed all of the rest of the model attributes, as these
have been previously described (material properties, mesh, BCs, etc.).

 Loading
 cast-tab
 regions

 Support
 cast-tab regions

 Figure 4: a) Discretized SSP, highlighting the right-foot FBG set, b) partitions of SSP

 As we described previously, tie constraints were introduced at the interface region between
the skin and the stiffener. Modeling the disbond was achieved by erasing that interaction and
allow each of the individual regions of the disbond to freely move, without any kinematic
constraint imposed by the other. The specimen was divided in partitions, in a manner of
ensuring that coincident nodes at the interface of the two parts were generated. This approach
prevented excessive distortion of the elements at the interface while it also allowed the correct
implementation of the VCCT, in interfacial disbond propagation case studies. In current
analysis, the VCCT was also used in order to assess if the disbonded regions do propagate under
the defined loading condition. The interlaminar fracture properties of the IM7/8552 were used
according to Table 1. Note that the VCCT is implemented by replacing the tie constraints with
a contact interaction. This technique numerically calculates in every step the strain energy-
release rate in a pre-defined crack/disbond front. For given critical strain energy-release rates
of the material, the B-K criterion [15] controls the fracture initiation and allows the front

 6
Dimitrios P. Milanoski and Theodoros H. Loutas

elements to separate if the criterion is satisfied. Also, the VCCT implementation requires to
explicitly determine the unbonded region nodes in order to evaluate the strain energy release
rate along the formed disbond fronts. This was also taken into consideration in the written script,
so we can indicate the node sets that were created per iteration as:
 • one node set, representing the bonded region, unique for every pair of disbond
 position and size
 • ten node sets, representing the FBGs along each foot, unique for all pairs of disbond
 position and size

 Abaqus®
 GUI

 SSP
 configuration

 Constant parameters
 (Material properties, BCs,
 load type, mesh, element type, etc.)

 Python® Non-constant parameters Linear buckling
 script (Disbond position & size) analysis

 Eigenmodes &
 modification
 Parameter

 Non-linear analysis Eigenvalues
 Abaqus/Standard®
 (N-R solver) Initial
 imperfections

 End of Simulated FBG
 analysis strains
 PARAMETRIC ANALYSIS

 Figure 5: Explanation flow chart of the parametric analysis

 None of the considered analyses showed propagation of the associated disbond. Generally,
if it is ensured that fracture procedures are not involved, simple tie constrains can be utilized at
the bonded region of the two members over the VCCT. A detailed flow chart describing the
parametric implementation of the present work, is shown in Figure 5. After completion of every
iteration, the disbond characteristics were updated, regarding either the position or the size.

3. DAMAGE ASSESSMENT OF SKIN-TO-STIFFENER DISBOND

 In the current section, the effectiveness of two Health Indicators (HIs) on the detection of
numerically simulated skin/stiffener disbonds will be investigated. The strain data obtained
from the pristine specimen are considered as the baseline. Next, a SHM methodology based on
the results obtained by the parametric analyses of skin-to-stiffener disbonds was evaluated. As
mentioned before, the parametric analysis generates models with disbond in the interface of
skin/stiffener, beneath the right foot. The assessment of disbond cases, within the assumed
sensor topology, initiated by introducing a health indicator to estimate the sensitivity of the

 7
Dimitrios P. Milanoski and Theodoros H. Loutas

FBGs to the disbond position. Finally, the behavior of a second health indicator was
investigated versus the disbond size.

3.1 Baseline SHM Methodology

 The static strains obtained from the pristine specimen after the non-linear analysis, establish
the healthy-baseline which is utilized to reveal the presence of disbonds. Only strains prior to
buckling, that belong to the linear portion of load-displacement curve are considered.
Furthermore, regarding the disbond cases, similar data are gathered and stored, for each
individual disbond scenario. The strains of every FBG are simulated for several load values as
different displacements are imposed. Small discrepancies between the strains at the two feet are
observed, mainly for the two FBGs closest to the loading tab. The presence of an interfacial
disbond region, affects the strain distribution along the foot. An arbitrary case of disbond at
position zp = 60 mm, and three different sizes, is depicted in Figure 6, under a constant static
compressive load of 6.0 kN. The strain perturbation induced by the disbond can be clearly
noticed in the vicinity of its edges. The gradient in those regions abruptly increases and the
deviation from the pristine (dashed line) distribution is highlighted. The left (fully-bonded) foot
shows no deviation from the baseline. Also, the marked points that illustrate FBG readings are
highlighted along the curves. Generally, the difference between the strain reading of each FBG
for disbonded case and the baseline i.e. the differential strain, shows an increasing trend
proportional to the load. The most affected FBG shows higher discrepancies and is linearly
increasing up to buckling load, as shown in Figure 6. Hence, a notable remark is extracted as
the rest of the FBGs show almost negligible deviation from the baseline up to the buckling load.
As the disbond changes position along the foot, a similar pattern of the strain discrepancy was
obtained following the disbond position (not shown here). Moreover, the gradient and the
amplitude of the discontinuity is not maintained constant and exhibits dependency both on
position and load.
In order to estimate the impact of the disbond position to strain modification, a Health Indicator
(HI) will be utilized based on the relative strain differences of each FBG in an arbitrary
condition with the baseline. The HI is a metric of the strain change, under the same load
amplitudes and is calculated as shown in eq. (2).
 |
 | 11 − 11 (2)
 1 = ( ) , = 1,2, … , 10
 11

where i corresponds to the FBG number. To see the effect of changing external load, an average
value of the HI with changing load can be simply calculated, considering n total load cases:

 1 (3)
 ̅̅̅̅ =
 ∑ 1 , = 1,2, … , 10

 1

 8
Dimitrios P. Milanoski and Theodoros H. Loutas

 -20 18
 Post-buckling
 Disbond central axis
 16 FBG 1
 -30 Di s bond 30 mm
 FBG 2
 Longitudinal strain, ε11 [με]

 Di s bond 25 mm 14

 Strain differential [με]
 FBG 3
 -40
 Di s bond 20 mm 12 FBG 4

 -50 10 FBG 5

 -60 8
 RF - Pristine
 RF FBGs 6
 -70
 LF - Pristine
 4
 LF FBGs
 -80
 2
 FBG 1 FBG 2 FBG 3 FBG 4 FBG 5
 -90 0
 0 20 40 60 80 100 120 140 0 2 4 6 8 10 12 14
a) SMARTape Length, L [mm] b) Load [kN]

 Figure 6: a) Simulated strain distributions along left (LF) and right (RF) foot, associated with disbond cases
 and b) differential strain over load on RF for 20mm disbond case

Assuming a constant disbond size of 20 mm, the HI indices of the FBGs located at the right
foot (i = 1,2,3,4,5) are calculated. Through the parametric numerical model, disbonds in several
positions in a range 10-130 mm regarding the local coordinate system (xyz) are created. The
disbond position is incrementally increasing by 5 mm. The average HI is calculated for every
FBG, and the results versus the disbond position are depicted in Figure 7. HI values above 2%
are obtained by the current sensor topology, to almost every position of the disbond along the
foot. It can be noticed that lower discrepancies occur when a sensor is placed at central position
along the disbond against the cases that a sensor is above the disbond front. This estimation can
be evaluated by noticing the strain discontinuity profile as it is shown in Figure 6.

 20 FBG 1 FBG 2 FBG 3 FBG 4 FBG 5
 18
 HI-1
 16 HI-2
 HI-3
 14 HI-4
 HI-5
 12
 HI [%]
 [%]

 10
 Avg.

 8

 6

 4

 2

 0
 0 20 40 60 80 100 120 140
 Position of disbond central axis, zp [mm]

 Figure 7: Health indicator predicted by each FBG versus the disbond position along RF

 9
Dimitrios P. Milanoski and Theodoros H. Loutas

 Next, we introduce a second HI fit for Structural Health Monitoring, while the disbond is
increasing. This HI combines the strain readings from all sensors. In fact, it represents the
percentage each FBG sensor holds of the cumulative strain among the five FBG sensors, and is
defined as:

 11 (4)
 2 = =
 , : = 1, … , 5 : = 6, … ,10
 ∑ 11

where again i corresponds to FBG numbering. This HI is inspired by the observation that the
strain of the unaffected sensors shows minor deviation from the healthy condition. In Figure 8a
the average values of the HI for every FBG are presented, indicating first the pristine values
accompanied by several disbond size cases. The central axis of the growing disbond is at zp =
60 mm, as mentioned before and the disbond is assumed to grow by the same length from each
side. Finally, in Figure 8b the HI is presented for every FBG under increasing size of disbond.
The 3rd sensor on the RF is the most affected by the disbond front and this fact is illustrated
with a monotonical drop on its index of about 8% regarding the intact specimen value. The rest
FBG sensors show a slight increase of their HI values, no more than 2%. Only the 2nd sensor
shows an increase higher than 2% in the case of 50 mm disbond as the disbond front reaches
this sensor too.

 30 30
 FBG 1
 RF - Disbond 20mm
 FBG 2
 RF - Disbond 25mm
 RF - Disbond 30mm
 28 FBG 3
 FBG 4
 25 RF - Disbond 35mm
 FBG 5
 Normalized strain, εiN [%]

 26
Normalized strain, εiN [%]

 RF - Disbond 50mm
 RF - Pristine
 LF - Pristine
 24
 20
 x 22

 RF
 15 z
 20
 LF 25
 L

 18
 x

 10
 16
 RF z

 FBG 1 FBG 2 FBG 3 FBG 4 FBG 5 LF 25

 14 L

 5
 12

 0 10
 0 20 40 60 80 100 120 140 0 10 20 30 40 50 60
a) b)
 SMARTape Length, L [mm] Disbond size [mm]

 Figure 8: a) Normalized strain indices of FBGs on pristine and various disbonded specimens and b) gradual
 change of indices versus an increasing disbond size

4 CONCLUSIONS

 In the current study, a model-based methodology for damage assessment on generic
single-stiffener composite panels was approached. Towards that end, a finite element analysis
was conducted in order to simulate the composite panel subjected to uniaxial compressive

 10
Dimitrios P. Milanoski and Theodoros H. Loutas

loading. Longitudinal strains were computed at predefined regions where permanent FBG
sensors will be attached. Initially, a non-linear buckling analysis was executed deriving the
investigated strains on pristine (healthy) structure. Furthermore, numerous skin-to-stiffener
disbonds were introduced via a parametric numerical model using Python® scripting.
 First, by a strain differential methodology, the impact of the disbond positioning to the strain
distribution was evaluated. For that purpose, a health indicator was used comparing longitudinal
strains of the pristine baseline with the disbonded cases. Then, another indicator representing a
strain normalization scheme of every sensor was calculated. The aforementioned index was
illustrated for several disbond sizes and indicated a monotonic drop on the sensor that was more
affected by the disbond. Conclusively, the first health indicator utilizes strains from the pristine
baseline and those out of disbonded cases. It can be characterized as baseline-dependent. A
drawback of this indicator lies on its load dependency, whilst a very interesting outcome is the
small scatter that that the indicator showed in the whole load range they were examined. On the
other hand, the second indicator does not rely on baseline data. From that perspective and from
the monotonic behavior it exhibits for increasing disbond size, it constitutes a promising choice
for SHM.

ACKNOWLEDGEMENTS

The work presented in this paper was financially supported by the European Union’s Horizon
2020 research and innovation programme ReMAP (Grant Agreement Number:769288). The
support is appreciated by the authors.

REFERENCES

[1] Güemes, A., Fernández-López, A. and Soller, B. Optical Fiber Distributed Sensing -
 Physical Principles and Applications. Structural Health Monitoring (2010) 9(3):233-
 245.
[2] Li, H.C.H., Herszberg, I. and Mouritz, A.P. Automated Characterization of Structural
 Disbonds by Statistical Examination of Bond-line Strain Distribution. Structural Health
 Monitoring (2006) 5(1):83-94.
[3] Kesavan, A., Sabu, J. and Herszberg, I. Strain-based Structural Health Monitoring of
 Complex Composite Structures. Structural Health Monitoring (2008) 7(3):203-213.
[4] Takeda, S.-i., Aoki, Y. and Nagao, Y. Damage monitoring of CFRP stiffened panels
 under compressive load using FBG sensors. Composite Structures (2012) 94(3):813-
 819.
[5] Airoldi, A., Bettini, P., Loutas, T., Koimtzoglou, C. and Sala, G. Design of health and
 usage monitoring systems based on optical fibers for composite wing spars. (2015) 28th
 ICAF Symposium, Helsinki.

 11
Dimitrios P. Milanoski and Theodoros H. Loutas

[6] Fernández-López, A., Menendez, J.M. and Güemes, A. Damage Detection in a Stiffened
 Curved Plate by Measuring Differential Strains. (2007) 16th International Conference
 on Composite Materials.
[7] Sbarufatti, C., Corbetta, M., San Millan, J., Frovel, M., Stefaniuk, M. and Giglio, M.
 Model-assisted performance qualification of a distributed SHM system for fatigue crack
 detection on a helicopter tail boom. (2016) 8th European Workshop On Structural
 Health Monitoring (EWSHM), Bilbao, Spain.
[8] Zarouchas, D.S. and Alderliesten, R.C. The effect of disbonds on stability aspects of
 adhesively bonded aluminum panels during compression loading. Thin-Walled
 Structures (2015) 96:372-382.
[9] Hexcel Corporation, HexPly® 8552 Product Datasheet. (2016).
[10] Bisagni, C., Vescovini, R. and Dávila, C.G. Assessment of the Damage Tolerance if
 Post-Buckled Hat-Stiffened Panels using Single Stringer Specimens. (2010) 51st
 AIAA/ASME/ASCE/AHS/ASC Structures, Structural Dynamics, and Materials
 Conference.
[11] Dassault Systèmes Simulia Corp, Abaqus Analysis User's Manual Guide. (2014)
 Providence, RI.
[12] Dávila, C.G. and Bisagni, C. Fatigue life and damage tolerance of postbuckled
 composite stiffened structures with initial delamination. Composite Structures (2017)
 161(1):73-84.
[13] Krueger, R. Virtual crack closure technique: History, approach, and applications. Appl.
 Mech. Rev (2004) 57(2):109-143.
[14] Python, Python Software Foundation (PSF), Python 3.7.0. (2018), Wolfeboro Falls, NH
 03896-0037, PO Box 37.
[15] Kenane, M. and Benzeggagh, M.L. Mixed-mode delamination fracture toughness of
 unidirectional glass/epoxy composites under fatigue loading. Composites Science and
 Technology (1997) 57(5):597-605.

 12
You can also read