Can the CROSS protocol be safely implemented in real world scenario with broader eligibility criteria? Experience from a tertiary care centre in India
←
→
Page content transcription
If your browser does not render page correctly, please read the page content below
Can the CROSS protocol be safely implemented in real world scenario with
broader eligibility criteria? Experience from a tertiary care centre in India
Tapesh Bhattacharyya1, Moses Arunsingh1, Santam Chakraborty1, Vishnu Harilal1, Rohit Sasidharan1, Saheli Saha1, Robin Thambudorai2,
Bipradas Roy2, Sudeep Banerjee2, Paromita Roy3, Soumendranath Ray4 and Indranil Mallick1

 Department of Radiation Oncology, Tata Medical Center, 14, MAR(E-W), DH Block (Newtown), Action Area I, Newtown, Kolkata, West Bengal 700160,
1

 India
 Department of Gastrointestinal Surgery, Tata Medical Center, 14, MAR(E-W), DH Block (Newtown), Action Area I, Newtown, Kolkata, West Bengal 700160,
2

 India
3
 Department of Pathology, Tata Medical Center, 14, MAR(E-W), DH Block (Newtown), Action Area I, Newtown, Kolkata, West Bengal 700160, India
4
 Department of Nuclear Medicine, Tata Medical Center, 14, MAR(E-W), DH Block (Newtown), Action Area I, Newtown, Kolkata, West Bengal 700160, India

Abstract

Background: The Chemoradiotherapy for Oesophageal Cancer Followed by Surgery

                                                                                                                                                           Clinical Study
Study (CROSS) trial established a new benchmark in the management of oesophageal
cancer with neoadjuvant chemoradiation followed by surgery with a marked benefit for
squamous cell carcinomas (SCCs). We evaluate if the CROSS protocol can be safely imple-
mented with a broader eligibility criteria in a real-world setting.

Methods: A retrospective analysis of 80 patients of SCC oesophagus was performed,
who were treated with neoadjuvant chemoradiation with radiation therapy (RT) to 41.4
Gy/23 Fr/4.5 weeks and weekly paclitaxel and carboplatin, followed by surgery at our
institute between 2012 and 2019. Eligibility for the use of this regimen was expanded
beyond the limits of size and stage allowed in the CROSS trial.

Results: The median age of this cohort was 57 years (range: 39–78 years). Most of the
patients (77/80; 96.3%) had T3 disease and 25% patients (20/80) had N2/N3 disease.                 Correspondence to: Tapesh Bhattacharyya
Thirty-three patients (41.3%) had the disease beyond CROSS eligibility criteria. All               Email: tapesh.bhattacharyya@tmckolkata.com
patients completed planned course of RT and five cycles of weekly chemotherapy were                ecancer 2021, 15:1291
received by 61 patients (76.2%). Overall pathological complete response (pCR) could be             https://doi.org/10.3332/ecancer.2021.1291
achieved in 33 patients (41.3%). Among 33 CROSS ineligible patients, 14 (42.4%) had                Published: 16/09/2021
pCR. Acute grade 3 dysphagia and grade ≥ 3 neutropenia were seen in seven cases (8.3%)             Received: 10/06/2021
and nine cases (10.7%), respectively. At a median follow-up of 16 months, 1-year and               Publication costs for this article were supported by
2-year overall survival (OS) were 84.4% (95% confidence interval (CI): 73.5%–91.1%) and            ecancer (UK Charity number 1176307).
76.3% (95% CI: 63.2%–85.2%), respectively, for the entire cohort. For CROSS ineligible
                                                                                                   Copyright: © the authors; licensee
patients, 1-year and 2-year OS were 82% (95% CI: 61.8%–92.2%) and 72.7% (95% CI:                   ecancermedicalscience. This is an Open Access
50.4%–86.2%), respectively. On univariate analysis, patients who had pathologically N0             article distributed under the terms of the
disease had significantly better 2-year OS (85.7% versus 48.4%; p = 0.03) as compared to           Creative Commons Attribution License (http://
                                                                                                   creativecommons.org/licenses/by/4.0), which
pathologically N+ patients. On univariate and multivariate analysis, there was no signifi-
                                                                                                   permits unrestricted use, distribution, and
cant difference in OS and progression free survival between CROSS eligible and CROSS               reproduction in any medium, provided the original
ineligible patients.                                                                               work is properly cited.

ecancer 2021, 15:1291; www.ecancer.org; DOI: https://doi.org/10.3332/ecancer.2021.1291                                                                1
Conclusion: CROSS protocol can be safely implemented for carefully selected patients of SCC oesophagus outside clinical trial settings with
expanded eligibility criteria.
Keywords: neoadjuvant chemoradiation, CROSS protocol, carcinoma oesophagus, real world scenario, broader eligibility
Introduction
Curative intent resection in non-metastatic oesophageal cancers is associated with 5-year survival between 20% and 35% [1–3]. Given these
poor outcomes, combinations of chemotherapy and radiotherapy (RT) have been evaluated in the neoadjuvant and adjuvant setting. Theo-
retical advantages of a neoadjuvant approach include downstaging of disease, reduced hypoxia and earlier treatment of potential systemic
micro-metastases.
Neoadjuvant chemotherapy (NACT) and neoadjuvant concurrent chemoradiation (NACTRT) have not been directly compared in this setting.
However, a meta-analysis by Gebski et al [4] demonstrated a survival benefit with NACTRT, but not with NACT, in patients with squamous
cell carcinomas (SCCs). Neoadjuvant chemoradiotherapy has the advantages of combining effective local and systemic therapy, superior R-0
resection rates and a higher pathological complete response (pCR) rate compared with NACT alone. The initial results of Chemoradiotherapy
for Oesophageal Cancer Followed by Surgery Study (CROSS) trial [5] demonstrated that, NACTRT resulted in an improved median overall
Clinical Study
survival (OS) of 49.4 months compared with 24.0 months with surgery alone without increasing the risks of postoperative complications
after NACTRT.
The improvement was even marked for the subset with squamous carcinoma with a median survival of 81.6 months in NACTRT plus surgery
group versus 21.1 months in surgery alone arm as reported in subsequent results [6]. Since the report of these extremely encouraging results,
this protocol has become a standard of care worldwide. However, there has been a paucity of reports validating these results outside the
trial setting.
Since 2012, we have used the CROSS protocol routinely for patients with oesophageal cancers in our institute. We have used this protocol
also for technically operable patients beyond the eligibility limits defined by the CROSS trial. The objectives of the current audit was to deter-
mine if the results of the CROSS trial were reproducible in the real-world setting, and verify if the protocol could be safely and effectively
used with broader inclusion criteria.
Materials and methods
Patients with SCC oesophagus treated with CROSS protocol between 2012 and 2019 at Tata Medical Center, Kolkata, were retrospectively
analysed. Information was captured from the electronic database of the hospital management system on Research electronic data capture
[7]. Patients with cT1–T4 and N0–N3 histologically confirmed SCC of the oesophagus who had received trimodality treatment at our institu-
tion were considered.
Baseline evaluation included upper gastro-intestinal endoscopy, radiological staging with a contrast enhanced computed tomography (CECT)
thorax and abdomen or positron emission tomography-computed tomography (PET-CT), complete haemogram, renal function tests and liver
function tests, along with echocardiography and pulmonary function tests (PFTs). Endoscopy and biopsy were performed to know the muco-
sal extent of the disease and histological confirmation of diagnosis. PET-CT was routinely performed in all the cases for staging work up since
2015. Echocardiography and PFTs were done before starting treatment to know the baseline cardiac and lung function status. In patients
in whom PFT was not possible, a 6-minute walk test was done to assess the baseline lung function. All patients provided written informed
consent before starting treatment. Tumour Node Metastasis (TNM) staging was performed using American Joint Committee on Cancer 7th
edition [8]. Toxicities were recorded using Common Terminology Criteria for Adverse Events (CTCAE) version 4 [9]. Following initial clinical
ecancer 2021, 15:1291; www.ecancer.org; DOI: https://doi.org/10.3332/ecancer.2021.1291 2staging, all patients were discussed at a multidisciplinary tumour board with treatment recommendations for NACTRT followed by oesopha-
gectomy approved by physicians within the specialities of surgical oncology, thoracic surgery, gastroenterology, radiation oncology, medical
oncology, radiology and pathology.
The NACTRT schedule was as follows: on days 1, 8, 15, 22 and 29, carboplatin targeted at an Area Under Curve of 2 mg/mL/minute and
paclitaxel at a dose of 50 mg/m2 of body surface area were administered intravenously. A total external beam RT dose of 41.4 Gray was
given in 23 fractions (conventional fractionation), starting on the first day of the first chemotherapy cycle. During NACTRT, laboratory tests
(including complete blood cell counts and renal function tests) were done on a weekly basis. The patients were closely monitored for toxic
effects of NACTRT.
Radiotherapy
Patients were positioned supine, immobilised on an all in one board (AIO board, Orfit Industries) using a T-bar with arms above the head and
arm cushions placed below the arm for support. Contrast enhanced helical planning CT images were acquired with a slice thickness of 2.5
mm. Gross Tumour Volume (GTV) was delineated on the planning CT after taking into account the information provided by the PET CT and
endoscopy. The GTV was defined as gross primary tumour and the enlarged lymph nodes. A cranio-caudal margin of 3 cm and a radial margin
of 1 cm were added around the GTV to create the clinical target volume (CTV). The CTV was trimmed from the anatomical barriers such as
heart, lung, major vessels and bones as required. The final planning target volume (PTV) was then created by expanding the CTV by adding 1
cm cranio-caudally and 0.7 cm radially to the CTV. Elective mediastinal nodal irradiation was not performed.
Clinical Study
A total RT dose of 41.4 Gy in 23 fractions was delivered over four and half weeks on linear accelerators. 3D conformal RT (3DCRT) or inten-
sity modulated RT (IMRT) was used to achieve adequate target coverage and adhere to the dose constraints for the organs at risk (OAR). For
3DCRT, 15 MV beams were preferred, while IMRT was delivered using 6 MV beams. The OAR constraints used were spinal cord D max < 45
Gy, lung V20 ≤ 30%, V10 ≤ 50%, V5 ≤ 70%, mean lung dose ≤ 15 Gy and mean heart dose ≤ 26 Gy.
Following NACTRT, a repeat staging CECT thorax and abdomen was routinely obtained at 4–5 weeks to assess for treatment response and
to ensure no metastatic disease was identifiable prior to oesophagectomy. The patients were subsequently taken up for a planned definitive
surgery, about 6 to 8 weeks following the completion of NACTRT. The most common surgical approaches to accomplish the resection of
oesophageal cancer included McKeown and Ivor Lewis operation.
Tumour response was graded using the College of American Pathologist Cancer Protocol/Modified Ryan Scheme for Tumour Regression
Score. Tumour regression grade (TRG) 0 means no viable cancer cells (complete response). TRG 1 means single cells or rare small groups of
cancer cells (near complete response). TRG2 means residual cancer with evident tumour regression, but more than single cells or rare small
groups of cancer cells (partial response). TRG 3 means extensive residual cancer with no evident tumour regression (poor or no response).
One hundred and fourteen patients were actually planned for CROSS protocol; however, only 84 patients could undergo planned neoadju-
vant chemoradiation followed by surgery at our institute.
Statistical analysis
Time to event endpoints like survival was analysed using Kaplan–Meier method with the log rank test to ascertain any significance. OS was
calculated from the starting date of RT to the date of death or last follow-up. Progression free survival (PFS) was calculated from the date of
surgery to the date of progression or death or date of last follow-up. Local control was defined as absence of radiological or endoscopic pro-
gression. Univariate and multivariate analysis were performed to evaluate impact of different variables on patients treatment outcomes and
survival. Hazard ratios (HRs) with 95% confidence limits (confidence interval (CI)) were calculated using the Cox proportional hazard model.
On univariate analysis, factors which achieved p value of around 0.1 were considered for multivariate analysis. A p value of less than 0.05
was considered as statistically significant. Statistical analysis was performed using freely available EZR software (Saitama Medical Center,
Jichi Medical University, Saitama, Japan) developed by Kanda [10] which is a graphical user interface for R (The R foundation for statistical
computing, Vienna, Austria).
ecancer 2021, 15:1291; www.ecancer.org; DOI: https://doi.org/10.3332/ecancer.2021.1291 3Results
A total of 114 patients were planned for neoadjuvant chemoradiation followed by surgery according to CROSS protocol. However, only 84
patients could receive the scheduled treatment at our institute. Twenty-seven patients did not undergo surgery according to records cap-
tured from our electronic database. Three patients underwent surgery outside our institute, whose surgical and pathological data are not
available with us. Out of those 27 patients, 16 patients (59.3%) did not comply with their planned surgical schedule and were lost to follow-
up after completion of neoadjuvant chemoradiation. The reasons behind not undergoing surgery are displayed in Figure 1. Treatment related
toxicity was not a common reason for declining surgery. All 80 patients of SCC oesophagus who did complete the planned protocol at our
institute were considered for this retrospective analysis.
Demographic characteristics
The median age of this cohort was 57 years (range: 39–75 years) with a male to female ratio of 1.6:1. All patients (100%) had SCC histology.
The majority of the patients (50%) had tumour epicentre located in the middle thoracic oesophagus followed by lower thoracic oesophageal
disease in 47.5% patients. A majority of the patients (77/80; 96.3%) had T3 disease. One fourth of this cohort had high lymph nodal burden
(N2/N3 disease). The median radiological length of the tumour was 5.5 cm (ranging from 1.7 to 13.1 cm). A total of 33 patients (41.3%) could
not match the CROSS eligibility criteria. Sixteen patients (20%) had tumours more than 8 cm in length. Among them, 11 patients (13.75%)
were not eligible because of only tumour length > 8 cm. The most common cause of ineligibility was heavy nodal burden (20/80; 25%). Two
Clinical Study
patients presented with T4a disease. The baseline characteristics of this cohort are shown in Table 1.
Figure 1. Flowchart showing the patients included in the study.
ecancer 2021, 15:1291; www.ecancer.org; DOI: https://doi.org/10.3332/ecancer.2021.1291 4Table 1. Baseline characteristics of the entire cohort.
Number (%)
Features
(n = 80) (100%)
Age median (range) 57 years (39–78 years)
Sex Male 49 (61.3)
Female 31 (38.7)
Performance status 0 18 (22.5)
1 55 (68.8)
2 7 (8.8)
Histology Squamous cell
80 (100)
carcinoma
Adenocarcinoma 0 (0)
Location Lower thoracic 38 (47.5)
Middle thoracic 40 (50)
Upper thoracic 2 (2.5)
Tumour length median (range) 5.5 cm (1.7–13.1 cm)
Clinical Study
Clinical T stage cT1b 1 (1.3)
cT3 77 (96.3)
cT4a 2 (2.5)
Clinical N stage cN0 29 (36.3)
cN1 31 (38.8)
cN2 19 (23.8)
cN3 1 (1.3)
Technique of RT 3DCRT 59 (73.8)
Rapid arc 7 (8.8)
Tomotherapy 12 (15)
Missing 2 (2.4)
CROSS eligible Yes 47 (58.7)
No 33 (41.3)
Treatment
All of the 80 patients completed the full course of external beam RT with 41.4 Gy/23 fractions. Fifty-nine patients (73.8%) were treated with
3DCRT and the rest with IMRT either in the form of rapidarc or tomotherapy. Sixty-one patients (76.25%) could complete all five cycles of
chemotherapy. Rest of the patients (19; 23.75%) could not complete all the five cycles of chemotherapy because of grade 3 or more severe
leucopenia, thrombocytopenia, dysphagia, fever or generalised weakness. Chemotherapy dose reduction of 25% or more was required in
only two patients. The majority of the patients (56/80; 70%) underwent McKeowns oesophagectomy followed by Ivor Lewis operation in
15 patients (18.8%). The median length of gap between end of neoadjuvant chemoradiation and surgery was 48 days ranging from 34 to 81
days.
ecancer 2021, 15:1291; www.ecancer.org; DOI: https://doi.org/10.3332/ecancer.2021.1291 5Pathology
R0 resection could be performed in 74 patients (92.5%). The median number of lymph nodes dissected was 21 (range: 4–58). The median
number of positive lymph nodes was 0 (range: 0–17). Instead of the Mandard score which was followed in the original CROSS protocol, we
followed the College of American Pathologists protocol for reporting of response to treatment. According to this system, TRG 0 was found in
40 cases (50%). pCR (pT0N0) could be achieved in 33 patients (41.25%). Nodal regression status is not included in tumour regression grading.
Hence, out of those 40 TRG 0 cases, 5 had pN1 and 2 had pN2 disease.
Survival analysis
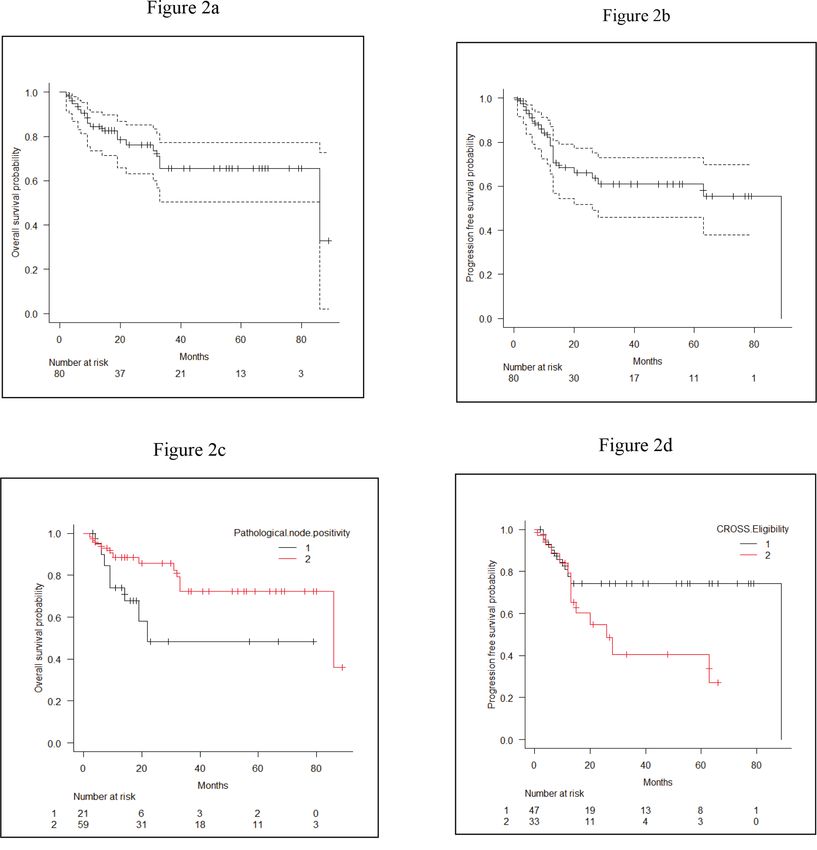
At a median follow-up of 16 months, 1-year and 2-year OS were 84.4% (95% CI: 73.5%–91.1%) and 76.3% (95% CI: 63.2%–84.2%), respec-
tively, for the entire cohort (Figure 2a). For CROSS ineligible patients, 1-year and 2-year OS were 82% (95% CI: 61.8%–92.2%) and 72.7%
(95% CI: 50.4%–86.2%), respectively. The 1-year and 2-year PFS of the entire cohort were 78.4% (95% CI: 65.5%–86.9%) and 66.1% (95%
CI: 51.8%–77.1%) (Figure 2b). On univariate analysis, patients who had pathologically node negative disease had significantly better 2-year
OS (85.7% versus 48.4%; HR: 1.13 (95% CI: 1.01–1.25) p = 0.03) as compared to pathologically node positive patients (Figure 2c). On uni-
variate analysis, CROSS eligible patients (n = 33) had shown a trend towards improved 2-year PFS (74.3% versus 54.8%; HR: 2.29 (95% CI:
0.98–5.39) p = 0.05) as compared to patients who did not match the CROSS eligibility criteria; however, it could not reach any statistical
significance (Figure 2d). On multivariate analysis using Cox regression model, not a single variable stood out to be significant prognostic fac-
Clinical Study
tor for both OS and PFS. The detailed univariate and multivariate analysis of OS and PFS are shown in Tables 2 and 3.
Patterns of failure
At the time of analysis, 23 patients (28.8%) had disease progression. Only four patients experienced local failure (5%) overall and only one
patient developed local failure alone among 33 CROSS ineligible patients. Distant metastasis was the most common pattern of failure (13
cases; 16.3%). Bone and lung were the most common sites of distant metastasis.
Dosimetry
Out of 80 patients, 14 patients (17.5%) could not meet the lung dose constraints as per Quantitative Analysis of Normal Tissue Effects in
Clinic guidelines. V5 constraint alone, V10 constraint alone and V20 constraint alone were not achieved in five patients (6.25%), two patients
(2.5%) and one patient (1.25%), respectively. Both V20 and V10 constraints were not met in two patients (2.5%). Both V10 and V5 constraints
were not met in four patients (5%). Out of those 14 patients, the PTV length was above the mean length of 15.94 cm in 12 patients. PTV
volume was above the mean volume of 441 cc in ten patients. Bulky disease (T4 or N2) was noted in five patients.
Treatment related complications
NACTRT toxicities
Toxicities were graded according to CTCAE version 4 [9]. Grade 3 dysphagia was seen in six cases (7.5%). A total of grade 3 or more severe
neutropenia were seen in nine (11.3%) cases. Grade 3 thrombocytopenia and febrile neutropenia were experienced by 3.8% and 5% of the
patients, respectively.
Surgical complications
All postoperative complications including pulmonary, cardiac and anastomotic leakage complications were recorded up to 30 days postop-
eratively or during the same hospital stay after surgery. The median length of postoperative hospital stay was 12 days ranging from 1 to 42
days. Less than 30 days postoperative mortality was seen in four patients (5%).Acute toxicities of neoadjuvant chemoradiation and post-
surgical complications are shown in Table 4.
ecancer 2021, 15:1291; www.ecancer.org; DOI: https://doi.org/10.3332/ecancer.2021.1291 6Clinical Study
1 = pathologically N+ 1 = CROSS eligible patients
2 = pathologically N0 2 = CROSS ineligible patients
Figure 2. (a): OS of the entire cohort. (b): PFS of the entire cohort. (c): Comparison of OS between pathologically node negative and node positive patients.
(d): Comparison of PFS between CROSS eligible and CROSS ineligible patients.
Discussion
Neoadjuvant chemoradiation followed by surgery is currently considered a widely practiced approach in resectable oesophageal cancer.
Encouraged by the results of the CROSS trial, we started implementing this neoadjuvant chemoradiation strategy in our institute from 2012.
Our study showed that weekly Carboplatin and Paclitaxel along with RT were well tolerated and patient compliant. All our patients could
complete RT within stipulated period of time without any dose reduction. Three fourths of our patients could complete all five cycles of che-
motherapy planned and 25% dose reduction was required only in two cases. Grade III or more severe form of neutropenia was seen in 11.3%
of cases slightly higher than the CROSS study where 7% of cases suffered from grade III haematological toxicities. Meerten et al [11] reported
ecancer 2021, 15:1291; www.ecancer.org; DOI: https://doi.org/10.3332/ecancer.2021.1291 7grade III or more severe neutropenia in 15.1% and grade III–IV leukopenia in 23.5% of patients with the same regime in their phase II study.
The major non-haematological toxicity was grade III dysphagia seen in 7.5% of cases of our cohort as compared to 7.3% grade III oesophagitis
reported by Meerten et al [11]. Shapiro et al [6] in their long-term results of CROSS study reported grade 3 or worse non-haematological
toxicities in 11% of cases. Less than 30 day postoperative mortality was seen in 4.8% of our patients as compared to 2% of the chemoradia-
tion followed by surgery arm in the CROSS trial [5]. Head-on comparison of surgical complications between our study and the neoadjuvant
chemoradiation arm of CROSS study is difficult as we observed many overlapping toxicities.
Table 2. Comparison of PFS and OS among different prognostic variables.
Prognostic variables Features 2-year PFS (95% CI) p value 2-year OS (95% CI) p value
≤57 years 40 66.0 (43.9–81.1) 74.6 (54.7–86.7)
Age 0.55 0.56
>57 years 40 66.5 (46.3–80.6) 77.9 (58.4–89.0)
Male 49 64.7 (45.5–78.5) 81.5 (64.4–90.9)
Sex 0.80 0.46
Female 31 68.3 (44.4–83.6) 68.3 (45.6–83.2)
Lower 38 60.3 (38.1–76.7) 73.8 (53.4–86.4)
Location Middle & 0.35 0.21
42 70.7 (50.8–83.8) 78.8 (60.0–89.4)
Upper
Clinical Study
N0 N1 60 70.9 (54.8–82.2) 82.1 (68.0–90.4)
Clinical N status 0.29 0.11
N2 N3 20 46.9 (17.6–71.8) 53.0 (20.7–77.4)
≤5.5 cm 41 66.7 (47.7–80.1) 78.8 (58.0–90.1)
Radiological tumour length 0.35 0.24
>5.5 cm 39 67.1 (43.8–82.5) 72.4 (53.3–84.7)
≤15.6 cm 40 61.5 (40.8–76.8) 74.0 (53.6–86.4)
PTV length 0.70 0.94
>15.6 cm 40 72.1 (49.7–85.8) 76.6 (56.4–88.4)
≤424.5 cc 41 68.8 (49.3–82.1) 81.5 (62.2–91.5)
PTV volume 0.94 0.26
>424.5 cc 39 63.0 (39.3–79.6) 68.5 (47.6–82.5)
Yes 47 74.3 (56.0–85.9) 78.6 (60.9–89.0)
CROSS eligible 0.05 0.14
No 33 54.8 (31.7–72.9) 72.7 (50.4–86.2)
0, 1 47 73.1 (52.9–85.7) 76.1 (57.2–87.5)
TRG class 0.09 0.45
2, 3 33 58.2 (36.4–74.8) 76.5 (56.2–88.3)
Node
59 70.6 (53.7–82.3) 85.7(72.0-93.0)
negative
ypN status 0.09 0.03
Node
21 54.0 (26.4–75.3) 48.4 (20.6–71.7)
positive
Yes 33 77.0 (53.1–89.8) 82.0 (61.3–92.3)
pCR 0.06 0.21
No 47 58.2 (39.2–73.2) 72.1 (53.6–84.2)
PFS, Progression free survival; OS, Overall survival; CI, Confidence interval; HR, Hazard ratio; PTV, Planning target volume; pCR, Pathological complete
response; TRG, Tumour regression grade; NA, Not applicable
ecancer 2021, 15:1291; www.ecancer.org; DOI: https://doi.org/10.3332/ecancer.2021.1291 8Table 3. HRs and CIs in univariate and multivariate analysis of PFS and OS.
2-year PFS 2-year OS
2-year OS
2-year PFS multivariate multivariate
univariate
Characteristics univariate 95% CI p value analysis 95% CI p value analysis
analysis
analysis HR HR (95% CI) HR (95% CI)
HR
p value p value
Age 1.29 0.55–3.03 0.55 NA 0.77 0.31–1.89 0.57 NA
Sex 0.89 0.37–2.15 0.81 NA 1.39 0.57–3.44 0.47 NA
Location 0.67 0.29–1.56 0.36 NA 0.56 0.23–1.41 0.22 NA
Clinical N status 1.64 0.64–4.21 0.30 NA 2.17 0.82–5.80 0.12 NA
Radiological tumour 1.16 0.50–2.69 0.73 NA 1.72 0.69–4.28 0.24 NA
length
PTV length 0.85 0.36–2.02 0.71 NA 1.04 0.42–2.55 0.94 NA
PTV volume 0.97 0.41–2.30 0.94 NA 1.67 0.67–4.15 0.27 NA
CROSS eligibility 2.29 0.98–5.39 0.05 2.36 (0.90–6.21) 1.91 0.79–4.62 0.15 2.05 (0.79–5.30)
p = 0.08 p = 0.14
TRG class 2.05 0.87–4.84 0.10 0.95 (0.18–4.90) 1.40 0.58–3.40 0.45 1.04 (0.22–4.95)
Clinical Study
p = 0.95 p = 0.97
ypN 1.10 0.98–1.24 0.11 0.67 (0.21–2.13) 1.13 1.01–1.25 0.03 0.38 (0.11–1.35)
p = 0.50 p = 0.13
pCR 2.41 0.94–6.18 0.06 2.09 (0.30–14.34) 1.83 0.70–4.78 0.22 1.20 (0.17–8.34)
p = 0.45 p = 0.85
PFS, Progression free survival; OS, Overall survival; CI, Confidence Interval; HR, Hazard ratio; PTV, Planning target volume;
pCR, Pathological complete response; TRG, Tumour regression grade; ypN, Pathological nodal status; NA, Not applicable
In this cohort, 1-year and 2-year OS were 84.4% and 76.3%, respectively, compared to 82% and 67% in the neoadjuvant chemoradiation arm
of CROSS study. The interesting point in this study is that 41.3% of the patients did not match the CROSS eligibility criteria. Tumour length
more than 8 cm and heavy nodal burden (N2/N3) were found in 20% and 25% patients of this cohort, respectively. There was no significant
difference in OS or PFS between CROSS eligible and ineligible patients on univariate and multivariate analysis. Moreover, when we have
analysed individual factors, i.e., heavy versus less nodal burden or length of the disease and its impact on outcome, none of them came out
to be significant It suggests that CROSS protocol is not only applicable in trial settings, it is also a reasonable option for carefully selected
patients with more advanced disease in real life scenario which is commonly found in low or middle income countries with limited resources
and where screening programmes are not well developed or strictly implemented.
The R0 resection rate in this study was 92.5% which is similar to the neoadjuvant chemoradiation arm of CROSS protocol. The pCR in both
the primary and the regional lymph node (ypT0N0) in this study was 41.3% compared to 49% found in the SCC group of the CROSS cohort.
The substantial downstaging as a result of chemoradiotherapy is also reflected in the significantly higher percentage of R0 resections in the
chemoradiotherapy–surgery group. The slightly lower pCR rate may be explained by the broader eligibility and more advanced disease in our
cohort. Lee et al [12] in preoperative chemotherapy with hyperfractionated RT arm showed a pCR rate of 43% comparable to our studies.
Meerten et al [11] showed a pCR rate of 25% in their entire cohort, pCR rate in SCC patients was not separately mentioned in the results.
The role of pCR in the OS and disease free survival (DFS) has been highlighted time and again. Berger et al [13] have documented a survival
benefit in patients who have been downstaged to pathological stage 0 or 1. They also mentioned the completeness of resection to be of
more importance in determination of survival. Meredith et al [14] have noted a significant 5-year OS and DFS benefit in complete responders
in comparison to partial or no-responders. More of these patients had had R0 resections and less local recurrence. In our study, it was the
pathological node negative status that impacted on improved OS on univariate analysis; however, on multivariate analysis not a single vari-
able stood out as a significant independent prognostic factor. Reynolds et al [15] demonstrated that ypN status is the strongest determinant
ecancer 2021, 15:1291; www.ecancer.org; DOI: https://doi.org/10.3332/ecancer.2021.1291 9of outcome, more important than the achievement of a complete pathologic response or of histomorphologic regression at the primary site.
Gu et al [16] showed that the number of LNs with metastasis is an independent prognostic factor in patients with residual adenocarcinoma
of the oesophagus or the EGJ after preoperative chemoradiation.
The drawback of this study is its retrospective nature and small sample size. Toxicity documentation could have been better if it is a prospec-
tive one. The duration of follow-up of these patients has been short owing to the fact that most of these patients were residents of other
states or countries. Radiological and endoscopic examination on follow-up was based on symptoms rather than regular surveillance. In the
CROSS trial, most of the locoregional recurrences and distant metastasis occurred within 24 months and 30 months, respectively. With a
median follow-up of only 16 months in our study, these recurrences are likely to be missed.
Table 4. Treatment related complications (acute toxicities of neoadjuvant chemoradiation and surgical complications).
Acute toxicities of neoadjuvant chemoradiation Number (%)
Yes 6 (7.5)
≥Grade III RT induced dysphagia No 72 (90)
Missing 2 (2.5)
Yes 3 (3.8)
≥Grade III RT induced nausea and vomiting No 75 (93.8)
Clinical Study
Missing 2 (2.5)
Yes 2 (2.5)
Grade III anaemia No 72 (90.0)
Missing 6 (7.5)
Grade 3 6 (7.5)
Grade 4 3 (3.8)
≥Grade III neutropenia
No 69 (86.3)
Missing 2 (2.5)
Grade 3 2 (2.5)
Grade 4 1 (1.2)
≥Grade III thrombocytopenia
No 73 (91.3)
Missing 4 (5)
Surgical complications
Pneumonia 12 (15)
Infection and sepsis 8 (10)
Pleural effusion 7 (8.8)
Pulmonary complications
Respiratory failure 3 (3.8)
Aspiration 4 (5)
Pneumothorax and pneumomediastinum 2 (2.5)
Atrial fibrillation 3 (3.8)
Cardiac complications Supraventricular tachycardia 2 (2.5)
Shock with DIC 2 (2.5)
RT, Radiotherapy; DIC, Disseminated intravascular coagulation
For surgical complications adding up the data will not result in 100%
a
ecancer 2021, 15:1291; www.ecancer.org; DOI: https://doi.org/10.3332/ecancer.2021.1291 10Conclusion
Our results suggest that neoadjuvant chemoradiation following CROSS protocol can be safely implemented in carefully selected patients of
SCC oesophagus in real world scenarios outside the clinical trial setting with broader eligibility criteria.
Funding support
Nil.
Conflicts of interest
Nil.
References
1. Bray F, Ferlay J, and Soerjomataram I, et al (2018) Global cancer statistics 2018: GLOBOCAN estimates of incidence and mortality
Clinical Study
worldwide for 36 cancers in 185 countries CA Cancer J Clin 68(6) 394–424 https://doi.org/10.3322/caac.21492 PMID: 30207593
2. Allum WH, Stenning SP, and Bancewicz J, et al (2009) Long-term results of a randomized trial of surgery with or without preoperative
chemotherapy in esophageal cancer J Clin Oncol 27(30) 5062–5067 https://doi.org/10.1200/JCO.2009.22.2083 PMID: 19770374
3. Kelsen DP, Winter KA, and Gunderson LL, et al (2007) Long-term results of RTOG trial 8911 (USA Intergroup113): a random assign-
ment trial comparison of chemotherapy followed by surgery compared with surgery alone for esophageal cancer J Clin Oncol 25(24)
3719–3725 https://doi.org/10.1200/JCO.2006.10.4760 PMID: 17704421
4. Gebski V, Burmeister B, and Smithers BM, et al (2007) Survival benefits from neoadjuvant chemoradiotherapy or chemotherapy
in oesophageal carcinoma: a meta-analysis Lancet Oncol 8(3) 226–234 https://doi.org/10.1016/S1470-2045(07)70039-6 PMID:
17329193
5. van Hagen P, Hulshof MC, and van Lanschot JJ, et al (2012) Preoperative chemoradiotherapy for esophageal or junctional cancer N Engl
J Med 366(22) 2074–2084 https://doi.org/10.1056/NEJMoa1112088 PMID: 22646630
6. Shapiro J, van Lanschot JB, and Hulshof Marten CCM et al (2015) Neoadjuvant chemoradiotherapy plus surgery versus surgery alone
for oesophageal or junctional cancer (CROSS): long-term results of a randomized controlled trial Lancet Oncol 16(9) 1090–1098 https://
doi.org/10.1016/S1470-2045(15)00040-6 PMID: 26254683
7. Harris PA, Taylor R, and Thielke R, et al (2009) Research electronic data capture (REDCap)—a metadata-driven methodology and
workflow process for providing translational research informatics support J Biomed Inf 42(2) 377–381 https://doi.org/10.1016/j.
jbi.2008.08.010
8. (2010) AJCC Cancer Staging Manual 7th edn (France: Springer) [http://www.springer.com/medicine/surgery/book/978-0-387-88440-0]
Date accessed: 12/6/2014
9. National Cancer Institute (2010) Common Terminology Criteria for Adverse Events (CTCAE) Version 4.0 [https://www.eortc.be/services/
doc/ctc/CTCAE_4.03_2010-06-14_QuickReference_5x7.pdf]
10. Kanda Y (2013) Investigation of the freely available easy-to-use software ‘EZR’ for medical statistics Bone Marrow Transplant 48(3)
452–458 https://doi.org/10.1038/bmt.2012.244 PMCID: 3590441
ecancer 2021, 15:1291; www.ecancer.org; DOI: https://doi.org/10.3332/ecancer.2021.1291 1111. van Meerten E, Muller K, and Tilanus HW, et al (2006) Neoadjuvant concurrent chemoradiation with weekly paclitaxel and carboplatin
for patients with oesophageal cancer: a phase II study Br J Cancer 94(10) 1389–1394 https://doi.org/10.1038/sj.bjc.6603134 PMID:
16670722 PMCID: 2361286
12. Lee JL, Park SI, and Kim SB, et al (2004) A single institutional phase III trial of preoperative chemotherapy with hyperfractionation
radiotherapy plus surgery versus surgery alone for respectable esophageal squamous cell carcinoma Ann Oncol 15(6) 947–954 https://
doi.org/10.1093/annonc/mdh219 PMID: 15151953
13. Berger AC, Farma J, and Scott WJ, et al (2005) Complete response to neoadjuvant chemoradiotherapy in esophageal carcinoma is asso-
ciated with significantly improved survival J Clin Oncol 23(19) 4330–4337 https://doi.org/10.1200/JCO.2005.05.017 PMID: 15781882
14. Meredith KL, Weber JM, and Turaga KK, et al (2010) Pathologic response after neoadjuvant therapy is the major determinant of survival
in patients with esophageal cancer Ann Surg Oncol 17(4) 1159–1167 https://doi.org/10.1245/s10434-009-0862-1 PMID: 20140529
15. Reynolds JV, Muldoon C, and Hollywood D, et al (2007) Long-term outcomes following neoadjuvant chemoradiotherapy for esophageal
cancer Ann Surg 245(5) 707–716 https://doi.org/10.1097/01.sla.0000254367.15810.38 PMID: 17457163 PMCID: 1877071
16. Gu Y, Swisher SG, and Ajani JA, et al (2006) The number of lymph nodes with metastasis predicts survival in patients with esopha-
geal or esophagogastric junction adenocarcinoma who receive preoperative chemoradiation Cancer 106(5) 1017–1025 https://doi.
org/10.1002/cncr.21693 PMID: 16456809
Clinical Study
ecancer 2021, 15:1291; www.ecancer.org; DOI: https://doi.org/10.3332/ecancer.2021.1291 12You can also read