VALIDITY AND RELIABILITY OF BIOPSYCHOSOCIAL-RELATED MEASUREMENT SCALES AMONG LOW-INCOME MALAYSIAN - Global Journal of Public Health Medicine
←
→
Page content transcription
If your browser does not render page correctly, please read the page content below
Original Article

VALIDITY AND RELIABILITY OF BIOPSYCHOSOCIAL-RELATED
 MEASUREMENT SCALES AMONG LOW-INCOME MALAYSIAN
                       SMOKER
                  Fadzrul Hafiz Johani, Shamsul Azhar Shah*, Nazarudin Safian

   Department of Community Health, Faculty of Medicine, University Kebangsaan Malaysia, Kuala
                                      Lumpur, Malaysia.

                         *Corresponding author: drsham@ppukm.ukm.edu.my

                                              ABSTRACT
Introduction: Tobacco is the only legal product that kills a large proportion of its consumers when used
as intended by its manufacturer. The effect of nicotine as a driving substance on smoking has been
established for decades. Still, very little is known on how the biopsychosocial determinants relationship
affects levels of nicotine addiction in smokers, especially in the urban low-income population. The study
aimed to validate measurement scales related to biopsychosocial factors that will be used in the future
study to evaluate biopsychosocial components that influence nicotine addiction among urban poor
smokers. Methods: Exploratory factor analysis (EFA) using the principal component analysis with
varimax rotation and Kaiser normalization was used to assess the factor structure. Then, the
confirmatory factor analysis (CFA) was conducted to assess the unidimensionality, validity, and
reliability of the latent construct. Results: EFA showed extraction of factors according to their original
scales with all factor loading and communality's values were above 0.5. During CFA, factor loading less
than 0.6 was deleted. Convergent validity verified by computing the Average Variance Extracted (AVE)
for every construct range between 0.528 – 0.801. The Fitness Indexes achieved the required level
(RMSEA=0.05, CFI=0.937, Chisq/df=1.7). Meanwhile, the Discriminant Validity Index range between
0.75-0.89, which is higher than the correlation coefficient value. Internal consistency assessed from
Composite Reliability range between 0.714-0.965. Conclusion: The measurement scales are valid and
reliable to assess the intended constructs among low-income male smokers in the urban area.

Keywords: Biopsychosocial, factor analysis, reliability, smoking, validity.

      GLOBAL JOURNAL OF PUBLIC HEALTH MEDICINE 2021, VOL 3, ISSUE 1                                          301
                                                           gggggglo
Introduction
Tobacco is the only legal product that kills a large proportion of its consumers when used as intended
by its manufacturer (WHO, 2013). The World Health Organization (WHO) has estimated that around 6
million people die from tobacco use each year. The number of tobacco-related direct and indirect death
is projected to increase to 8 million by 2030 if no strong tobacco control measures are put in place
(WHO, 2015). The most commonly used form of tobacco is cigarette smoking (Eriksen, Mackay,
Schluger, Islami, & Drope, 2015; WHO, 2020). Currently, around 80% of smokers worldwide live in low-
and middle-income countries, and in most countries, tobacco use is more concentrated in the low-
income population (US National Cancer Institute & WHO, 2016).
In Malaysia, 40.5% of men age 15 years and above were smokers compared to only 1.2% smokers
among women (Institute for Public Health, 2020) which warrants specific and targeted intervention
among male smokers. More than half of the low-income group in Malaysia which is also known as
category B40 reside in the urban area, living in high-density housing and facing multiple issues including
non-conducive living conditions and rising cost of living (Economic Planning Unit, 2017). They are said
to be vulnerable to economic shock as the majority of them depended on a single source of income and
encounter various health challenges related to non-communicable diseases which smoking becomes
one of the important risk factors. The urbanization factor, migration of low-income groups from rural to
urban areas, the influx of foreign workers, and the rising costs of living have contributed to the increase
of urban poor in Malaysia (Zainal, Kaur, Ahmad, & Khalili, 2012).
The effect of nicotine as a driving substance on smoking has been established for decades (American
Psychiatric Association, 1996; Royal College of Physicians, 2000; WHO, 2001). Nicotine which is as
addictive as heroin and cocaine acts as a central nervous system stimulant to give a perceived calming
effect that may be what nicotine users find reinforcing (Handa, Kour, & Khurana, 2017; Maisto, Galizio,
& Connors, 2014). Behavioral components influenced by psychological and socio-environment factors
also contribute to the progression and maintenance of an addiction. The available evidence suggests
that interaction between biological, psychological, and social factors is the core principle of the
biopsychosocial model of addiction (Pfeffer, Wigginton, Gartner, & Morphett, 2017). Therefore, this
study aims to validate measurement scales related to biopsychosocial factors that will be used in future
research to evaluate biopsychosocial components that influence nicotine addiction among urban poor
male smokers.
Methods
Study design and participant
This study was a cross-sectional study design. A purposive sample of hard-to-reach cigarette smokers
from the low-income neighborhood was recruited through street outreach and word of mouth from an
impoverished neighborhood in one of the randomly selected public housing areas in Kuala Lumpur. The
participant must be 1) male, 2) age 18 years old and above, 3) current smoker, 4) B40 group category
GLOBAL JOURNAL OF PUBLIC HEALTH MEDICINE 2021, VOL 3, ISSUE 1 302
ggggggloas defined for low-income population in Malaysia, and 5) could communicate, read and write in the
Malay language independently.
The sample size for factor analysis was calculated based on Gorsuch (1988) who suggested a minimum
of 50 observations or the total number of items in the measurement scale is multiplied by five, and the
resulting number gives the required sample for the study (Gorsuch, 1988). For reliability testing,
Cronbach’s alpha formula was used to calculate the sample size (Bonett, 2002). The higher value of
the two calculations was taken as the final sample size. The current study required a minimum of 60
sample sizes for factor analysis while for reliability testing, the calculated sample size was 52.
Therefore, we recruited 60 participants in the study.
Measurement Scales
There are five sets of measurement scales that underwent validation. First, Neighbourhood-level
Cohesion and Disorder Scale (NCDS) was developed by Cagney et al. (Cagney et al., 2009) to assess
the neighborhood condition. The NCDS is an 8-item scale measuring two dimensions of neighborhood
context i) social trust and ii) sign of physical neglect in the neighborhood environment. The items were
measures on a 7-point Likert-type scale from 1 'very strongly disagree' to 7 'very strongly agree'. The
higher the score indicates higher social cohesion and physical environment care. Second, workplace
stress was measured using the Workplace Stress Survey (WSS) (The American Institute of Stress,
2018) developed by The American Institute of Stress as a simple screening measure to identify stressful
experiences at the workplace. The WSS has 10-item using a 10-point Likert-type scale from 1 'strongly
disagree' to 10 'strongly agree'. Third, financial wellness was measured using Financial Well-Being
Scale (FWS) developed by Prawitz et al. (Prawitz et al., 2006). FWS is a brief scale that consists of only
eight items measured on a 10-point Likert-type scale arrange as a continuum extending from negative
to a positive feeling. Fourth, the perceived stress of the respondents was measured using Perceived
Stress Scale 10 (PSS-10), which was adopted from Sheldon Cohen (Cohen, 1988). The PSS-10
assesses perceived stressful experiences or stress response over the previous month using a 5-point
Likert-type scale from 0 'never' to 4 'very often'. Individual's scores on the PSS-10 can range from 0 to
40 with higher scores indicating higher perceived stress. Lastly, the work and family balance was
measured using the Work-Family Conflict Questionnaire (WFCQ) measurement scale developed by
Kelloway et al. (Kelloway, Gottlieb, & Barham, 1999). The original measurement scale consisted of 22-
items with a Likert-type answer range from 1 ‘strongly disagree to 5 ‘strongly agree’. The measurement
scale covers four dimensions: time-based Work-Interfere-Family, strain-based Work-Interfere-Family,
time-based Family-Interfere-Work, and strain-based Family-Interfere-Work. To shorten the
measurement scale, we adapted two of four dimensions from the measurement scale i.e. strain-based
Work-Interfere-Family and strain-based Family-Interfere-Work, which consisted of 12-items.
GLOBAL JOURNAL OF PUBLIC HEALTH MEDICINE 2021, VOL 3, ISSUE 1 303
ggggggloTranslation process
Neighborhood-level Cohesion and Disorder Scale (NCDS) and Workplace Stress Survey (WSS) were
the only measurement scales that went through the translation process. The English version of the
NCDS and WSS was translated into Malay by a postgraduate student who possesses a strong
command of English and the Malay language. Then the Malay version was back-translated into the
English language by another postgraduate student who does not know the original scale to ensure face
validity of the scale. The English back-translated version was compared to the original English version
to identify problematic words or phrases. The Malay translated version was read through and checked
thoroughly to ensure proper use of words and grammar. These processes were repeated until a final
version of the Malay translated version of the Neighbourhood-level Cohesion and Disorder Scale
(NCDS-M), and the Malay translated version of Workplace Stress Survey (WSS-M) were derived. The
Malay language version of the Financial Well-Being Scale (Kamaluddin et al., 2018), Perceived Stress
Scale 10 (Al-Dubai, Alshagga, Rampal, & Sulaiman, 2012) and Work-Family Conflict Questionnaire
(Sanaz, Syaqirah, & Khadijah, 2014) were adopted from the existing Malay translated measurement
scales
Data Collection
The data was collected at a public housing area situated in Kuala Lumpur, Malaysia. The selected
participants were informed of the objectives of the current study and relevant information. Written
consent was obtained from the participants prior to questionnaire distribution once they agreed to
participate. Each participant was given a set of Malay-translated versions of each measurement scale
with the sociodemographic section. The average time taken to complete all measurement scales was
10 minutes.
Analysis
The data were analyzed using IBM SPSS Statistic version 22 with AMOS Graphic for descriptive
statistics, factor, and reliability analyses. The socio-demographic variable of the participants was
summarized using descriptive statistics while the preliminary analysis such as Kaiser-Meyer-Olkin
(KMO) Measure of Sampling Adequacy (≥0.5), and Bartlett's test of sphericity (p0.50 was considered as indicators of significant factorial
contribution (Comrey & Lee, 2013; Hair, Black, Babin, Anderson, & Tatham, 1998).
Then, the confirmatory factor analysis (CFA) was conducted to assess the unidimensionality, validity,
and reliability of the latent construct. The CFA processes were done by combining all constructs known
as pooled-CFA, and the CFA procedure was executed at once. The CFA for pooled measurement tools
is more efficient and highly suggested (Awang, 2015). The CFA test whether the measures of a
construct are consistent with the researcher’s understanding of the nature of that construct. The CFA
GLOBAL JOURNAL OF PUBLIC HEALTH MEDICINE 2021, VOL 3, ISSUE 1 304
ggggggloassess the uni-dimensionality, three types of validity (namely convergent, discriminant and construct validity), and reliability of the latent construct (Afthanorhan, Awang, Salleh, Ghazali, & Rashid, 2018; Asnawi, Awang, Afthanorhan, Mohamad, & Karim, 2019; Awang, 2015; Awang, Hui, & Zainudin, 2018). Uni-dimensionality is achieved when all measuring items have acceptable factor loading of 0.6 or higher for the respective latent construct. Any item with a low factor loading was deleted. The deletion process was made one item at a time with the lowest factor loading item were deleted first. The three types of validity assessed during CFA are i) Convergent validity, ii) Discriminant validity, and iii) Construct validity (A. Mahfouz, Awang, Muda, & Suriawaty Bahkia, 2020; Aziz, Afthanorhan, & Awang, 2016; Raza & Awang, 2020; Yusof, Awang, Jusoff, & Ibrahim, 2017). Convergent validity is verified by computing Average Variance Extracted (AVE) for every construct. The value of AVE of 0.5 or higher indicates that this validity is achieved (Awang, 2015; Awang et al., 2018). Ensuring discriminant validity indicates that the measurement model of a construct is free from redundant items and multicollinearity problems. A redundant construct occurs when any pair of constructs in the model are highly correlated. The items redundancy in the model were identified through a discrepancy measure called Modification Indices (MI) (>15) and correlation value between exogenous constructs exceeding 0.85 (Awang, 2015; Awang et al., 2018). The Discriminant Validity Index was also developed to determine the discriminant validity. Construct validity in CFA is achieved when the Fitness Indexes for a measurement model reached the required level in all three model fit categories namely absolute fit (Root Mean Square of Error Approximation (RMSEA) 0.9) (Bentler, 1990), and parsimonious fit (Chisq/df
years old (SD = 10.10). The majority of the respondents were Malay (83.3%), married (55.0%), attained
high school education (46.7%), work as a private employee (75.0%), and had mean household monthly
income RM 2402.32 (SD = 877.37). The mean year of living in the neighborhood was 10.42 years (SD
= 6.97).

Table 1 Socio-demographic characteristic of the participants
 Variable                                                N (%)                    Mean (SD)
 Age (years)                                                                      33.8 (10.10)
 Ethnicity
    Malay                                              50 (83.3)
    Chinese                                             4 (6.7)
    Indian                                              6 (10.0)
 Marital Status
    Married                                            33 (55.0)
    Single                                             22 (36.7)
    Divorced                                            5 (8.3)
 Education Level
    Bachelor’s degree/ Degree/ PhD                      3 (5.0)
    STPM/ Certificate/ Diploma                         28 (46.7)
    PMR/ SPM                                           24 (40.0)
    UPSR                                                5 (8.4)
 Working Sector
    Government employee                                15 (25.0)
    Private employee                                   45 (75.0)
                       Household income (RM)                                    2402.32 (877.37)
             Duration living in the neighborhood (years)                          10.42 (6.97)

Exploratory Factor Analysis (EFA)

Based on Table.2, the Kaiser-Meyer-Olkin value of the study range between 0.761 to 0.918 (>0.5),
which indicates the adequacy of the sample, while all Bartlett’s Test of Sphericity was significant
(p
H1 0.886 H4 0.878 H6 0.842 H5 0.755 J3 0.869 J1 0.793 J2 0.740 J9 0.654 J6 0.653 J10 0.597 J4r 0.826 J5r 0.822 J7r 0.755 J8r 0.738 K7 0.851 K3 0.839 K1 0.813 K5 0.799 K4 0.922 K6 0.812 K8 0.775 K2 0.736 M1 0.908 M4 0.899 M3 0.896 M6 0.894 M2 0.893 M5 0.877 M9 0.863 M10 0.845 M8 0.821 M7 0.789 N11 0.869 N12 0.863 N8 0.855 N9 0.840 N10 0.780 N7 0.603 N1 0.820 N3 0.796 N4 0.777 N2 0.711 N6 0.623 N5 0.540 Variance (%) 76.4 58.8 10.9 49.8 20.9 75.6 54.8 13.2 KMO-MSA 0.918 0.888 0.778 0.761 0.833 Bartlett’s Test Χ2(28) =480.5 Χ2(45) =371.2 Χ2(28) = 249.4 Χ2(45) =783.8 Χ2(66) =516.8 X2(df) p-value
Table 3 Communalities value for each item in measurement scale
Item 1 2 3 4 5 6 7 8 9 10 11 12
FWS .651 .735 .793 .682 .540 .629 .663 .760
NCDS .595 .640 .667 .646 .702 .705 .687 .593
PSS .566 .653 .712 .748 .770 .610 .763 .708 .634 .662
WSS .728 .796 .729 .819 .783 .864 .768 .810 .742 .794
WFC .740 .703 .661 .629 .670 .590 .648 .740 .775 .699 .766 .778
Note: FWS: Financial Well-being Scale, PSS-10: Perceived Stress Scale 10, NCDS: Neighbourhood-
level Cohesion and Disorder Scale, WSS: Workplace Stress Survey, WFC: Work-Family Conflict
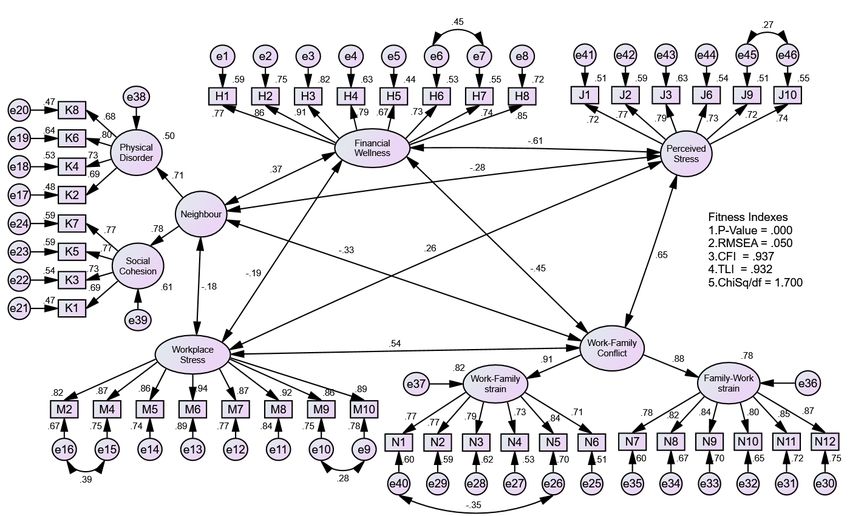
Confirmatory Factor Analysis (CFA)
a. Uni-dimensionality
Pooled-CFA analysis (Figure 1) showed that item M1, and M3 for Workplace Stress construct
and item J4, J5, J7, and J8 for Perceived Stress constructs were deleted for having factor
loading less than 0.6. Otherwise, other items show satisfactory factor loading.
b. Convergent validity
The Average Variance extracted (AVE) for all the constructs was computed and presented in
Table 4. The results showed that all constructs had an AVE value of at least 0.5. Thus, the
convergent validity for the measurement model is achieved.
c. Discriminant validity
The redundant pairs (e6 & e7, e9 & e10, e40 & e26, e45 & e46, e15 & e16) were constraint as
‘free parameter estimate’ to overcome the high Modification Indices (MI) while correlation
values between exogenous constructs does not exceeding 0.85 as shown in Figure 1. Besides,
the discriminant validity for all construct is achieved when the Discriminant Validity Index (value
in its diagonal) is higher than the correlation coefficient value (value in its row and column)
between the pair of the respective construct as shown in Table 5.
d. Construct validity
The Fitness Indexes for the measurement model achieved the required level in all three model
fit categories. The Absolute Fit category namely Root Mean Square Error of Approximation
(RMSEA) is 0.05 (achieved the threshold of less than 0.08), the Incremental Fit category
namely comparative fit index (CFI) is 0.937 (achieved the threshold of greater than 0.90), and
the Parsimonious Fit category, namely the ratio of Chisq/df is 1.70 (achieved the threshold of
less than 3.0) are as shown in Figure 1.
GLOBAL JOURNAL OF PUBLIC HEALTH MEDICINE 2021, VOL 3, ISSUE 1 308
ggggggloTable 4. Internal consistency for each construct
Construct Composite Reliability Average Variance Extracted
(CR) (AVE)
Work-Family Conflict 0.890 0.801
Work-Family strain 0.897 0.592
Family-Work strain 0.929 0.684
Neighbor 0.714 0.556
Social Cohesion 0.829 0.549
Physical Disorder 0.817 0.528
Workplace Stress 0.965 0.773
Perceived Stress 0.882 0.556
Financial Stress 0.931 0.630
Table 5 The Discriminant Validity Index for the latent construct
Construct Work-Family Neighbour Workplace Perceived Financial
Conflict Stress Stress Wellness
Work-Family Conflict 0.89
Neighbor -0.33 0.76
Workplace Stress 0.54 -0.18 0.88
Perceived Stress 0.65 -0.61 0.26 0.75
Financial Stress -0.45 0.37 -0.19 -0.61 0.79
Note: The Discriminant Validity Index value in bold
Internal Consistency
Based on Table 4, all the constructs had achieved the minimum requirement (CR ≥ 0.6) for their
reliability.
GLOBAL JOURNAL OF PUBLIC HEALTH MEDICINE 2021, VOL 3, ISSUE 1 309
ggggggloFigure 1: Pooled confirmatory factor analysis DISCUSSION Despite using a purposive sampling technique to get hard-to-reach male cigarette smokers respondents from a low-income population, it is still able to provide reliable and robust data even tested against random probability sampling (Campbell, 1955; Karmel & Jain, 1987; Tongco, 2007; Topp, Barker, & Degenhardt, 2004). These demographic epidemiological findings are similar to a study by Abd Rashid et al. who enrolled their participant from a home-to-home survey using a universal sampling method in two public housing areas in Kuala Lumpur (Abd Rashid et al., 2019). Each of the measurement scales was tested for their validity and reliability in exploratory factor analysis before proceeds with confirmatory factor analysis. Prior to conducting the validity test, three components that need to be assessed to determine the appropriateness of the data for factor analysis including sample size, factorability of the correlation matrix, and the Kaiser-Meyer-Olkin (KMO) Measure of Sampling Adequacy or Barlett’s Test of Sphericity (BTS). Regarding sample size, MacCallum et al (1999) suggested that the number of sample sizes should be at least five times the number of variables for factor analysis. Since the highest number of items in the measurement scales that we used was 10, thus we enrolled a total of 60 participants involved in this validation study. Meanwhile, the KMO value of the study for each measurement scale was more than 0.6 (range between 0.761 to 0.918), and all the BTS was significant (p
the BTS must be significant at p
Acknowledgment
The authors would like to express their gratitude and thanks to the Department of Community Health,
University Kebangsaan Malaysia for the support.
Conflicts of Interest:
The authors declare no conflicts of interest.

References
    •    A. Mahfouz, S., Awang, Z., Muda, H., & Suriawaty Bahkia, A. (2020). Mediating Role of
         Employee Commitment in The Relationship Between Transformational Leadership Style and
         Employee Performance. Humanities & Social Sciences Reviews, 8(2), 624-637.
         doi:10.18510/hssr.2020.8270
    •    Abd Rashid, R., Kanagasundram, S., Danaee, M., Abdul Majid, H., Sulaiman, A. H., Ahmad
         Zahari, M. M., . . . Irnee, W. A. (2019). The Prevalence of Smoking, Determinants and Chance
         of Psychological Problems among Smokers in an Urban Community Housing Project in
         Malaysia. International Journal of Environmental Research and Public Health, 16(10), 1762.
    •    Afthanorhan, A., Awang, Z., Salleh, F., Ghazali, P., & Rashid, N. (2018). The effect of product
         quality, medical price and staff skills on patient loyalty via cultural impact in medical tourism.
         Management Science Letters, 8(12), 1421-1424.
    •    Al-Dubai, S. A. R., Alshagga, M. A., Rampal, K. G., & Sulaiman, N. A. (2012). Factor Structure
         and Reliability of the Malay Version of the Perceived Stress Scale among Malaysian Medical
         Students. The Malaysian journal of medical sciences : MJMS, 19(3), 43-49. Retrieved from
         https://pubmed.ncbi.nlm.nih.gov/23785249
    •    American Psychiatric Association. (1996). Diagnostic and statistical manual of mental
         disorders (4rd ed.). Washington, DC.
    •    Asnawi, A., Awang, Z., Afthanorhan, A., Mohamad, M., & Karim, F. (2019). The influence of
         hospital image and service quality on patients’ satisfaction and loyalty. Management Science
         Letters, 9(6), 911-920.
    •    Awang, Z. (2015). SEM made simple: A gentle approach to learning Structural Equation
         Modeling. Bandar Baru Bangi: MPWS Rich Publication.
    •    Awang, Z., Hui, L. S., & Zainudin, N. F. S. (2018). Pendekatan mudah SEM-Structural equation
         modelling. Bandar Baru Bangi: MPWS Rich Resources.
    •    Aziz, M. I., Afthanorhan, A., & Awang, Z. (2016). Talent development model for a career in
         Islamic banking institutions: A SEM approach. Cogent Business & Management, 3(1), 1186259.
    •    Bentler, P. M. (1990). Comparative fit indexes in structural models. Psychological bulletin,
         107(2), 238.
    •    Bonett, D. G. (2002). Sample size requirements for testing and estimating coefficient alpha.
         Journal of educational and behavioral statistics, 27(4), 335-340.
    •    Browne, M. W., & Cudeck, R. (1993). Alternative ways of assessing model fit In: Bollen KA,
         Long JS, editors. Testing structural equation models. Beverly Hills, CA: Sage, 111-135.
    •    Cagney, K. A., Glass, T. A., Skarupski, K. A., Barnes, L. L., Schwartz, B. S., & Mendes de Leon, C.
         F. (2009). Neighborhood-level cohesion and disorder: measurement and validation in two
         older adult urban populations. Journals of Gerontology: Series B, 64(3), 415-424.
    •    Campbell, D. T. (1955). The informant in quantitative research. American Journal of sociology,
         60(4), 339-342.
    •    Child, D. (2006). The Essentials of Factor Analysis (Vol. 3dr Edition). London: Continuum
         International Publishing Group.
    •    Cohen, S. (1988). Perceived stress in a probability sample of the United States.

        GLOBAL JOURNAL OF PUBLIC HEALTH MEDICINE 2021, VOL 3, ISSUE 1                                          312
                                                             gggggglo
• Comrey, A. L., & Lee, H. B. (2013). A First Course in Factor Analysis (2nd, revised ed.). New
York: Psychology Press.
• Economic Planning Unit. (2017). Malaysia: Sustainable Development Goals Voluntary National
Review 2017. . Retrieved from Putrajaya:
• Eriksen, M., Mackay, J., Schluger, N., Islami, F., & Drope, J. (2015). The Tobacco Atlas. Retrieved
from Atlanta, Georgia: www.TobaccoAtlas.org.
• Gorsuch, R. L. (1988). Exploratory factor analysis. In Handbook of multivariate experimental
psychology (pp. 231-258): Springer.
• Guadagnoli, E., & Velicer, W. F. (1988). Relation of sample size to the stability of component
patterns. Psychological bulletin, 103(2), 265.
• Hair, J. F., Black, W. C., & Babin, B. J. (2010). RE Anderson Multivariate data analysis: A global
perspective. New Jersey, Pearson Prentice Hall, 661-699.
• Hair, J. F., Black, W. C., Babin, B. J., Anderson, R. E., & Tatham, R. L. (1998). Multivariate data
analysis (Vol. 5): Prentice hall Upper Saddle River, NJ.
• Handa, S., Kour, H., & Khurana, C. (2017). Insight into nicotine addiction. CHRISMED Journal of
Health and Research, 4(2), 69.
• Institute for Public Health. (2020). National Health and Morbidity Survey (NHMS) 2019: Vol. I:
NCDs – Non-Communicable Diseases: Risk Factors and other Health Problems. Retrieved from
http://www.iku.gov.my/nhms-2019
• Kamaluddin, M. R., Nasir, R., Sulaiman, W. S. W., Hafidz, S. W. M., Marcial, J., Abdullah, N. A.,
. . . Zamani, Z. A. (2018). Validity and Reliability of Malay Version Financial Well-Being Scale
among Malaysian Employees (Kesahan dan Kebolehpercayaan Skala Kesejahteraan Kewangan
Versi Bahasa Malaysia dalam Kalangan Pekerja Malaysia). Akademika, 88(2), 109-120.
• Karmel, T., & Jain, M. (1987). Comparison of purposive and random sampling schemes for
estimating capital expenditure. Journal of the American Statistical Association, 82(397), 52-
57.
• Kelloway, E. K., Gottlieb, B. H., & Barham, L. (1999). The source, nature, and direction of work
and family conflict: A longitudinal investigation. Journal of occupational health psychology,
4(4), 337.
• Maisto, S. A., Galizio, M., & Connors, G. J. (2014). Drug use and abuse: Cengage Learning.
• Marsh, H. W., & Hocevar, D. (1985). Application of confirmatory factor analysis to the study
of self-concept: First-and higher order factor models and their invariance across groups.
Psychological bulletin, 97(3), 562.
• Pallant, J. F. (2000). Development and validation of a scale to measure perceived control of
internal states. Journal of personality assessment, 75(2), 308-337.
• Pfeffer, D., Wigginton, B., Gartner, C., & Morphett, K. (2017). Smokers’ Understandings of
Addiction to Nicotine and Tobacco: A Systematic Review and Interpretive Synthesis of
Quantitative and Qualitative Research. Nicotine & Tobacco Research, 20(9), 1038-1046.
doi:10.1093/ntr/ntx186
• Prawitz, A. D., Garman, E. T., Sorhaindo, B., O’Neill, B., Kim, J., & Drentea, P. (2006). The
incharge financial distress/financial well-being scale: Establishing validity and reliability. Fin
Counsel Plan, 17, 34-50.
• Raza, I., & Awang, Z. (2020). Knowledge sharing in multicultural organizations: evidence from
Pakistan. Higher Education, Skills and Work-Based Learning, 10(3), 497-517.
doi:10.1108/HESWBL-09-2019-0114
• Royal College of Physicians. (2000). Nicotine addiction in Britain: a report of the Tobacco
Advisory Group of the Royal College of Physicians.
• Samuels, P. (2017). Advice on exploratory factor analysis.
• Sanaz, A., Syaqirah, A., & Khadijah, S. (2014). Validation study of the Malay version of the
work-family conflict questionnaire. The Malaysian journal of medical sciences: MJMS, 21(1),
50.
GLOBAL JOURNAL OF PUBLIC HEALTH MEDICINE 2021, VOL 3, ISSUE 1 313
gggggglo• Stevens, J. P. (2012). Applied multivariate statistics for the social sciences: Routledge.
• Tabachnick, B., & Fidell, L. (2007). Using multivariate statistics fifth edition. In: Pearson
Education, Inc Boston:.
• The American Institute of Stress. (2018). Workplace Stress: Are you experiencing workplace
stress? The American Institute of Stress. Retrieved from https://www.stress.org/workplace-
stress
• Tongco, M. D. C. (2007). Purposive sampling as a tool for informant selection. Ethnobotany
Research and applications, 5, 147-158.
• Topp, L., Barker, B., & Degenhardt, L. (2004). The external validity of results derived from
ecstasy users recruited using purposive sampling strategies. Drug and alcohol dependence,
73(1), 33-40.
• US National Cancer Institute, & WHO. (2016). The Economics of Tobacco and Tobacco Control
(NIH Publication No. 16-CA-8029A). Retrieved from Tobacco Control Monograph:
http://cancercontrol.cancer.gov/brp/tcrb/monographs/21/index.html.
• WHO. (2001). Advancing knowledge on regulating tobacco products (monograph) World
Health Organization. Geneva, Switzerland.
• WHO. (2013). WHO recommendations for the prevention and management of tobacco use and
second-hand smoke exposure in pregnancy: World Health Organization.
• WHO. (2015). WHO global report on trends in prevalence of tobacco smoking 2015: World
Health Organization.
• WHO. (2020). Tobacco: Leading cause of death, illness and impoverishment. Retrieved from
https://www.who.int/news-room/fact-sheets/detail/tobacco
• Williams, B., Onsman, A., & Brown, T. (2010). Exploratory factor analysis: A five-step guide for
novices. Australasian Journal of Paramedicine, 8(3). doi:10.33151/ajp.8.3.93
• Yusof, Y., Awang, Z., Jusoff, K., & Ibrahim, Y. (2017). The influence of green practices by non-
green hotels on customer satisfaction and loyalty in hotel and tourism industry. International
Journal of Green Economics, 11(1), 1-14.
• Zainal, N. R., Kaur, G., Ahmad, N. A., & Khalili, J. M. (2012). Housing conditions and quality of
life of the urban poor in Malaysia. Procedia-Social and Behavioral Sciences, 50, 827-838.
GLOBAL JOURNAL OF PUBLIC HEALTH MEDICINE 2021, VOL 3, ISSUE 1 314
ggggggloYou can also read