OPTIMIZATION OF PROCESS PARAMETERS FOR AUTOMOTIVE PAINT APPLICATION
←
→
Page content transcription
If your browser does not render page correctly, please read the page content below
EASC 2009                                                                           Munich, Germany
4th European Automotive Simulation Conference                                          6-7 July 2009

OPTIMIZATION OF PROCESS PARAMETERS
FOR AUTOMOTIVE PAINT APPLICATION
Stephan Blum
DYNARDO GmbH

Hans-Joachim Neubauer and Norman Henkel
BMW AG

Thomas Lehnhäuser
ANSYS Germany GmbH

SYNOPSIS

The quality of the paint application on automotive industry depends on several process
parameters. Thus, finding an optimal solution based on experimental configuration is tedious
and time consuming. A first step to reduce the effort is to model the application within the
framework of a simulation environment. This has been achieved by BMW in previous
projects.
However, the variation of influencing parameters is still based on manual work, although
corresponding designs can be analyzed efficiently using CFD. Thus, obtaining an optimal
configuration is not trivial, if possible at all, since the sensitivities of the parameters on the
paint quality is unknown.
In this study, we present an approach for the systematic variation of design parameters of
the paint process to quantify their influence on the quality of the paint application. Using that
information it is possible to reduce the design space by neglecting the parameters with low
impact. Based on this design space we extend the procedure to predict an optimal set of
input parameters for an optimal paint application.

1. INTRODUCTION

The quality of the paint application is an important step during the manufacturing process of
a car. This is not only due to the importance of the paint as corrosion protection but also due
to marketing consideration, since the paint influences a client’s first impression on the
automobile. Thus, it is necessary to distribute the paint in such a fashion that all important
parts are covered with an ideally uniform coat thickness. This optimization task has been and
still is carried out using trial-and-error methods based on real hardware. Recently, BMW has
developed a simulation approach to model the paint application process within the
framework of ANSYS FLUENT and its add-on module DLS provided by IPA Stuttgart. It has
been shown that this approach can predict the coat height distribution with an accuracy of a
few percent [1]. Due to the efficiency of varying parameters in the CFD model and evaluating
the corresponding results, BMW has been able to cut down the development time for the
painting of a new car to approximately 50% compared to the purely experimental approach.

To further enhance the simulation approach BMW decided to develop a procedure to
systematically and automatically vary the process parameters and compute the
corresponding simulation results. This goal is obtained by coupling the simulation approach

                                                                                                  1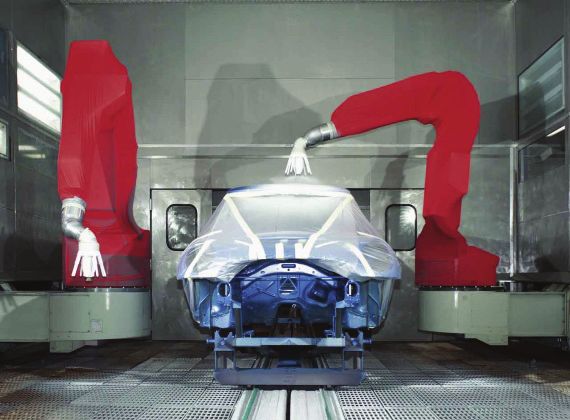
EASC 2009                                                                            Munich, Germany
4th European Automotive Simulation Conference                                           6-7 July 2009

with optiSlang, a tool for multidisciplinary optimization, sensitivity analysis and process
integration. In this scenario, optiSlang defines the values of the process parameters,
transfers them to the simulation model, starts the computation and retrieves a specific result
from the simulation model. This procedure can be applied to automatically scan the design
space to evaluate the sensitivities of the process parameters on the results, to find a
parameter set such that the results become optimal or to analyse the robustness of a
solution against a parameter scattering, which it usually occurs in the manufacturing reality.

Figure 1: Paint application during manufacturing phase (left) and a representation of the
simulation model of for the paint application on the hood (right).

2. SIMULATION OF THE PAINT APPLICATION PROCESS

The modelling within the simulation framework of the dynamic procedure of paint application
consists of two principle steps. In the first step, a simulation using ANSYS CFD is employed
to obtain a static paint distribution on the part to be painted, i.e. without moving the paint
applicator. In a second step the static paint distribution information is integrated along the
path of the applicator. In case of a considerable change of the positioning of the paint
applicator in relation to the car body, the CFD simulation of the static paint distribution is
repeated for this configuration and the integration process can be continued using the new
static paint distribution. It has been shown, that this approach predicts the paint thickness
with high accuracy compared to measurements [1].

Obviously, the overall thickness distribution of paint on the car is directly related to the static
paint distribution computed during the stationary CFD simulation, i.e. if the static paint
distribution fulfils certain requirements, the integration path can be configured such that the
thickness distribution almost uniform. Thus, for understanding the sensitivities of the process
or to optimize the input parameters it is sufficient to consider the static CFD simulation only.

                                                2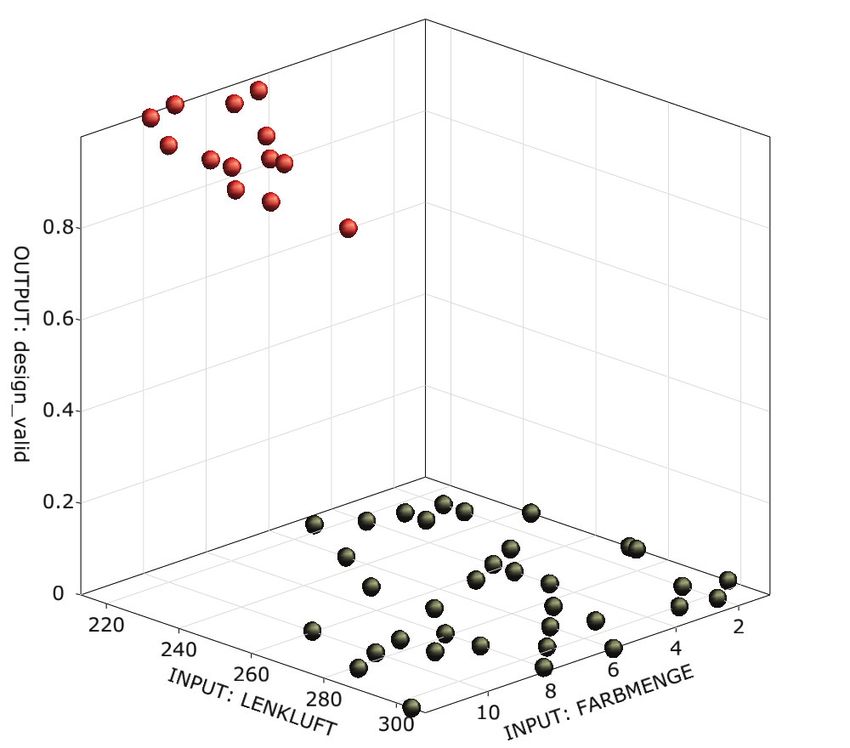
EASC 2009                                                                           Munich, Germany
4th European Automotive Simulation Conference                                          6-7 July 2009

However, in the scope of the static CFD simulations all the relevant physical effects have to
be taken into account. Thus, it is mandatory to understand the real paint application process.
It consists of injecting a paint film onto a rapidly rotating bell, which is located at a certain
distance from the object to be painted. Due to rotational forces the paint film separates as
paint droplets into the air. The size distribution of the resulting droplets depends on the
rotational velocity of the bell, the injected mass flow and the material properties of the paint.
To orient the droplets paths towards the car body, the so called guiding air is produced by
the various nozzles. Finally, to maximize the amount of paint impacting on the car body, an
electrical field is installed which generates a force on the droplets towards the car body.

To model this complex situation in simulation software, the surface mesh of the paint bell
and the painted part are oriented in a first step. Afterwards, the configuration is meshed with
a 3D grid. Based on this mesh the numerical model in ANSYS Fluent is set up. This
accomplished by taking the droplet size distribution from measurements to define
corresponding injections. The electrical field is solved as a set of scalar transport equation.
After solving the flow problem, the amount mass per time unit of paint droplets on each
surface element of the car body can be evaluated. This information is equivalent to the
thickness growth and, therefore, to the coat thickness itself. The entire procedure is
designed such that it runs fully automated based on ASCII input files in which all relevant
information are specified, in particular, all those parameters which are subject for systematic
variation.

2. COUPLING THE SIMULATION MODULE WITH optiSlang

The coupling essentially means to allow optiSlang the modification of the input files with
respect to the input parameters and the evaluation of the solver output files in which the
performance of the design is quantified. Since all input data is specified in the ASCII input
files anyway, the first step is straight forward. In this study we consider 5 input parameters:

    •    Painting distance
    •    Paint mass flow
    •    Rotational velocity of the paint bell
    •    Strength of the electrical field
    •    Mass flow rate of the guiding air

The second step relies on a proper strategy to determine the quality of the resulting paint
thickness on the work piece, represented by one or more numerical value. To do so, the
characteristics of an ideal paint distribution are specified and computed for each of the
simulated paint results. Figure 1 shows the typical distribution of the static paint distribution
as contour plot (left) and as chart representation over a line on the part (right). In contrast to
the result of a real configuration, the ideal paint distribution is shaped like a cylinder with a
fixed radius, as indicated by the green line in the chart representation. The most obvious
differences from the real to the ideal distribution are the zero thickness in the outer region,
the inclination of the shoulders and the constant level in the inner part.

                                                                                                  3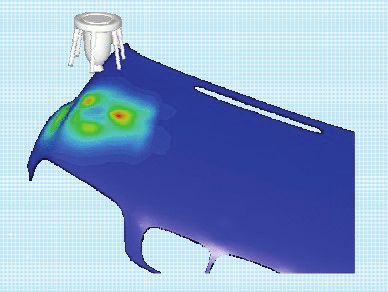
EASC 2009                                                                          Munich, Germany
4th European Automotive Simulation Conference                                         6-7 July 2009

                                                                                    Typical paint distribution
                                                                                    Ideal paint distribution

  Figure 2: Typical paint thickness distribution as contour representation (left) and as chart
                                over the line on the part (right)

In Figure 2, the 3 main paint thickness characteristics for performance quantification of a
design are shown. The first quantity is the so-called sp50-value. It is defined as the diameter
of the paint at 50% of the maximum paint thickness. This value is optimal if it is equal to a
target diameter. The second characteristic is the difference of the maximum and the
minimum value of the thickness (mu-diff). Obviously, this value is ideal if it is zero. The third
characteristic (b-ratio) expresses the inclination of the sides by taking the ratio of the
diameters at different paint thickness heights. This value becomes optimal if it is 1.

Above considerations are true for one slice over the painted part. Since a two-dimensional
distribution has to be quantified, the procedure is carried for 18 slices, incrementally rotated
by 10 degrees around the centre point. An averaging technique over all analyzed slices
yields a representative value for each of the paint characteristics.

                                                4
EASC 2009 Munich, Germany
4th European Automotive Simulation Conference 6-7 July 2009
Fiigure 2: Paiint thicknesss characteri
ristics to qua
antify the pe
erformance of the desig
gn
Beside the three paintp thickn
ness characcteristics, th
he painting efficiency is measureed. This
quantityy (awg) is de efined by th he injected paint masss to the deposited mass on the
he ratio of th
part. It is optimal if 1.
SITIVITY ANALYSIS
4. SEMS A O PROCESS PARAM
OF METERS
A sensiitivity analyysis is reco
ommended as a prepa aration of optimization
o n tasks. Seensitivity
analysiss is used to o scan the design
d spacce by varyinng design optimization
o n parameterrs within
upper and
a lower bounds. Either systtematic sampling me ethods, so called De esign of
ment (DoE) schemes, can be ap
Experim pplied to geenerate dessigns, or sstochastic sampling
s
methods (Plain Mo onte Carlo, Latin Hype ercube Sammpling) can be used. S Stochastic sampling
s
methods are recom mmended fo or most eng parameters in order
gineering prroblems with multiple p
to applyy statistic po
ost processsing. For ke
eeping the number
n of design
d evalu
uations smaall, Latin
Hypercu ube Sampling is the sttochastic sa ampling me ethod of chooice. The foollowing res
sults are
obtainedd by a global sensitivityy analysis [optiSLang
[ documentat
d tion]:
• Glob
bal sensitivvities (whicch optimiza ation param
meter influeences whicch respons se?) by
corre
elation analyysis
• Estim
mation of va ariation of th
he response
es based on
n the define
ed design sp
pace
• Identtification of important input parammeters and possible reduction
r off the design space
dimeension for op ptimization
5EASC 2009 Munich, Germany
4th European Automotive Simulation Conference 6-7 July 2009
• Better understanding of the optimization problem, detecting optimization potential and
extracting start designs for optimization
Setting up the sensitivity analysis requires the definition of the design parameter space with
the corresponding upper and lower bounds. The process parameters paint mass and
rotational speed have been defined as discrete optimization parameters, each with a
corresponding list of discrete values. Possible combinations between these two discrete
parameters were generated by means of a list of conditional dependencies.
The remaining optimization parameters painting distance, potential and steering air were
defined as continuous optimization parameters. Table 1 gives an overview about the
parameters and the corresponding bounds.
Table 1: Definition of optimization parameters
Parameter Type Reference Lower bound Upper bound
Paint mass discrete 200 150 400
Rotational speed discrete 50 40 60
Painting distance continuous 300 250 350
Potential continuous -75000 -90000 -70000
Steering air continuous 260.93 212 309
For the sensitivity analysis of the process parameters 50 design realizations have been
created using Latin Hypercube Sampling. For each design all 5 optimization parameters
have been varied by optiSLang. After all designs have been calculated, it is possible to apply
statistical methods in order to identify sensitivities between design parameters and
evaluation criteria.
An important result of the sensitivity analysis is the estimation of response variation. Basic
statistical measures like minimum, maximum, mean and standard deviation can be
determined. This gives valuable information about potential design improvements and is
helpful for specifying targets for the optimization.
The coefficient of determination (CoD) is a suitable statistical value to quantify, how much of
the variation of a response can be explained by a relation to the input parameters. Values for
the CoD vary between 0 and 100 % and are calculated for linear, quadratic and monotonic
non-linear regression models. The coefficient of important (CoI) quantifies the influence of a
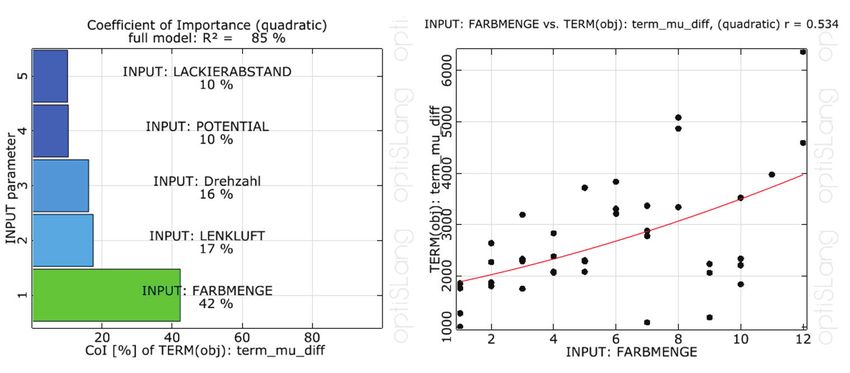
single input parameter on a chosen response. Figure 4 illustrates parameter sensitivities of
the 5 process parameters on the evaluation criterion mu_diff applying the CoI as importance
measure.
The analysis of correlation is used to describe the pair wise relation between design
parameters and responses. A correlation coefficient is calculated to measure the strength of
the relationship between two variables. It is recommended to test for linear, quadratic and
monotonic non-linear correlations. Figure 5 shows the relation between the design
parameter paint mass and the response mu_diff, where every point in the plot represents a
calculated design.
6EASC 2009 Munich, Germany
4th European Automotive Simulation Conference 6-7 July 2009
Figure 4: Parameter sensitivities for the Figure 5: Anthill plot of the relation between the
difference between the maximum and minimum optimization parameter paint mass and the
value of the thickness (mu_diff) evaluation criterion mu_diff
Besides parameter sensitivities for different responses, parameter ranges which lead to
numerical instabilities or insufficient convergence of the simulation result can be easily
identified. In the present study an output flag was introduced which should be 0 if the
simulation was finished successfully and 1 otherwise. A combination of paint mass and
steering air could be identified as the source of instability. Figure 6 shows the infeasible
parameter space in a 3D anthill plot.
Figure 6: Infeasible design region (red) as a combination of paint mass and steering air
7EASC 2009 Munich, Germany
4th European Automotive Simulation Conference 6-7 July 2009
5. OPTIIMIZATION OF THE PROCESS PARAMETE
P ERS
The opttimization ofo paramete ers of a sysstem require es the definnition of an objective function.
f
This funnction is a sum
s of weig
ghted terms and results s in a single
e scalar value. Each te erm may
contain arbitrary mathematica
m al expressio ons and res sponses. The optimize er tries to minimize
m
the valuue of the objjective funcction.
In ordeer to formulate an objjective funcction for th he optimization of paint distribution it is
necessa ary to transsfer existingg subjectivee evaluatioon criteria in
nto numericcal measurres. The
terms of
o the objecttive function may then n be formula ated as abssolute value es of the difference
between n the simu ulation resu ult and the e ideal thicckness disstribution. B Because th his ideal
distributtion can noot be reach hed exactly, there will always be a deviation n of the simmulation
T absolutte values off these deviations are unknown in
result. The n advance b but will sign
nificantly
influencce the convvergence behavior
b of the optimization. The erefore it iss recommended to
introducce scale fa actors for thhe individua al objectivee terms. In the present case, th he scale
factors were determ mined as th he reciproca al of the corresponding g expected value. This s implies
that thee scaled terrm become es 1.0 if thee optimizatiion reachess the corressponding expected
e
value. The
T specificcation of th
he target values requires a com mprehensive e knowledge e of the
system and should d be well-considered ass it influence es the optim
mization ressult.
The forrmulation of the objecctive functio on can be tested on the designss of the se ensitivity
analysiss. A revaluaation of the existing
e 50 designs witth an extend ded problem m specificattion was
performmed. The re evaluation re esults in a ranking of the design ns according g to their objective
o
functionn value. Th he best dessign with th he smallestt objective value shou uld match the t best
design from
f the su
ubjective vieew. Figure 7 shows the e thickness distribution in a sectional view
for all designs fro om the sensitivity an nalysis withh the best design fro om the rev valuation
highlighhted red.
Figurre 7: Thickn
ness distribu
ution of the designs fro
om the senssitivity analyysis with the
e best
deesign (red) according to
t the objecctive function formulatioon
8EASC 2009 Munich, Germany
4th European Automotive Simulation Conference 6-7 July 2009
For the execution of the optimization task, a response surface based method was chosen.
The response surface methodology (RSM) is used to approximate responses in a multi-
dimensional space. For calculating the response surface as a surrogate model of the real
response, both appropriate approximation functions and support points are necessary.
Systematic sampling methods are applied to generate optimal support points for the
approximation function. Gradient-based optimization methods or evolutionary algorithms can
be used for finding optima of the surrogate model.
The quality of results depends on the accuracy of the approximation, which is influenced by
the number of support points, the kind of approximation function used and the design space
itself. The accuracy of the approximation increases if the range of the approximated sub
region is decreased. This principle is used for the adaptive response surface method
(ARSM) where the approximation of responses is calculated for a sub region of the design
space. By adaptively zooming and shifting this sub region, the quality of the approximation is
gradually increased.
The actual optimization was performed for the three continuous process parameters painting
distance, potential and steering air. The discrete parameters paint mass and rotational speed
were set as constant with the values taken from the best design of the sensitivity analysis. D-
optimal sampling in combination with a linear approximation of responses was chosen as
settings for the ARSM algorithm. The number of iterations was limited to 10 which results in a
total number of 71 designs. This enables the computational engineer to perform such an
optimization task in a reasonable time slot. Starting from the best design of the sensitivity
analysis the optimization showed fast convergence of the parameter to optimal values.
Figures 8 and 9 illustrate the parameter convergence of the steering air and the painting
distance over the number of iterations. The results of the optimization regarding the
evaluation criteria of the painting process meet the requirements of an optimal painting
result. Especially for the criteria diameter of the paint and painting efficiency, almost ideal
results could be achieved. Figure 10 contains the optimized process parameters of the best
design and figure 11 shows the corresponding values of the objective function and terms.
9EASC 2009 Munich, Germany
4th European Automotive Simulation Conference 6-7 July 2009
Figure 8: Parametter converg gence and shrinking
s Figure
F 9: Parameter con nvergence and
a shrinkinng
of parameter
p b
bounds over the numbe er of of parammeter bound ds over the number
n of
iteration
ns for the ste
eering air iteratiions for the painting dis
stance
Figure 10: Optimizzed processs parameterrs of the Figure
F 11: Objective
O unction and terms of the
fu e
best design
n best d
design
6. SUMMARY AND D CONCUL LSIONS
In this study,
s the numerical
n a
analysis of the spray paint
p appliccation usingg ANSYS CFDC has
been exxtended to automatica ally vary inp
put parametters and an nalyze the p performancce of the
corresponding dessign with re espect to user-defined d objectivess. This has been achie eved by
coupling g the simu ulation mod dule with optiSLang,
o a tool for multidiscipllinary optim
mization,
sensitivvity analysis and processs integratioon.
With the e help of th
his approach the simulation task is i not only automated, but also extended
to yield additional information n which wou uld be tedio
ous to obta ain with the manual sim mulation
approacch. Beside others, the e additional informatioon includes the sensittivities of th he input
parame eters with re espect to th
he objective e functions and the op ptimal settin
ngs of the process
parame eters for thee corresponding paint application.
a The first enhances th he basic knoowledge
of the paint applicaation proceddure, while the
t latter prrovides direectly one of the key res
sults of a
simulatiion driven process
p devvelopment.
10EASC 2009 Munich, Germany
4th European Automotive Simulation Conference 6-7 July 2009
REFERENCES
[1] Q. Ye et al.: Numerical Simulation of Spray Painting in the Automotive Industry,
Proceedings of 1st European Automotive CFD Conference (EACC), Bingen, 2003
[2] optiSLang – the Optimizing Structural Language Version 3.0, DYNARDO GmbH, Weimar,
2008, www.dynardo.de
[3] WILL, J.; BUCHER, C.: Statistical Measures for Computational Robustness Evaluations
of Numerical Simulation Models, Proceedings of Optimization and Stochastic Days 3.0,
Weimar, 2006
11You can also read