Analysis of collagen fiber domain organization by Fourier second harmonic generation microscopy
←
→
Page content transcription
If your browser does not render page correctly, please read the page content below
Analysis of collagen fiber domain
                 organization by Fourier second
                 harmonic generation microscopy

                 Ara Ghazaryan
                 Halley F. Tsai
                 Gor Hayrapetyan
                 Wei-Liang Chen
                 Yang-Fang Chen
                 Myung Yung Jeong
                 Chang-Seok Kim
                 Shean-Jen Chen
                 Chen-Yuan Dong

Downloaded From: https://www.spiedigitallibrary.org/journals/Journal-of-Biomedical-Optics on 27 Jul 2021
Terms of Use: https://www.spiedigitallibrary.org/terms-of-use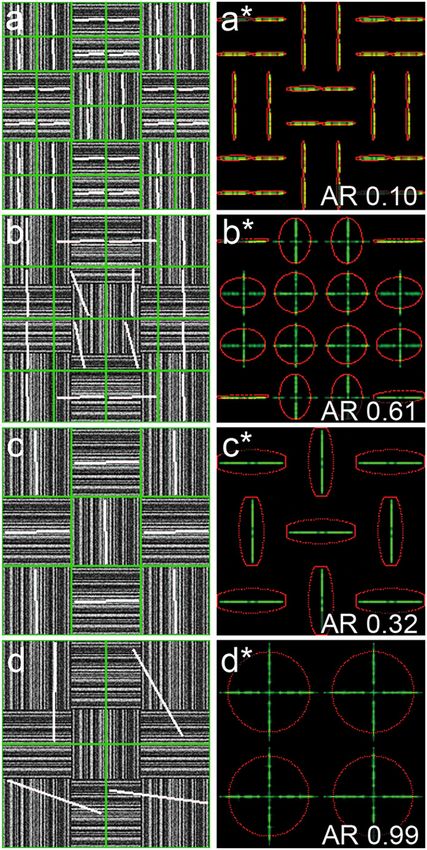
Journal of Biomedical Optics 18(3), 031105 (March 2013)

                Analysis of collagen fiber domain organization by
                Fourier second harmonic generation microscopy
                Ara Ghazaryan,a* Halley F. Tsai,a* Gor Hayrapetyan,b Wei-Liang Chen,a Yang-Fang Chen,a Myung Yung Jeong,c
                Chang-Seok Kim,c Shean-Jen Chen,d and Chen-Yuan Donga,c,e
                a
                  National Taiwan University, Department of Physics, Taipei 106, Taiwan
                b
                  Yerevan State University, Department of Physics, Yerevan, 0025, Armenia
                c
                  Pusan National University, Department of Cogno-Mechatronics Engineering, Busan, Korea
                d
                  National Cheng-Kung University, Engineering Science, Tainan 701, Taiwan
                e
                  National Taiwan University, Center for Quantum Science and Engineering, Taipei 106, Taiwan

                               Abstract. We present an automated and systematic two-dimensional discrete Fourier transform (2D-FFT) approach
                               to analyze collagen fiber organization through the use of second harmonic generation (SHG) microscopy. Average
                               orientations of individual domains and Ising-like order parameters introduced to characterize the correlation
                               between orientations of adjacent domains may be used to quantitatively characterize fibrous tissues. Our approach
                               was applied to analyze tissues including rat tail tendon, mouse skin, bovine corneas, and human corneas. We
                               also show that collagen fiber organization in normal and keratokonus human corneas may be distinguished.
                               The current approach may be used for the quantitative differentiation of SHG collagen fiber morphology in different
                               tissues and may be applied for diagnostic purposes. © The Authors. Published by SPIE under a Creative Commons Attribution 3.0
                               Unported License. Distribution or reproduction of this work in whole or in part requires full attribution of the original publication, including its DOI.
                               [DOI: 10.1117/1.JBO.18.3.031105]

                               Keywords: image analysis; microscopy; pattern recognition.
                               Paper 12402SS received Jun. 28, 2012; revised manuscript received Oct. 1, 2012; accepted for publication Oct. 23, 2012; published
                               online Nov. 22, 2012.

                1     Introduction                                                                      the domain size of analysis and the variation can be viewed as
                                                                                                        a quantitative standard to monitor changes in the fibrous tissues.
                Second harmonic generation (SHG) imaging is a minimally inva-
                                                                                                        However, in previous studies, the sizes of the imaging area used
                sive optical imaging technique with intrinsic optical sectioning
                                                                                                        for 2D-FFTanalysis are usually subjectively chosen.13 Therefore,
                capability.1–3 The coherent nature of SHG leads to an intensity
                                                                                                        the major purpose of the present study was to introduce a
                that is sensitive to the noncentrosymmetric arrangements
                                                                                                        systematic approach to investigate the effect of the size of the
                of molecules4 and in biomedical applications, SHG has been
                                                                                                        analyzed region on the Fourier transformation analysis. In addi-
                shown to be effective in imaging fibrous collagen-rich tissues
                                                                                                        tion to local fiber orientation and aspect ratio, we introduce a
                such as tendons, cartilage, and cornea.5,6 Specifically, SHG                            quantitative parameter evaluating the correlation between the
                microscopy has been successfully used in the label-free identifi-                       orientations of neighboring domains. For this purpose, the
                cation of structural changes in connective tissues under                                Ising-like order parameter was calculated for the fiber angular
                conditions such as skin photoaging, corneal abnormalities                               matrices. In addition to normal connective tissues, we show
                (keratoconus), liver fibrosis, and Osteogenesis imperfecta.7 In tis-                    that our approach can be used to differentiate between normal
                sue engineering applications, SHG imaging has been useful in the                        and pathological fiber orientations in the cornea.
                quantification and monitoring of collagen growths in engineered
                cartilage tissues.8–11 However, most efforts in using SHG imaging
                have focused on morphological characterization rather than                              2     Materials and Methods
                quantification of the structural motifs of the fibrous structures.
                Therefore, combining SHG imaging with the appropriate meth-                             2.1    Sample Preparation
                odology to quantify fiber structure can lead to objective evalua-                       Excised pieces of rat tail tendon (RTT), mouse skin (MS),
                tion in their structural organization. Recently, two-dimensional                        bovine cornea (BC), normal human cornea (NHC), and
                discrete Fourier transform (2D-FFT) has been shown to be an                             human keratoconic cornea (KHC) were used in this study.
                effective tool in analyzing fibril organization.12,13 In particular,                    RTT and MS were prepared from unfrozen tissues, and BC
                the average orientation and anisotropy of fiber tissue within                           was freshly obtained from a local market and prepared within
                any given region of interest (ROI) can be determined using                              an hour prior to experiment. Keratoconic corneas were obtained
                2D-FFT transformation. Both of these parameters vary with                               from surgeries of penetrating keratoplasty from a local hospital.
                                                                                                        Two samples of NHCs were obtained postmortem (Minnesota
                                                                                                        Lions Eye Bank, MN), transferred frozen, prepared, and imaged
                *These authors contributed equally to this work.
                                                                                                        within 3 h after thawing. Prior to multiphoton examination,
                Address all correspondence to: Shean-Jen Chen, National Cheng-Kung Univer-              corneal specimens were stored in 20% dextran/PBS solution
                sity, Engineering Science, Tainan 701, Taiwan. E-mail: sheanjen@mail.ncku
                                                                                                        for about an hour (dextran T500, Pharmacosmos, Denmark)
                .edu.tw, or Chen-Yuan Dong, National Taiwan University, Department of
                Physics, Taipei 106. Tel: 8862-3366 5155; Fax: 8862-3366 5155; E-mail:                  to avoid swelling. All specimens were sealed in glass well slides
                cydong@phys.ntu.edu.tw.                                                                 to avoid dehydration.

                Journal of Biomedical Optics                                                  031105-1                                                     March 2013     •   Vol. 18(3)

Downloaded From: https://www.spiedigitallibrary.org/journals/Journal-of-Biomedical-Optics on 27 Jul 2021
Terms of Use: https://www.spiedigitallibrary.org/terms-of-use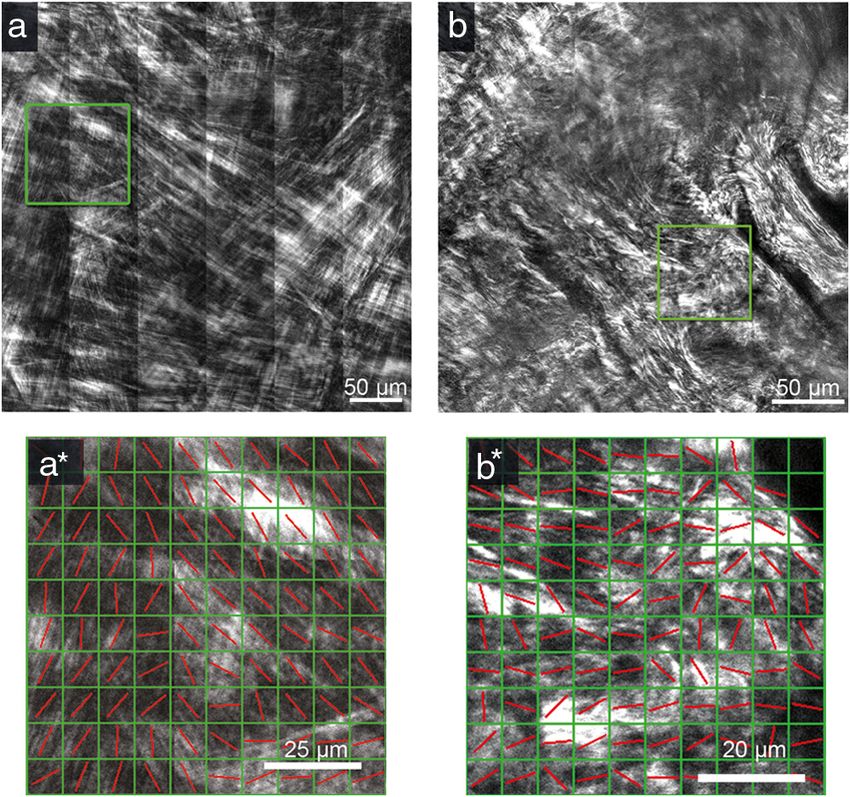
Ghazaryan et al.: Analysis of collagen fiber domain organization by Fourier second harmonic . . .

                2.2     Second Harmonic Generation Microscope
                The SHG microscope used in this study has been described pre-
                viously.8–10 In short, an 80 MHz, 100-fs laser pulse from a ti-sa
                oscillator (Tsunami, Spectral Physics, Mountain View, CA)
                tuned to 780 nm was used as the excitation source. The laser
                beam, directed by scanning mirrors, was expanded and reflected
                onto the back aperture of the focusing objective by a short pass
                dichroic mirror (700dcspxruv-2p, Chroma Technology, Rock-
                ingham, VT). The oil-immersion objective (40×, S Fluor,
                NA1.3, Nikon, Japan) was used for imaging the RTT and
                MS, while for the corneas the water-immersion objective was
                used (40×, S Flour, NA 0.8, Nikon, Japan). For RTT and
                MS, the SHG signal from the sample was collected in the back-
                ward direction by the focusing objective and further guided by a
                dichroic mirror (435DCXR, Chroma technology), whereas SHG
                from corneas was detected in forward geometry using collection
                lens (f ¼ 5 cm, Chroma). In both cases, the SHG signals were
                isolated by a narrow band pass filter (HQ390/22m-2p, Chroma
                technology), and detected by photomultiplier tubes (R7400P,
                Hamamatsu, Japan).

                2.3     SHG Image Acquisition
                SHG images were acquired at the depths of approximately 15 μm
                from the surface of sample for RTT and MS. An automatic trans-
                lation stage was used to translate the specimen following
                the acquisition of small-area images (512 × 512 pixel, 105 ×
                105 μm2 ). These adjacent images were subsequently stitched
                to form large-area images. The large-area images were 210 ×
                210 μm2 (2 × 2 tiles) for RTT, 525 × 525 μm2 (5 × 5 tiles) for
                MS, and 630 × 630 μm2 (6 × 6 tiles) for NHC. All imaging                            Fig. 1 The use of different domain sizes for 2D-FFT analysis of an
                experiments were conducted at the ambient temperature of 19°C.                      artificially produced pattern image. The images on the left show the
                                                                                                    division of the pattern image into domain sizes of (a) 32 × 32 pixels,
                                                                                                    (b) 48 × 48 pixels, (c) 64 × 64 pixels, and (d) 96 × 96 pixels. The
                2.4     Fiber Orientation Analysis                                                  corresponding Fourier transforms of the each region are, respectively
                                                                                                    shown in right along with the fitted ellipses [(a*) to (d*)]. The direction
                To perform fiber organization analysis, the images were first                       of the short axis of the fitted ellipse is shown by white lines for each
                divided into equally sized domains. Next, 2D-FFT was                                domain in (a) to (d). The calculated average AR is also shown on
                performed on each domain. To demonstrate our approach, we                           corresponding images.
                first applied our method on an artificially created fibrous pattern
                (192 × 192 pixels) composed of adjacent domains, each                                  In this example, when fibers within each domain lie along the
                64 × 64 pixels in size, with mutually orthogonal fibrous patterns                   same direction, the 2D-FFT analysis accurately reflects the
                in adjacent domains [Fig. 1(a) to 1(d)]. Next, the pattern was                      direction of the fiber orientation [Fig. 1(a) and 1(c)]. However,
                arbitrarily subdivided into domains of various sizes of                             when the domain contains fibers along two orthogonal direc-
                32 × 32, 48 × 48, 64 × 64, and 96 × 96 pixels in Fig. 1(a)                          tions, the FFT analysis then reflects the average orientation
                to 1(d), respectively. The 2D-FFT analysis was applied on                           of the fibers within the domain. Note, that in the latter case
                each subdivided domain, and the corresponding transformed                           AR values are comparatively bigger [Fig. 1(b) and 1(d)].
                images in the Fourier domain are shown in Fig. 1(a*) to                             According to our estimate, for a good correlation between
                1(d*) in green. This procedure then was followed by a single                        the pattern line directions on images and those estimated
                pixel erosion-dilation process in order to smooth and delineate                     from 2D-FFT the average AR value should be less than 0.5.
                the contours of the transformed image.14 Quantification of                          Note that this criterion, as well as the optimal domain sizes,
                the fiber geometry was then performed by fitting by an ellipse                      would depend on the characteristic extent of correlation in
                [shown in red in Fig. 1(a*) to 1(d*)] which allows the charac-                      organization and needs to be derived for each case. In the
                terization of each domain by two parameters: (1) the angle                          case of collagen fiber factors, such as tissue type, image quality,
                between horizontal axis and the short axis of the ellipse,                          resolution, and contrast would matter. Once these parameters are
                and (2) the aspect ratio (AR) between the short and long                            fixed, the corresponding estimate can be used unambiguously
                axes of the ellipse. The orientation of the short axis of the ellipse               henceforth.
                for each domain is shown by the white lines in Fig. 1(a) to
                1(d). Since it is known that the short axis of the fitted ellipse                   2.5    Correlation Parameter
                is parallel to the average fiber orientation within each domain
                and that the AR describes the directional anisotropy, orientation                   In addition to performing FFT analysis, we determined the
                properties associated with the fibers in each subdivided domain                     collinearity of directions between adjacent domains through the
                can be determined.13                                                                use of two-dimensional the Ising-like order parameter15

                Journal of Biomedical Optics                                               031105-2                                                 March 2013    •   Vol. 18(3)

Downloaded From: https://www.spiedigitallibrary.org/journals/Journal-of-Biomedical-Optics on 27 Jul 2021
Terms of Use: https://www.spiedigitallibrary.org/terms-of-use
Ghazaryan et al.: Analysis of collagen fiber domain organization by Fourier second harmonic . . .
1 XN −1 → → 2 → → 2 3 Results and Discussion
H¼ ½ðS i;j · S i;jþ1 Þ þ ðS i;j · S iþ1;j Þ − 1
ðN − 1Þ2 i;j¼1 Following a demonstration of our method with an arbitrarily
generated pattern in Fig. 1, we applied our approach to more
(1) complicated fibrous tissues acquired through SHG imaging.
Shown in Fig. 2(a) to 2(d) are the SHG images of RTT, MS,
→ → BC, and NHC, respectively. Next, the corresponding images
where N is number of domains, ðS i;j · S i;jþ1 Þ is scalar product were subdivided into different domains (each 32 × 32 pixels,
→ →
of unit vectors S i;j and S i;jþ1 , which represent orientations of 6.6 × 6.6 μm2 ) in which 2D-FFT was performed [Fig. 2(a*)
ði; jÞ and (i, j þ 1) domains with tilt angles (θi;j , to 2(d*)]. In these examples, since the fibers are not perfectly
θi;jþ1 Þ ∈ ð− π2 ; π2. Specifically, H is an analog of configuration aligned along a given direction within each domain, the AR
energy in the XY model of the nearest neighbor case without values derived from the fitted ellipses of the FFT image
external field.16 H can be used to quantify overall directional would increase compared to the case of perfectly aligned fibers.
dispersion, hence it provides a numerical value of image turbid- Also shown in Fig. 2(a*) to 2(d*) are red lines corresponding to
ity. Since the derived average fiber orientation within each domain.
As in the case of the arbitrarily generated fibrous pattern, the
result of the 2D-FFT analysis is highly dependent on the size of
→ → → →
ðS i;j · S i;jþ1 Þ ¼ jS i;j jjS i;jþ1 j cosðθi;j − θiþ1;j Þ the domain chosen. With a reasonably small domain size, the
local fiber orientation can be better determined. However, a
¼ cosðθi;j − θiþ1;j Þ; (2) domain size too small would contain an insufficient amount
of information of fiber morphology for accurate determination
of fiber direction. With a large domain size, the 2D-FFT analysis
for our case, H may be written as
would yield an average orientation within the domain and details
of local fiber orientation would be lost.
1 X
N −1 To demonstrate these features, 2D-FFT analysis was per-
H¼ 2
½cos2 ðθi;j − θi;jþ1 Þ formed using a range of domain sizes from 16 × 16 to
ðN − 1Þ i;j¼1
512 × 512 pixels which corresponded to actual image size of
þ cos2 ðθi;j − θiþ1;j Þ − 1: (3) 3 × 3 μm2 to 100 × 100 μm2 , respectively. Following the analy-
sis, the average AR values were obtained from all domain sizes
and the results are shown in Fig 3. In the cases of MS and RTT,
Therefore, H represents the nearest neighbor correlation the AR values are the result of averaging 10 images taken from 2
between domains, allowing us to describe the whole image specimens; 5 from each. In the case of BC, ARs from images
with a single parameter. Theoretically, H takes on values obtained at 10 different depths at 100 μm apart are averaged.
between −1 and 1, where H ¼ 0 stands for a completely random NHC data represent values from forward SHG images obtained
orientation of domains without any correlations, H ¼ 1 repre- at 6 depths, 100 μm apart obtained from 2 specimens. A two-
sents the case of an image with parallel domains and, finally, sided student’s t-test was used to compare parameters obtained
H ¼ −1 corresponds to the case of perfectly orthogonal for different specimens and the level of statistical significance
neighbors, i.e., we have completely anti-correlated alignment. was calculated using IBM SPSS software (Chicago, IL).
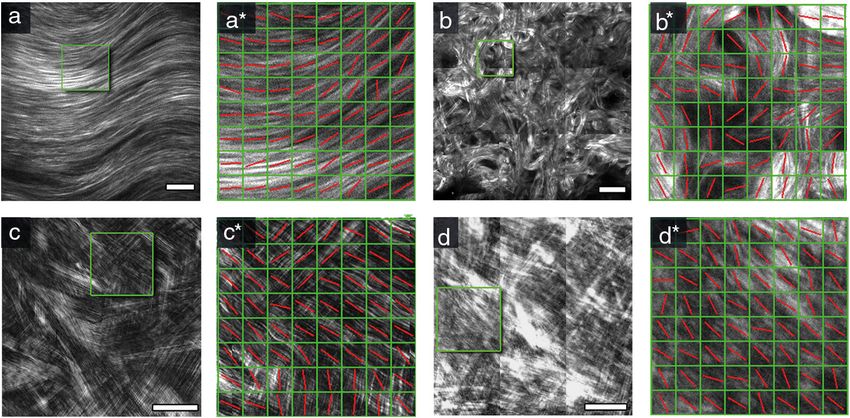
Calculation of the order parameter H was performed using As Fig. 3 shows, the minima of the averaged AR values occur
custom IDL (IDL 6.4, ITT Visual Information Solutions, when the domain sizes are between 19 × 19 and 36 × 36 pixels
CO), Wolfram Mathematica (WM 8, Wolfram Research, Inc., (corresponding to 3.7 × 3.7 and 8.2 × 8.2 μm2 ). Furthermore,
IL), and MS VBA (MS Office Plus 2010, Microsoft Corpora- the ARs of different fibrous architectures show similar trends
tion, WA) software. at domain sizes below that at minimum AR. This observation
Fig. 2 SHG intensity images of (a) RTT, (b) MS, (c) BC, and (d) NHC. Shown in (a*) to (d*) are the corresponding 2D-FFT analysis within the chosen
domains (each 32 × 32 pixels or 6.6 × 6.6 μm2 ). The bar on images is 40 μm.
Journal of Biomedical Optics 031105-3 March 2013 • Vol. 18(3)
Downloaded From: https://www.spiedigitallibrary.org/journals/Journal-of-Biomedical-Optics on 27 Jul 2021
Terms of Use: https://www.spiedigitallibrary.org/terms-of-useGhazaryan et al.: Analysis of collagen fiber domain organization by Fourier second harmonic . . .
Fig. 3 Dependence of averaged ARs on the domain size chosen for 2D-
FFT analysis of SHG images acquired from MS, RTT, BC, and NHC.
Average ARs for MS and RTT are the results obtained from 5 images;
averages from 10 images were calculated for BC and NHC. SHG images
of corneas were obtained in the forward direction. Fig. 4 Representative FSHG images of normal and keratoconus human
corneas, as well as fiber orientation analysis of arbitrary selected ROIs
from these images. (a) FSHG of NHC and (b) FSHG of KHC. (a*) and (*b)
is indicative of the fact that when domain size is decreased, the are results of 2D-FFT analysis of ROIs outlined in (a) and (b), respec-
determination of general fiber orientation becomes erroneous. tively, analyzed using domain size of 36 × 36 pixels for NHC and 32 ×
On the other hand, increasing the domain sizes will result in 32 pixels for KHC. FSHG images were acquired at 100 μm depth.
the inclusion of too many details of local fiber orientations,
hence the averaging and loss of information on fine structure. As a final example of the potential applicability of our
However, as domain size increases beyond the point of mini- method in distinguishing normal and pathological tissues, we
mum AR, our analysis starts to reveal differences between applied the 2D-FFT approach to analyze collagen fiber morphol-
the different tissue morphologies. First, note that for the case ogy in normal and pathological human corneas. Specifically,
of RTT, a relatively low AR value (Ghazaryan et al.: Analysis of collagen fiber domain organization by Fourier second harmonic . . .
parameter was calculated for entire images obtained at 6 of Korea, funded by the Ministry of Education, Science, and
depths for each specimen. AR values were calculated for differ- Technology, South Korea (grant No. R31-2008-000-20004-0).
ent domain sizes and the minimum was determined to be 32 ×
32 (6.6 × 6.6 μm2 ) for KHC and 36 × 36 (7.4 × 7.4 μm2 ) for
NHC. Figure 4(a*) and 4(b*) show 2D-FFT analysis results References
of arbitrarily chosen ROIs from images 4(a) and 4(b) using 1. P. J. Campagnola and L. M. Loew, “Second-harmonic imaging
the domain sizes corresponding to minimum average AR. microscopy for visualizing biomolecular arrays in cells, tissues and
In addition, the calculated average correlation parameters for organisms,” Nat. Biotechnol. 21(11), 1356–1360 (2003).
the entire area of normal and keratoconus cornea images are 2. A. Zoumi, A. Yeh, and B. J. Tromberg, “Imaging cells and extracellular
matrix in vivo by using second-harmonic generation and two-
shown in Fig. 5. The average correlation parameters correspond- photon excited fluorescence,” Proc. Natl. Acad. Sci. U. S. A. 99(17),
ing to domain size 36 × 36 pixels of minimum AR values are 11014–11019 (2002).
0.53 0.02 and 0.43 0.03 for normal and keratoconus cor- 3. W. R. Zipfel et al., “Live tissue intrinsic emission microscopy using
neas, respectively (p < 0.005). This serves as an example of multiphoton-excited native fluorescence and second harmonic genera-
the quantification of image morphology and shows that quanti- tion,” Proc. Natl. Acad. Sci. U. S. A. 100(12), 7075–7080 (2003).
tative comparison of differences of fiber order can be performed. 4. L. Moreaux, “Coherent scattering in multi-harmonic light microscopy,”
Biophys. J. 80(3), 1568–1574 (2001).
5. A. T. Yeh et al., “Selective corneal imaging using combined second-
4 Conclusion harmonic generation and two-photon excited fluorescence,” Opt.
In this study, 2D-fast Fourier transform analysis was developed Lett. 27(23), 2082–2084 (2002).
and applied for morphological analysis of SHG images of dif- 6. P. Stoller et al., “Polarization-modulated second harmonic generation in
ferent connective tissues. An approach, based on average AR collagen,” Biophys. J. 82(6), 3330–3342 (2002).
7. S. J. Lin et al., “Evaluating cutaneous photoaging by use of multiphoton
estimation was developed, which allows for the evaluation of
fluorescence and second-harmonic generation microscopy,” Opt. Lett.
actual fiber directions. We found that both the aspect ratios and 30(17), 2275–2277 (2005).
correlation parameter can be used to quantify differences in tis- 8. V. Hovhannisyan et al., “Photophysical mechanisms of collagen
sue morphology. While the aspect ratio analysis characterizes modification by 80 MHz femtosecond laser,” Opt. Express 18(23),
local fiber orientation within the ROI domains, the correlation 24037–24047 (2010).
parameter is effective in revealing the orientation order among 9. Y. Sun et al., “Imaging tissue engineering scaffolds using multiphoton
the ROIs. To avoid ambiguity, our analysis was performed on microscopy,” Microsc. Res. Tech. 71(2), 140–145 (2008).
10. W. L. Chen et al., “Multiphoton imaging and quantitative analysis of
systematically selected ROI sizes and we found that the depen- collagen production by chondrogenic human mesenchymal stem cells
dence of AR and correlation parameters on ROI sizes can be cultured in chitosan scaffold,” Tissue Eng. C 16(5), 913–920 (2010).
used as additional metrics for characterization fiber orientation. 11. P. J. Su et al., “The discrimination of type I and type II collagen and the
In addition, to distinguish fiber morphologies in normal tissues label-free imaging of engineered cartilage tissue,” Biomaterials 31(36),
such as RTT, MS, or BC, we found that organizational differ- 9415–9421 (2010).
ences between normal and pathological cornea (keratoconus) 12. R. A. Rao, M. R. Mehta, and K. C. Toussaint, “Fourier transform-
can be achieved. The demonstrated approach can be used for second-harmonic generation imaging of biological tissues,” Opt.
Express 17(17), 14534–14542 (2009).
automated morphological analysis of tissue fibers and may 13. P. Matteini et al., “Photothermally-induced disordered patterns of
be extended for diagnostic purposes. corneal collagen revealed by SHG imaging,” Opt. Express 17(6),
4868–4878 (2009).
Acknowledgments 14. S. W. Smith, The Scientist and Engineer’s Guide to Digital Signal Pro-
We acknowledge the support of the National Science Council cessing, 1st ed., p. 626, California Technical Pub., San Diego, California
(1997).
in Taiwan (NSC 98-2112-M-002-008-MY3, NSC 99-2221-
15. R. J. Baxter, “The inversion relation method for some two-dimensional
E-002-096-MY3), the National Health Research Institutes exactly solved models in lattice statistics,” J. Stat. Phys. 28(1), 1–41
(NHRI-EX100-10041EI), the Center for Quantum Science and (1982).
Engineering (10R80914-1), and the National Taiwan University 16. P. M. Chaikin and T. C. Lubensky, Principles of Condensed Matter
(10R70804). Additional support was provided by the World Physics, p. 699, Cambridge University Press, Cambridge, New York,
Class University Program of the National Research Foundation NY (1995).
Journal of Biomedical Optics 031105-5 March 2013 • Vol. 18(3)
Downloaded From: https://www.spiedigitallibrary.org/journals/Journal-of-Biomedical-Optics on 27 Jul 2021
Terms of Use: https://www.spiedigitallibrary.org/terms-of-useYou can also read