Quantifying Expansion Microscopy with DNA Origami Expansion Nanorulers
←
→
Page content transcription
If your browser does not render page correctly, please read the page content below
bioRxiv preprint first posted online Feb. 14, 2018; doi: http://dx.doi.org/10.1101/265405. The copyright holder for this preprint
 (which was not peer-reviewed) is the author/funder, who has granted bioRxiv a license to display the preprint in perpetuity.
                              It is made available under a CC-BY-NC-ND 4.0 International license.

                  Quantifying Expansion Microscopy with DNA Origami
                                 Expansion Nanorulers

                                            Max B. Scheible1, Philip Tinnefeld2*

                          1
                         GATTAquant GmbH, Am Schlosshof 8, 91355 Hiltpoltstein, Germany
            2
                Department Chemie and Center for NanoScience (CeNS), Ludwig-Maximilians-Universitaet
                         Muenchen, Butenandtstr. 5-13 Haus E, 81377 Muenchen, Germany

                               *Corresponding author: philip.tinnefeld@cup.uni-muenchen.de

          In the past decade super-resolution microscopy1,2 developed rapidly and
          allowed seeing new structural details in fluorescence microscopy, especially
          in the field of bioimaging3-6. Most of the evolving techniques like (d)STORM7,8,
          STED9 or SIM10 – just to name a few – focused on overcoming the diffraction
          limit11 by increasing the technical resolution of the microscope, often in
          combination with specifically designed probes, for example by using blinking
          fluorescent dyes7,8,12,13. But the approach to improve the effective microscope
          resolution of a system is not the only way to reveal new insights. An
          alternative approach is based on physically expanding the sample to increase
          its size by a multiple and to subsequently image the sample by conventional
          fluorescence microcopy.14 The technique termed expansion microscopy
          (ExM) allows effective resolution below the diffraction limit and therefore
          directly complements and competes with established super-resolution
          techniques, but offers the advantage to use standard confocal or wide-field
          microscopes.
          The idea behind ExM is to embed the sample – for instance tissue or fixed
          cells – in an electrolytic polymer and to expand the gel by dialysis to gain a
          physical magnification. To visualize the target of interest, the target is labeled
          with an antibody-fluorophore complex, which is further cross-linked to the
          polymer before expansion14,15. After digesting the sample, the fluorophore is
          still linked to the polymer mesh, mimicking shape, structure and dimension of
          the original target structure. Subsequent expansion of the polymer then allows
          diffraction-limited imaging with converted resolutions down to 70 nm. In the
          original work, labeling was carried out by a primary antibody and a DNA
          labeled secondary antibody. The DNA strand served as adapter for a
          complementary DNA strand that carries both functionalities, i.e. the
          fluorescent dye and the reactive acrydite group for connecting to the polymer.
          Variations of the original expansion microscopy were demonstrated using for
          instance RNA label in combination with FISH16 or completely avoiding
          nucleotides by direct-labeling via proteins15. Usually these techniques reach
bioRxiv preprint first posted online Feb. 14, 2018; doi: http://dx.doi.org/10.1101/265405. The copyright holder for this preprint
(which was not peer-reviewed) is the author/funder, who has granted bioRxiv a license to display the preprint in perpetuity.
It is made available under a CC-BY-NC-ND 4.0 International license.
macroscopic expansion factors (EFma) of 3-5 (the factor of size increment of
the side length of the gel before and after expansion).14-16 The expansion
factor can be improved by applying different electrolytic gels (EFma up to 10)17
or by using an approach called iterative expansion microscopy18. Here, two
successive gels are applied to the same sample reaching an EFma of up to 20,
which allows resolutions down to 25 nm. Alternatively higher resolutions can
be achieved by combining ExM with other super-resolution techniques like
structured illumination microscopy (SIM) to image cellular components with a
resolution down to 30 nm.19
Generally, the magnification achieved by expanding the gel is quantified by
consulting the macroscopic swelling of the gel. It currently remains an open
question and a challenge to objectively evaluate whether the macroscopic
swelling of the gel homogeneously correlates with the expansion of target
structures on the microscale. Is the expansion isotropic and homogeneous?
Do surface effects and breaks play a role? Ultimately, the resolution
improvement of expansion microscopy should be limited by the mesh size of
the polymer matrix. Could this limit be visualized?
To quantify the microscopic expansion factor (EFmi) – instead of the
macroscopic one – a biocompatible soft matter with defined properties is
required, so that the expansion can be tracked and evaluated from the inside
of the gel. Here the advantages of DNA nanotechnology come into play. In the
past decade, nanoscale structures made from DNA conquered the field of
biotechnology20, especially due to the development of the DNA origami
technique21. This technique allows building of arbitrary two- and three-
dimensional shapes with defined dimensions of up to a few hundred
nanometers22,23, a size range, which was not accessible by biosynthetic
approaches before. The ability to precisely modify these structures at will by
linking molecules to the DNA at defined positions enabled a completely new
type of functional nanomaterial.24-27 Using fluorophores as specific markers on
the nanostructure and separating these fluorescent marks with a defined
distance creates a new class of measurement standards: the DNA
nanorulers.28-30
In this work we transfer the concept of DNA origami nanorulers to expansion
microscopy to quantify the magnification of the sample in 2D and to determine
the microscopic expansion factor EFmi. To this end, we modify a nanoruler
with 160 nm spacing between two marks in a way that we can crosslink the
dye labels to the polymer network and expand it. We demonstrate that a
structure with a defined pattern below the diffraction limit can be imaged with
a conventional fluorescence microscope by means of ExM. DNA nanorulers
will enable to resolve the open quantification questions of expansion
microscopy and could even be applied as in situ measuring reference
samples.bioRxiv preprint first posted online Feb. 14, 2018; doi: http://dx.doi.org/10.1101/265405. The copyright holder for this preprint
(which was not peer-reviewed) is the author/funder, who has granted bioRxiv a license to display the preprint in perpetuity.
It is made available under a CC-BY-NC-ND 4.0 International license.
The expansion nanoruler is a modified version of a GATTA-SIM 160R
nanoruler labeled with ATTO 647N dyes (Fig. 1a). On this DNA origami
platform two areas are specified, so-called marks, with a center-to-center
distance of 160 nm and a mark size of ~20 nm (Supplemental Fig. S1 and
S2). Each mark consists of twenty single-stranded staple extensions, wherein
each extension is a 21 nucleotide long single DNA strand with a designed
sequence S1´. S1´ extensions can be labeled with complementary S1
strands, which fulfill a twofold purpose. First, an ATTO 647N dye is
conjugated to the 3´-prime end of the S1 strand, which enables imaging under
pre- and post-expansion conditions. Second, the 5´-prime end is labeled with
an acrydite group to covalently bind to the polymer matrix during gelation.
Figure 1: Procedure for expanding DNA nanorulers in 2D. a) S1 strands are labeled with fluorescent
ATTO 647N dyes and acrydite groups. They can hybridze to complementary S1’ strands protruding
from a DNA origami platform (nanoruler). The platform provides two separated marks with twenty S1’
extensions, respectively. b) The nanorulers carrying two marks separated by 160 nm are immobilised
on a BSA/neutravidin surface. c) Diffraction-limited imaging can not resolve the two marks and shows
them as a single overplapping PSF. d) By adding an electrolytic gel the acrydite of the S1 strand
crosslinks to the acrylamide during the polymerization process. e) Denaturing of the DNA separates
the S1 strand from the nanoruler while the strand maintains its position linked to the polymer matrix
and subsequently mimics the marks of the ruler. f) Expansion of the gel increases the distance
between the two marks. g) Epi wide field imaging displays the two marks of the expansion nanoruler
without overlapping PSFs.
The expansion nanoruler is additionally equipped with biotin anchors on the
bottom side of the platform to immobilize it on a BSA/neutravidin surface (Fig.
1b). Single nanorulers are then imaged on a single-molecule sensitive wide
field or TIRF setup (Fig. 1c). Since the nanoruler displays a distance of 160
nm (Supplemental Fig. S2), which is well below the diffraction limit of ~283 nm
(Supplemental Information), the point spread functions (PSFs) of each mark
overlap and every nanoruler appears as one single spot. Embedding the
sample in an actively polymerizing electrolytic polyacrylamide gel leads to
covalent binding of the nanoruler to the surrounding polymer network via the
acrydite modification, so that the S1 strands are connected between the
immobilized nanorulers and the established gel matrix (Fig. 1d).bioRxiv preprint first posted online Feb. 14, 2018; doi: http://dx.doi.org/10.1101/265405. The copyright holder for this preprint
(which was not peer-reviewed) is the author/funder, who has granted bioRxiv a license to display the preprint in perpetuity.
It is made available under a CC-BY-NC-ND 4.0 International license.
By a denaturing step the DNA origami platform is decomposed and
subsequently the DNA duplex between nanoruler and the S1 strands is
dissociated (Fig. 1e). The fluorescently labeled S1 strands mimic the positions
of the two marks on the nanoruler and are simultaneously bound to the gel.
Linear expansion of the gel increases the distance between the two marks
leaving the diffraction-limited regime behind (Fig. 1f). Subsequent imaging
displays the two separated marks even with conventional microscopes (Fig.
1g).
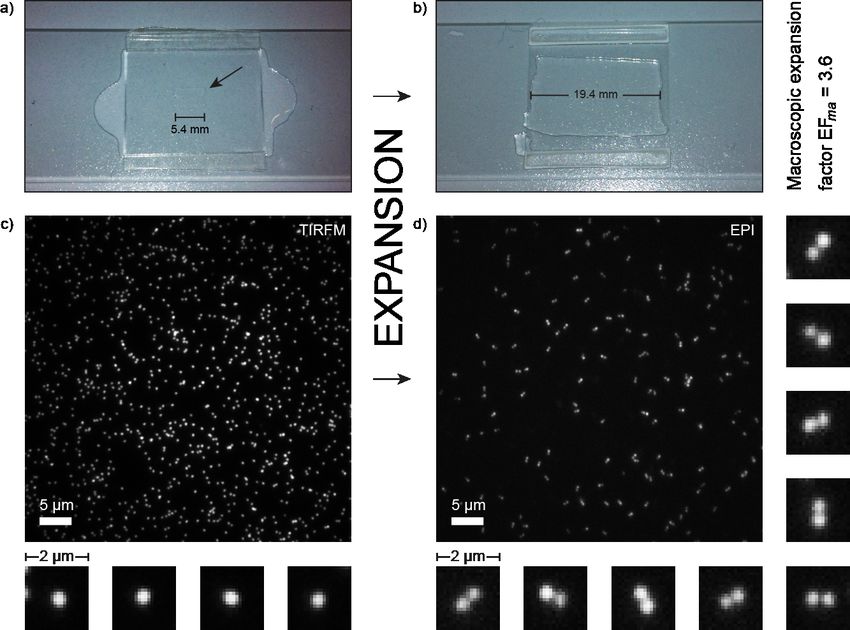
Experimentally, the gel was expanded on top of a microscope coverslip. To
improve the plain attachment to the coverslip the gel was loosely covered with
a second coverslip. The ratio of the size of the gel before and after expansion
(Fig. 2a and b) yields the macroscopic expansion factor EFma. Taking the
values from Figure 2a and b the expansion factor is EFma = 3.6. Using the
specifications of the expansion nanoruler with an intermark distance of dpre =
(160 ± 9) nm (Supplemental Fig. S2) we would expect a post-expanded
distance d´post = 3.6 * dpre = (576 ± 32) nm.
Figure 2: a) The electrolytic polyacrylamide gel before expansion in between two coverslips with an
average width of 5.4 mm. b) The same gel after expansion with an average width of 19.4 mm. The
macroscopic expansion factor is 3.6. c) TIRFM image of immobilized nanorulers before gelation and
expansion carrying ATTO 647N dyes. Nanorulers with 160 nm intermark distances appear as one spot
due to the diffraction-limited imaging (selected zoom-ins). d) After expansion nanorulers are imaged
in epi-fluorescence and are clearly resolved, represented by two adjacent spots (selected zoom-ins).
Imaging of the pre-expanded nanorulers in TIRF mode shows a
homogeneous distribution of single spots, which originates from thebioRxiv preprint first posted online Feb. 14, 2018; doi: http://dx.doi.org/10.1101/265405. The copyright holder for this preprint
(which was not peer-reviewed) is the author/funder, who has granted bioRxiv a license to display the preprint in perpetuity.
It is made available under a CC-BY-NC-ND 4.0 International license.
overlapping PSFs of the two marks on the expansion nanoruler (Fig. 2c). The
surface density of immobilized structures is adequate, showing many single
structures with a narrow intensity distribution (Supplemental Fig. S3) and
rather few overlaying structures/clusters. Selected single structures show
spherical PSFs with an average FWHM of (363 ± 8) nm. The substructure
with 160 nm spacing is therefore too small to shape the superposed PSFs into
an elliptic contour.
After expansion nanorulers are visible in the gel roughly 1 µm above the
coverslip surface and are therefore imaged in EPI mode (Fig. 2d). It is clearly
observable that there is a vanishing number of single spots but pairs of two
adjacent spots displaying the expanded nanoruler. The density of structures is
reduced in accordance with the volume increase of the sample. This change
in structural density can provide a first hint towards a quantitative analysis of
the microscopic expansion. Before expansion five images with npre = 3398
structures in total are analyzed and yield a structural density of (2.59 ± 0.15)
structures per 10 µm2. After expansion this density drops to (0.37 ± 0.04)/10
µm2 (eleven images with npost = 1077 structures) resulting in a rough estimate
for the microscopic expansion factor with EFmi(density) ≈ 2.6. The clear
presence of two-spot structures in combination with the drop in structural
density shows that DNA origami nanorulers initially bound to a coverslip can
be quantitatively and homogenously expanded and are therefore applicable
as nanoscopic expansion rulers.
For further quantification, the expansion nanorulers are analyzed using the
GATTAnalysis software. GATTAnalysis uses an automated spot finder and
fits two 2D-Gaussians to each structure to determine the center-to-center
distance and the FWHM of the spots. The distance analysis of npost = 1077
structures yields an average distance of dpost = (445 ± 56) nm (Fig. 3a). Thus
the microscopic expansion factor referring to the total number of expanded
nanorulers can be calculated to EFmi(total) = dpost/dpre = 2.8. The size of the
PSF of each spot is (351 ± 18) nm and therefore similar to the FWHM values
in the pre-expanded state (Fig. 3b).bioRxiv preprint first posted online Feb. 14, 2018; doi: http://dx.doi.org/10.1101/265405. The copyright holder for this preprint
(which was not peer-reviewed) is the author/funder, who has granted bioRxiv a license to display the preprint in perpetuity.
It is made available under a CC-BY-NC-ND 4.0 International license.
Figure 3: a) Quantitative analysis of n = 1077 nanorulers yields an average ruler distance of (445 ± 56)
nm after expansion. b) The FWHM after expansion is (351 ± 18) nm. Results were obtained by an
automated analysis using the GATTAnalysis software.
To investigate the homogeneity of the expansion the eleven single images
were individually analyzed resulting in individual expansion factors
(Supplemental Information). The microscopic expansion factor was
homogeneous over a large part of the coverslip and different regions yield a
factor of EFmi(individual) = 3.0 ± 0.1. Furthermore, we could not detect any
breaks or cracks of the gel but it appeared homogeneous in the full area
investigated.
It turns out that the microscopic expansion factor deviates from the
macroscopic one and it is slightly smaller. Apart from that different
approaches to determine the microscopic expansion factor show additional
deviations between the approaches. The origin of the deviation of
macroscopic and microscopic expansion factor is not straightforward. In first
approximation, the microscopic expansion factor is based on the properties of
the DNA nanorulers. The validity to use nanorulers as benchmark structures
and traceable measurement standards has recently been shown by Raab et
al. who verified their usefulness as reliable and quantitative tool.31 The
covalent binding to the polymer matrix with subsequent expansion, however,
introduces various imponderables, which can directly influence the measured
intermark distances. We see two main possibilities for the different
microscopic and macroscopic expansion factors. First, the expansion rulers
are initially placed at the coverslip surface. The swelling occurring directly at
the interface between gel and coverslip might be reduced by friction yielding
less expansion close to the coverslip. Second, the nanorulers might be tilted
during expansion which is not detected in our 2D imaging and analysis. At this
point, we cannot decide what the true origin of the deviation is. Both of the
discussed error sources considered represent a sort of deviation from ideal
isotropic expansion behavior, which deserves further attention and indicates
the need to quantitatively and microscopically determine expansion factors.
The fact that the microscopic expansion factor shows slight deviations itself –
with regards to the analysis method, which is used – is helpful when it comesbioRxiv preprint first posted online Feb. 14, 2018; doi: http://dx.doi.org/10.1101/265405. The copyright holder for this preprint
(which was not peer-reviewed) is the author/funder, who has granted bioRxiv a license to display the preprint in perpetuity.
It is made available under a CC-BY-NC-ND 4.0 International license.
to the interpretation of the data. The results for EFmi(density) obtained from
the structural density analysis are only a rough estimate but already get close
to the other expansion values and therefore illustrate an approach, which is
fast and qualitative to retrieve. Interestingly, this value even shows the
smallest expansion factor. This is a very good hint that the binding efficiency
of nanorulers to the gel matrix is very high, since unbound structures would be
digested and not expanded and subsequently lead to a lower structural
density after expansion. Low structural densities would induce a bias towards
larger expansion factor values, which cannot be found in this case.
Consequently, a small expansion factor EFmi(density) strengthens the claim of
a very high coupling yield.
The difference between the microscopic expansion factor EFmi(total) (using
the total number of nanorulers) compared to the individual approach with
EFmi(individual) (to explore the homogeneity of the expansion) can be traced
back to different statistical approaches to evaluate the data (Supplemental
Information). However, EFmi(individual) yields a very small standard deviation
of only 0.1 proving the homogeneous expansion over a large field of the
coverslip.
In this work, we showed that DNA origami nanorulers that had proven their
potential for several super-resolution techniques already29,30,32 can be
especially valuable tools for the microscopic characterization of magnification
and resolution in expansion microscopy. We found a substantial deviation of
microscopic and macroscopic expansion factor which should be considered
for the quantitative discussion of expansion microscopy data of biological cells
and tissues. Beside that we showed that different approaches to determine
the microscopic expansion factor can deviate from each other – a fact which
should be taken into account and discussed in detail when interpreting the
quantitative expansion of the target. The introduced expansion nanorulers
present a powerful tool to reveal the true origin of anisotropy and
heterogeneity in expanded microscopy specimen. As the expansion
nanorulers undergo the same coupling and expansion process as the
biological target structure the found deviations of expansion factors should be
representative for the biological target as well.
The shown approach helps to develop the expansion microscopy technique
from an imaging application towards a more quantitative evaluation of imaging
data. 3D studies will be a key to implement the nanoruler tools directly into
cell/tissue imaging and to combine the biological question with quantitative
conclusions. Since the proof-of-principle is demonstrated a new field opens up
with the potential to answer questions with respect to quantitation of
microscopic magnification, the anisotropy or local dependence of
magnification, or the binding efficiency of dyes to the gel. Ultimately, the
maximum possible resolution of expansion microscopy related to the densitybioRxiv preprint first posted online Feb. 14, 2018; doi: http://dx.doi.org/10.1101/265405. The copyright holder for this preprint
(which was not peer-reviewed) is the author/funder, who has granted bioRxiv a license to display the preprint in perpetuity.
It is made available under a CC-BY-NC-ND 4.0 International license.
of labeling the mesh size in the polymer might be unveiled. These conclusions
call for in situ expansion nanorulers for taking expansion microscopy to a
quantitative level.
Acknowledgements
M.B.S. and P.T. thank E. Boyden (Massachusetts Institute of Technology), K.
Weisshart (Carl Zeiss Microscopy GmbH), J.J. Schmied and C. Forthmann
(both GATTAquant GmbH) for helpful discussions and T. Dammeyer (TU
Braunschweig) for providing the scaffold DNA. Further, we acknowledge the
support of the Technische Universitaet Braunschweig, the Institut fuer
Theoretische und Physikalische Chemie, the Braunschweig Integrated Center
for Systems Biology (BRICS), and the Laboratory for Emerging
Nanometrology (LENA). The work was also supported by GATTAquant
GmbH. P.T. gratefully acknowledges support by the DFG (INST 188/401–1
FUGG and excellence clusters Nanosystems Initiative Munich (NIM) and
CIPSM (Center for Integrated Protein Science Munich)). This project was also
supported by the European Union’s Horizon 2020 research and innovation
program under grant agreement No 737089 (Chipscope).
Author contributions
M.B.S. planned, conducted and evaluated the experiments; M.B.S. and P.T.
wrote the manuscript.
Additional Information
Supplementary Information is available.
Competing Interests: M.B.S. and P.T. are shareholders of GATTAquant
GmbH.
References
1 Hell, S. W. in Science Vol. 316 1153 (2007).
2 Huang, B., Bates, M. & Zhuang, X. in Annual review of biochemistry Vol.
78 993 (2009).
3 Xu, K., Zhong, G. & Zhuang, X. in Science Vol. 339 452-456 (2013).
4 Beliveau, B. J. et al. in Nature Communications Vol. 6 7147 (2015).
5 Betzig, E. in Opt Lett Vol. 20 237-239 (1995).
6 Sidenstein, S. C. et al. in Sci Rep Vol. 6 26725 (2016).
7 Rust, M. J., Bates, M. & Zhuang, X. in Nat Meth Vol. 3 793-795 (2006).
8 Heilemann, M. et al. in Angew Chem Int Ed Engl Vol. 47 6172-6176
(2008).bioRxiv preprint first posted online Feb. 14, 2018; doi: http://dx.doi.org/10.1101/265405. The copyright holder for this preprint
(which was not peer-reviewed) is the author/funder, who has granted bioRxiv a license to display the preprint in perpetuity.
It is made available under a CC-BY-NC-ND 4.0 International license.
9 Hell, S. W. & Wichmann, J. in Opt Lett Vol. 19 780-782 (1994).
10 Gustafsson, M. G. L. in Journal of Microscopy Vol. 198 82-87 (2000).
11 Abbe, E. in Archiv für mikroskopische Anatomie (1873).
12 Hofmann, M., Eggeling, C., Jakobs, S. & Hell, S. W. in Proc Natl Acad Sci
USA Vol. 102 17565-17569 (2005).
13 Jungmann, R. et al. in Nano Lett Vol. 10 4756-4761 (2010).
14 Chen, F., Tillberg, P. W. & Boyden, E. S. in Science Vol. 347 543-548
(2015).
15 Chozinski, T. J. et al. in Nat Meth (2016).
16 Chen, F. et al. in Nat Meth Vol. 13 679-684 (2016).
17 Truckenbrodt, S. et al. in biorxiv.org (2017).
18 Chang, J.-B. et al. in Nat Meth 1-11 (2017).
19 Halpern, A. R., Alas, G. C. M., Chozinski, T. J., Paredez, A. R. &
Vaughan, J. C. in ACS nano acsnano.7b07200 (2017).
20 Jones, M. R., Seeman, N. C. & Mirkin, C. A. in Science Vol. 347
1260901 (2015).
21 Rothemund, P. W. K. in Nature Vol. 440 297-302 (2006).
22 Douglas, S. M. et al. in Nature Vol. 459 414-418 (2009).
23 Ke, Y. et al. in J Am Chem Soc Vol. 131 15903-15908 (2009).
24 Ke, Y., Lindsay, S., Chang, Y., Liu, Y. & Yan, H. in Science Vol. 319 180-
183 (2008).
25 Douglas, S. M., Bachelet, I. & Church, G. M. in Science Vol. 335 831-
834 (2012).
26 Langecker, M. et al. in Science Vol. 338 932-936 (2012).
27 Acuna, G. P. et al. in Science Vol. 338 506-510 (2012).
28 Steinhauer, C., Jungmann, R., Sobey, T. L., Simmel, F. C. & Tinnefeld, P.
in Angew Chem Int Ed Engl Vol. 48 8870-8873 (2009).
29 Schmied, J. J. et al. in Nat Meth Vol. 9 1133-1134 (2012).
30 Schmied, J. J. et al. in Nat Protoc Vol. 9 1367-1391 (2014).
31 Raab, M. et al. in Sci Rep Vol. 8 8206 (2018).
32 Schmied, J. in Optik & Photonik (2016).You can also read