Evaluating Similarity Measures: A Large-Scale Study in the Orkut Social Network
←
→
Page content transcription
If your browser does not render page correctly, please read the page content below
Evaluating Similarity Measures:
             A Large-Scale Study in the Orkut Social Network

                               Ellen Spertus                                 Mehran Sahami, Orkut Buyukkokten
                               Mills College                                                   Google
                           5000 MacArthur Blvd.                                       1600 Amphitheatre Parkway
                            Oakland, CA 94613                                          Mountain View, CA 94043
                           spertus@mills.edu                                      {sahami,     orkut}@google.com

ABSTRACT                                                                    affiliated with Google. The original mechanisms for users
Online information services have grown too large for users                  to find communities were labor-intensive, including search-
to navigate without the help of automated tools such as col-                ing for keywords in community titles and descriptions or
laborative filtering, which makes recommendations to users                  browsing other users’ memberships. Four months after its
based on their collective past behavior. While many similar-                January 2004 debut, Orkut had over 50,000 communities,
ity measures have been proposed and individually evaluated,                 providing the necessity and opportunity for data-mining for
they have not been evaluated relative to each other in a large              automated recommendations. There are now (May 2005)
real-world environment. We present an extensive empirical                   over 1,500,000 communities.
comparison of six distinct measures of similarity for recom-                   While there are many forms of recommender systems [3],
mending online communities to members of the Orkut social                   we chose a collaborative filtering approach [13] based on
network. We determine the usefulness of the different rec-                  overlapping membership of pairs of communities. We did
ommendations by actually measuring users’ propensity to                     not make use of semantic information, such as the descrip-
visit and join recommended communities. We also exam-                       tion of or messages in a community (although this may be an
ine how the ordering of recommendations influenced user                     area of future work). Our recommendations were on a per-
selection, as well as interesting social issues that arise in               community, rather than a per-user basis; that is, all mem-
recommending communities within a real social network.                      bers of a given community would see the same recommen-
                                                                            dations when visiting that community’s page. We chose this
                                                                            approach out of the belief, which was confirmed, that com-
Categories and Subject Descriptors                                          munity memberships were rich enough to make very useful
H.2.8 [Database Management]: Database Applications—                         recommendations without having to perform more compu-
data mining; H.3.5 [Information Storage and Retrieval]:                     tationally intensive operations, such as clustering of users or
Online Information Services; I.5 [Computing Methodolo-                      communities or computing nearest neighbor relations among
gies]: Pattern Recognition                                                  users. Indeed, Sarwar et al. have found such item-based al-
                                                                            gorithms to be both more efficient and successful than user-
General Terms                                                               based algorithms [13]. By measuring user acceptance of rec-
                                                                            ommendations, we were able to evaluate the absolute and
Algorithms, measurement, human factors                                      relative utility of six different similarity measures on a large
                                                                            volume of data.
Keywords
Data mining, collaborative filtering, recommender system,                   2.   MEASURES OF SIMILARITY
similarity measure, online communities, social networks
                                                                              The input data came from the membership relation M =
                                                                            {(u, c) | u ∈ U, c ∈ C} , where C is the set of communities
1. INTRODUCTION                                                             with at least 20 members and U the set of users belong-
   The amount of information available online grows far faster              ing to at least one such community. When we began our
than an individual’s ability to assimilate it. For example,                 experiment in May 2004, |C| = 19, 792, |U| = 181, 160, and
consider “communities” (user-created discussion groups) with-               |M| = 2, 144, 435. Table 1 summarizes the distribution.
in Orkut, a social-networking website (http://www.orkut.com)                  All of our measures of community similarity involve the
                                                                            overlap between two communities, i.e., the number of com-

                                                                             Table 1: Distribution of community memberships

                                                                                                           min    max     median       σ
Copyright 2005ACM. This is the author’s version of the work. It is posted    Users per community           20     9077      50       230.5
here by permission of ACM for your personal use. Not for redistribution.     Communities per user           1     4173      6        28.0
The definitive version was published in KDD ’05, August 21-24, 2005
http://doi.acm.org/10.1145/1081870.1081956
mon users. If a base community b and a (potentially) related 2.1.3 Pointwise Mutual-Information: positive corre-
community r are considered as sets of users, the overlap is lations (MI1)
|B ∩ R|, where we use capital letters to represent the set con- Information theory motivates other measures of correla-
taining a community’s members. Note that overlap cannot tion, such as “mutual information” [2]. We chose pointwise
be the sole factor in relatedness, as the size of communities mutual information where we only count “positive” corre-
varies greatly. If we only considered overlap, practically ev- lations (membership in both B and R). Such a formulation
ery community would be considered related to the “Linux” essentially focuses on how membership in one group is pre-
community, which was the most popular, with 9,077 mem- dictive of membership in another (without considering how
bers. The similarity measures in the next section normalize base non-membership in a group effects membership in an-
the overlap in different ways. other group), yielding:
2.1 Similarity Measure Functions
P(r, b)
Each similarity measure we consider is presented as a (pos- M I1(b, r) = P(r, b) · lg
sibly asymmetric) function of b and r indicating how appro- P(r) · P(b)
priate the related community r is as a recommendation for
2.1.4 Pointwise Mutual-Information: positive and
the base community b. We do not use the result of the
negative correlations (MI2)
function as an absolute measure of similarity, only to rank
recommendations for a given base community. Similarly, we can compute the pointwise mutual infor-
mation with both positive and negative correlations (e.g.,
2.1.1 L1-Norm membership in both B and R, or non-membership in both
If we − consider the base and related communities to be groups). Again, we don’t compute the full expected mutual
→
vectors b and − →
r , where the ith element of a vector is 1 if information, since we believe cross-correlations (e.g., how
user i is a member and 0 if not, we can measure the overlap membership in B affects non-membership in R) tend to be
as the product of their L1-norms: distortive with the recommendation task since such cross-
correlations are plentiful but not very informative. This
− −
→ yields:
→ −
− b ·→
r
L1( b , →
r)= →
−
k b k ·k−
1
→
r k 1 P(r, b) P(r̄, b̄)
This quantity can also be expressed in set notation, where M I2(b, r) = P(r, b) · lg + P(r̄, b̄) · lg
P(r) · P(b) P(r̄) · P(b̄)
we use a capital letter to represent the set containing a com-
munity’s members: 2.1.5 Salton (IDF)
Salton proposed a measure of similarity based on inverse
|B ∩ R| document frequency scaling (tf-idf) [12]:
L1(B, R) =
|B| · |R|
Note that this evaluates to the overlap between the two IDF (b, r) = P (r|b) · (− lg P(r))
groups divided by the product of their sizes. When the
base community is held constant (as when we determine the |B ∩ R| |R|
base community’s recommendations), this evaluates to the IDF (B, R) = · (− lg )
|B| |U|
overlap divided by the size of the related community, fa-
voring small communities. Kitts et al. [9] reported this to 2.1.6 Log-Odds
be a successful measure of similarity in their recommender We first considered the standard log-odds function, which
system. measures the relative likelihood that presence or absence in
2.1.2 L2-Norm a base community predicts membership in a related commu-
nity:
Similarly, we can measure the overlap with the product of
→
−
the L2-norms (“cosine distance” [3, 6, 12]) of b and →
−
r: LogOdds0(b, r) = lg
P(r|b)
P(r|b̄)
→ −
−
→ →
− b ·→r Empirically, we found this generated the exact same rank-
L2( b , −
r)= −
→ ings as using the L1-Norm, which makes sense because:
k b k2 · k −
→
r k2
In set notation: 1. Logarithm is monotonic and, while affecting scores,
does not affect rankings.
|B ∩ R|
L2(B, R) = p 2. Constant factors, such as |B|, do not affect rankings.
|B| · |R|
Note that the square-root in the denominator causes L2 to 3. For |B|
|U |, P(r|b̄) ≈ P(r)
penalize large communities less severely than L1. We formulated a different log-odds metric, which measures
Observe that the L2-norm presented here is equivalent to whether membership in the base community is likelier to
the widely used cosine coefficient applied to binary data. predict membership or absence in the related community:
Moreover, while Pearson correlation has been used previ-
ously in recommender systems where ranking data is avail-
able, we did not use this measure here since it is generally P(r|b)
LogOdds(b, r) = lg
considered inappropriate for binary data. P(r̄|b)top scores, leading to MI1 and IDF often giving the same
Table 2: Average size of top-ranked community for ranking to top-scoring communities. (Note that this pertur-
each measure bation quantity is given only to explain the high correlation
measure Average size between MI1 and IDF. Statistically, it is meaningless, since
rank 1 rank 2 rank 3 b and b̄ cannot simultaneously hold.)
L1 332 482 571
L2 460 618 694
MI1 903 931 998
3. EXPERIMENT DESIGN
MI2 966 1003 1077 We designed an experiment to determine the relative value
IDF 923 985 1074 of the recommendations produced by each similarity mea-
LogOdds 357 513 598 sure. This involved interleaving different pairs of recommen-
dations and tracking user clicks. Specifically, we measured
the efficacy of different similarity measures using pair-wise
binomial sign tests on click-through data rather than us-
Table 3: Agreement in top-ranked results between ing traditional supervised learning measures such as preci-
measures. For example, MI1 and IDF rank the same sion/recall or accuracy since there is no “true” labeled data
related community first for 98% of base communi- for this task (i.e., we do not know what are the correct com-
ties. Correlations greater than 85% are in bold. munities that should be recommended to a user). Rather,
L1 we focused on the task of determining which of the similar-
.70 L2 ity measures performs best on a relative performance scale
.41 .60 MI1 with regard to acceptance by users.
.39 .57 .96 MI2
.41 .59 .98 .97 IDF 3.1 Combination
.88 .79 .46 .44 .46 LogOdds When a user viewed a community page, we hashed the
combined user and community identifiers to one of 30 val-
ues, specifying an ordered pair of similarity measures to
compare. Let S and T be the ordered lists of recommenda-
2.2 Discussion tions for the two measures, where S = (s1 , s2 , . . . , s|S| ) and
For a given measure, we refer to the related community T = (t1 , t2 , . . . , t|T | ) and |S| = |T |. The recommendations of
yielding the highest value to be the top-ranked related com- each measure are combined by Joachims’ “Combined Rank-
munity relative to a base community. The average size ing” algorithm [7], restated in Figure 1. The resulting list is
of top-ranked communities for each measure, which varies guaranteed to contain the top kS and kT recommendations
greatly, is shown in Table 2. Table 3 shows how often two for each measure, where kT ≤ kS ≤ kT + 1 [7, Theorem 1].
functions yield the same top-ranking result. Table 4 shows
the top recommendations for the “I love wine” community. 3.2 Measurements
Note that MI1, MI2, and IDF favor very large communities, Whenever a user visited a community, two measures were
while L1 and LogOdds favor small communities. chosen and their recommendations interleaved, as discussed
Note that in addition to the obvious correlations between above. This was done in a deterministic manner so that
the two mutual-information functions (96%), there is a very a given user always saw the same recommendations for a
strong correlation between IDF and the mutual-information given community. To minimize feedback effects, we did not
functions (97-98%). Manipulation of the formulas for MI1 regenerate recommendations after the experiment began.
and IDF shows: A user who views a base community (e.g., “I love wine”) is
P(r, b) either a member (denoted by “M”) or non-member (denoted
M I1(b, r) = P(r, b) · lg by “n”). (We capitalize “M” but not “n” to make them eas-
P(r) · P(b)
ier to visually distinguish.) In either case, recommendations
= P(r|b)·P(b) · lg P(r|b) − P(r|b)·P(b) · lg P(r)
are shown. When a user clicks on a recommendation, there
= P(r|b)·P(b) · lg P(r|b) are three possibilities: (1) the user is already a member of
−P(r|b) · [1 − P(b̄)] · lg P(r) the recommended community (“M”), (2) the user joins the
= P(r|b)·[P(b) · lg P(r|b) + P(r|b)·P(b̄) · lg P(r)] recommended community (“j”), or (3) the user visits but
does not join the recommended community (“n”). The com-
−P(r|b) · lg P(r) bination of base and related community memberships can be
Substituting IDF (b, r) = −P (r|b) · lg P(r), we get: combined in six different ways. For example “M→j” denotes
a click where a member of the base community clicks on a
M I1(b, r) = P(r|b) · P(b) · lg P(r|b) + P(b̄) · lg P(r) recommendation to another community to which she does
+IDF (b, r) not belong and joins that community. Traditionally, anal-
yses of recommender systems focus on “M→j”, also known
Since for virtually all communities b, P (b)
P (b̄), we can informally as “if you like this, you’ll like that” or formally
approximate: as “similarity” or “conversion”. “M→n” recommendations
M I1(b, r) ≈ IDF (b, r) + P(r|b) · P(b̄) · lg P(r) are considered distracters, having negative utility, since they
waste a user’s time with an item not of interest. Before run-
Thus, MI1 yields a ranking that can be thought of as start- ning the experiment, we decided that the measures should
ing with the ranking of IDF and perturbing the score of each be judged on their “M→j” performance.
element in the ranking by P(r|b) · P(b̄) · lg P(r), which gener- Other interpretations are possible: “M→n” links could be
ally is not great enough to change the relative ranking of the considered to have positive utility for any of the followingTable 4: Top recommendations for each measure for the “I love wine” community, with each recommended
community’s overlap with the base community and size. The size of “I love wine” is 2400.
L1 L2 MI1 MI2 IDF LogOdds
1 Ice Wine Red Wine Japanese Japanese Japanese Japanese
(Eiswein) (208/690) Food/Sushi Food/Sushi Food/Sushi Food/Sushi
(33/51) Lovers Lovers Lovers Lovers
(370/3206) (370/3206) (370/3206) (370/3206)
2 California Cheeses of the Red Wine Red Wine Photography Photography
Pinot Noir World (208/690) (208/690) (319/4679) (319/4679)
(26/41) (200/675)
3 Winery I love red Cheeses of the Cheeses of the Red Wine Linux
Visitor - wine! World World (208/690) (299/9077)
Worldwide (170/510) (200/675) (200/675)
(44/74)
Figure 1: Joachims’ “Combine Rankings” algorithm [7]
Input: ordered recommendation lists S = (s1 , s2 , . . . , s|S| ) and T = (t1 , t2 , . . . , t|T | ) where |S| = |T |
Call: combine (S, T, 0, 0, ∅)
Output: combined ordered recommendation list D
combine(S, T, ks , kt , D){
if (ks < |S| ∧ kt < |T |)
if (ks = kt ) {
if (S[ks + 1] ∈/ D){D := D + S[ks + 1]; }
combine(S, T, ks + 1, kt , D);
} else {
if (T [kt + 1] ∈
/ D){D := D + T [kt + 1]; }
combine(S, T, ks , kt + 1, D);
}
}
}
Table 5: Clicks on recommendations, by membership status in the base and recommended communities, as
counts and as percentages of total clicks. The last column shows the conversion rate, defined as the percentage
j
of non-members clicking on a related community who then joined it ( n+j ).
membership in base community membership in recommended community
M (member) n (non-member) j (join) total conversion rate
M (member): number of clicks 36353 184214 212982 433549 54%
percent of total clicks 4% 20% 24% 48%
n (non-member): number of clicks 8771 381241 77905 467917 17%
percent of total clicks 1% 42% 9% 52%
total: number of clicks 45124 565455 290887 901466 34%
percent of total clicks 5% 63% 32% 100%reasons: by measure L2 than measure L1, for example, we consid-
ered it a “win” for L2 and a loss for L1. If both measures
1. As the user found the link sufficiently interesting to ranked it equally, the result was considered to be a tie. Ta-
click on, it was of more utility than a link not eliciting ble 6 shows the outcomes of all clicks, with conversions by
a click. members (“M→j”) and non-members of the base community
(“n→j”) broken out separately.
2. The user is genuinely interested in the related com- We say that a measure dominates another if, in their pair-
munity but does not want to proclaim her interest, as wise comparison, the former has more “wins”. For example,
membership information is public and some communi- L2 dominates L1. This definition, combined with the data
ties focus on taboo or embarrassing topics. For exam- in Table 6, yielded a total order (to our surprise) among
ple, a recommendation given for the popular “Choco- the measures: L2, MI1, MI2, IDF, L1, LogOdds. The same
late” community is “PMS”. Note that this effect is spe- total order occurred if only “n→j” clicks were considered.
cific to social networks and not, for example, Usenet The order was different if all clicks were considered: L2, L1,
groups, where the user’s list of communities is not re- MI1, MI2, IDF, LogOdds.
vealed to other users.
4.2 Conversion rates
Similarly, it is unclear how to value clicks from a base com- There was great variance in conversion rate by recom-
munity that the user does not belong to. Does an “n→j” mended community. We examined the 93 recommended
click indicate failure, since the base community was not communities that were clicked through to more than 1000
joined by the user, but the recommended community was, times. Unsurprisingly, the ten with the lowest conversion
indicating a degree of dissimilarity? Or is it of positive rate all were about sex (e.g., Amateur Porn). Note that
utility, since it helped a user find a community of interest? members of the base community were far more willing than
For these reasons, we tracked all clicks, recording the user’s non-members to join, perhaps because they had already
membership status in the base and recommended commu- shown their willingness to join a sex-related community. At
nities for later analysis. (We did not track whether users the other extreme, none of the ten with the highest con-
returned to communities in the future because of the log- version rate were sexual (e.g., Flamenco). Table 7 provides
ging overhead that would be required.) selected data by each membership combination. Unsurpris-
ingly, for all 93 base communities, members were more likely
3.3 User Interface than non-members to join the recommended community.
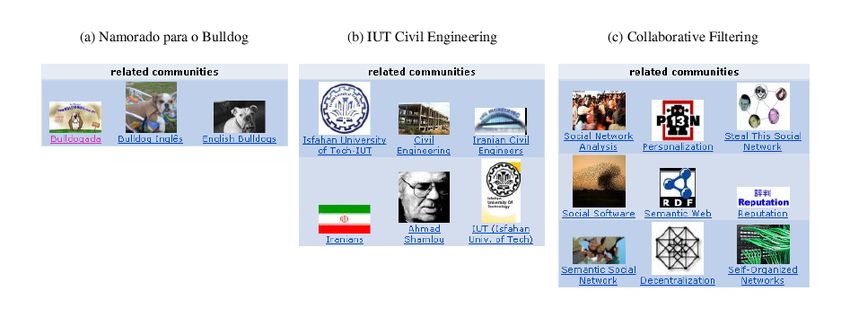
On community pages, our recommendations were pro-
vided in a table, each cell of which contained a recommended 4.3 User comments
community’s name, optional picture, and link (Figure 2). Users were also able to submit feedback on related com-
Recommendations were shown by decreasing rank from left munities. Most of the feedback was from users who wanted
to right, top to bottom, in up to 4 rows of 3. For aesthetic recommendations added or removed. Some complained a-
reasons, we only showed entire rows; thus, no recommen- bout inappropriate recommendations of sexual or political
dations were displayed if there were fewer than 3. We also communities, especially if they found the displayed image
provided a control that allowed users to send us comments offensive. A few objected to our generating related commu-
on the recommendations. nity recommendations at all, instead of allowing community
creators to specify them. In one case, poor recommenda-
4. RESULTS tions destroyed a community: The creator of a feminist sex-
uality community disbanded it both because of the prurient
We analyzed all accesses between July 1, 2004, to July 18,
recommendations that appeared on her page and the disrup-
2004, of users who joined Orkut during that period. The sys-
tive new members who joined as a result of recommendations
tem served 4,106,050 community pages with recommenda-
from such communities. We agreed with her that the recom-
tions, which provides a lower bound on the number of views.
mendations were problematic and offered to remove them.
(Unfortunately, we could not determine the total number of
While anecdotal, this example illustrates how a recommen-
views due to browser caching.) There were 901,466 clicks on
dation can have unanticipated consequences that cannot be
recommendations, 48% by members of the base community,
captured in simple statistical measures. (An informal dis-
52% by non-members (Table 5). Clicks to related communi-
cussion of users’ behavior when we allowed them to choose
ties to which the user already belonged were rare, accounting
related communities can be found elsewhere [14].)
for only 5% of clicks. The most common case was for a non-
member of a base community to click through and not join
a related community (42%). 5. POSITIONAL EFFECTS
We defined conversion rate (also called precision) as the During the above experiment, we became curious how the
percentage of non-members who clicked through to a com- relative placement of recommendations affected users’ selec-
munity who then joined it. The conversion rate was three tions and performed a second experiment.
times as high (54%) when the member belonged to the base
community (from which the recommendation came) than 5.1 Design
not (17%). After determining that L2 was the best measure of simi-
larity, we recomputed the recommendations and studied the
4.1 Relative performance of different measures effect of position on click-through. While in our original
We compared each measure pairwise against every other experiment we displayed up to 12 recommendations in de-
measure by analyzing clicks of their merged recommenda- creasing rank, for this experiment we displayed up to 9 rec-
tions. If the click was on a recommendation ranked higher ommendations in random order, again ensuring that eachTable 6: The relative performance of each measure in pairwise combination on clicks leading to joins, divided
by base community membership status, and on all clicks. Except where numbers appear in italics, the
superioriority of one measure over another was statistically significant (p < .01) using a binomial sign test
[10].
measures M→j n→j all clicks
win equal loss win equal loss win equal loss
L2 MI1 6899 2977 4993 2600 1073 1853 30664 12277 20332
L2 MI2 6940 2743 5008 2636 1078 1872 31134 11260 19832
L2 IDF 6929 2697 5064 2610 1064 1865 30710 11271 20107
L2 L1 7039 2539 4834 2547 941 1983 28506 13081 23998
L2 LogOdds 8186 1638 4442 2852 564 1655 34954 6664 18631
MI1 MI2 3339 9372 1855 1223 3401 683 14812 37632 7529
MI1 IDF 3431 8854 1891 1139 3288 629 14671 37049 7758
MI1 LogOdds 7099 3546 3341 2514 1213 1193 29837 13869 13921
MI1 L1 6915 1005 6059 2547 407 2338 27786 4308 29418
MI2 IDF 1564 11575 1031 533 4266 359 6003 47885 4490
MI2 LogOdds 6920 3959 3177 2484 1418 598 2881 15308 13188
MI2 L1 6830 950 6419 2383 362 2333 26865 3872 29864
IDF L1 6799 1006 6304 2467 392 2352 27042 4069 29755
IDF LogOdds 6691 3804 3096 2452 1378 1085 28224 15013 13330
L1 LogOdds 6730 518 5975 2521 108 2059 31903 2097 24431
Table 7: Conversion rates by status of membership in base community, for communities to which more than
1000 clicks on recommendations occurred.
member of base community non-member of base community
Related community M→M M→j M→j conversion rate n→M n→n n→M conversion rate
10 communities with highest
conversion rates 583 2273 6984 75% 198 3454 2017 37%
10 communities with lowest
conversion rates 326 1984 826 29% 68 26287 472 1.8%
all 93 communities 13524 54415 52614 46% 3488 127819 19007 17%
user always saw the same ordering of recommendations for formation, which we found more intuitive. For future work,
a given community. By randomizing the position of recom- we would like to see how recommendations handpicked by
mendations, we sought to measure ordering primacy effects community owners compare.
in the recommendations as opposed to their ranked quality. Just as we can estimate communities’ similarity through
common users, we can estimate users’ similarity through
5.2 Results common community memberships: i.e., user A might be
We measured all 1,279,226 clicks on related community similar to user B because they belong to n of the same com-
recommendations from September 22, 2004, through Oc- munities. It will be interesting to see whether L2 also proves
tober 21, 2004. Table 8 shows the relative likelihood of superior in such a domain. We could also take advantage
clicks on each position. When there was only a single row, of Orkut’s being a social network [8], i.e., containing in-
the middle recommendation was clicked most, followed by formation on social connections between pairs of users. In
the leftmost, then rightmost recommendations, although the addition to considering common community memberships,
differences were not statistically significant. When there we could consider distance between users in the “friendship
were two or three rows, the differences were very significant graph”. Users close to each other (e.g., friends or friends-
(p < .001), with preferences for higher rows. P-values were of-friends) might be judged more likely to be similar than
computed using a Chi-Squared test comparing the observed distant strangers, although some users might prefer the lat-
click-through rates with a uniform distribution over all po- ter type of link, since it would introduce them to someone
sitions [10]. they would be unlikely to meet otherwise, perhaps from a
different country or culture.
Similarly, friendship graph information can be taken into
6. CONCLUSION AND FUTURE PLANS account when making community recommendations, which
Orkut’s large number of community memberships and us- would require that recommendations be computed on a per-
ers allowed us to evaluate the relative performance of six user (or per-clique), rather than per-community, basis. In
different measures of similarity in a large-scale real-world such a setting, we could make community recommendations
study. We are not aware of any comparable published large- based on weighted community overlap vectors where weights
scale experiments. We were surprised that a total order are determined based on the graph distances of other com-
emerged among the similarity measures and that L2 vec- munity members to a given user. This is a fertile area for
tor normalization showed the best empirical results despite future work and yet another example of how the interaction
other measures, such as log-odds and pointwise mutual in-Figure 2: Displays of recommendations for three different communities
Table 8: The relative likelihood of clicks on link by position when there are (a) one, (b) two, or (c) three
rows of three recommendations.
(a) n=28108, p=.12 (b) n=24459, pYou can also read