UNSECURED SUBORDINATED CALLABLE NOTE PROGRAMME - 22 June 2021 - Sanlam
←
→
Page content transcription
If your browser does not render page correctly, please read the page content below

UNSECURED
SUBORDINATED
CALLABLE NOTE
PROGRAMME

22 June 2021

Agenda

01   COVID-19 operating environment

02   Strategy review

03   Financial results

04   Capital management

05   Outlook for 2021

06   Debt programme

COVID-19 operating context

Operating context for 2020 and 2021

                                        COVID-19 significantly impacted society              Sanlam responded with care
                                            Millions of people infected and thousands           Staff protected and continue to operate
 Resilience of Sanlam                       of lives lost                                       remotely as far as possible
                                            Significant increase in mortality experience        Roll-out of digital tools to clients and
                                            in South Africa relative to 2020                    intermediaries accelerated
              Support to clients
                                            Lockdowns and curfews impact economic               Continued support to society through the
                                            activity across Africa and India                    Sanlam Foundation
                                            Clients uncertain about their financial
                   Support to society       futures

                                        Led by our purpose                                   We remained resilient
                    Shift to digital        Empowering generations to be financially            Solvency levels strong and well within
                                            confident, secure and prosperous                    target ranges, no additional reserving
                                            Santam setting aside R3 billion for CBI             required for mortality claims
                                            claims                                              Cash generation in the life insurance
              Recessions                    R2.25 billion invested for businesses               operations remain robust
                                            requiring capital support                           Persistency levels steady
 Job losses                                 Sanlam paid mortality claims totaling R4.8          No additional CBI provisions in 2021 at
                                            billion (net of reinsurance) in the first four      Santam
                                            months of 2021 (4m FY20: R2,1 billion)

                                                                                                                                           4
Sanlam Life and Savings mortality claims 2020
                2020 gross monthly claims (R million)                                 2020 and 2021 gross monthly claims (R million)
                                                                                                                                                         SALIENT FEATURES
    600                                                                      800                                                                          Retail Affluent less
                                                                                                                     674
    500                                                                      700                                                                          impacted in first wave in
                                                                             600               561
    400                                                                                                                                                   2020 and had annuity
                                                                             500                                                              431         and disability offset
    300                                                                      400
                                                                                                               290
    200                                                                      300                                                       229                Retail Mass hardest hit in
                                                                                         167                                                              the first wave in 2020 –
                                                                             200
    100
                                                                             100                                                                          especially foundation
      0                                                                        0
          Jan Feb Mar Apr May Jun Jul Aug Sep Oct Nov Dec                                                                                                 market in group schemes
                                                                                      Retail Affluent        Retail Mass               Corporate
                                                                                                                                                          Peak of second wave in
            Retail Affluent             Retail Mass             Corporate                         Jan-20             Jan-21                               first quarter of 2021 –
                                                                                                                                                          significant increase in
                                                                                                                                                          claims
               2020 excess claims per cluster (R million) *                           Breakdown of excess claims (R million)
                                                                                                                                                          Retail Affluent more
                                                                            800                                                         721
    500                                                                                                                                                   affected than other
                                                                            600                                                                           segments in second wave
                                                                 383                                                                          383 354
    400
                                                                            400                      284 284         289
                                 284
    300                                                                     200    148
                                                                                          30                                 69
    200                                                                       0

    100                                          69                         -200      (118)
                30                                                                                                    (220)
                                                                            -400                                                          (338)
      0                                                                            Retail Affluent   Retail Mass     Corporate          Sanlam Life
          Retail Affluent     Retail Mass    Corporate      Sanlam Life                                                                 and Savings
                                                            and Savings        Excess mortality                            Annuity & disability offset
                                                                               Excess claims                               Pandemic reserve release
* net of tax and reinsurance, including annuity and disability offsets
                                                                                                                                                                                       5
Sanlam Life and Savings mortality claims for the first four
months of 2021
                                                                                                    SALIENT FEATURES

       Impact of higher mortality claims on SLS (net of tax and reinsurance)                         Second wave of COVID-
                                                                                                     19 in South Africa more
                                                                                                     severe than the first wave
                                                      Excess      Annuity & disability   Excess
       R million                                     mortality*               offsets     claims     Mortality claims for the
                                                                                                     first four months of 2021
       SLS                                                1 015                  (122)      893      R2,7 billion (gross of tax
       Retail Affluent                                      383                   (73)      310      and net of reinsurance)
                                                                                                     higher than the
       Retail Mass                                          114                      -      114      corresponding period in
       Corporate                                            518                   (49)      469      2020

       Release of discretionary reserves                                                   (893)     R1,2 billion claims above
                                                                                                     the long-term expected
       Net impact                                                                               -    level (after positive
                                                                                                     annuity and disability
      * Mortality above long-term actuarial assumptions                                              offsets which were lower
                                                                                                     than the offsets
                                                                                                     experienced in the first
 We expect to be able to absorb an increase in claims in the remainder of 2021 from further          wave in 2020)
 discretionary margins and other reserve releases together with repricing group risk business
                                                                                                     Fully offset by reserve
                                                                                                     release
                                                                                                                                  6
Strategy review
Strategy at a glance

 Our vision                                                                                                    HOW WE ARE
                                                                                                               EMBEDDING STRATEGY
 To become the most admired financial services               Executed through our clusters                     IN OUR BUSINESS
 group in Africa
                                                                                                                Integration – expand
                                                                                                                product offering and
 Our Strategy                                                                                                   improve cross-sell
                                                                                             Retail Affluent
                                                                                                                Digitalisation – improve
         Becoming an African champion                          SA Life                                          client and intermediary
                                                                                             Retail Mass        experience and efficiency
                                                              & Savings
              Building a fortress position in South Africa                                                      Empowerment –
                                                                                             Corporate          contribute to inclusive
                                                                                                                economic participation
              Accelerating growth outside of South Africa                                                       and support Fortress SA
                                                                              Emerging                          strategy
         Strengthening our position where we operate                           markets
         outside of Africa                                                                                      Culture survey –
                                                                                                                readying our people and
 Enabled by                                                                                                     culture to operate in a
                                                              Investment                                        different way ensures we
                                                                                               Santam
 •   Data and digital transformation                            Group                                           remain a future-fit
                                                                                                                organisation
 •   Continuous development of our culture
                                                                                                                Partnerships – exploit
 •   Innovation                                                                                                 growth opportunities and
 •   Partnerships                                                                                               gain access to
                                                                                Group                           underpenetrated market
                                                                                office                          segments across the
                                                                                                                continent and where we
                                                                                                                operate outside Africa   8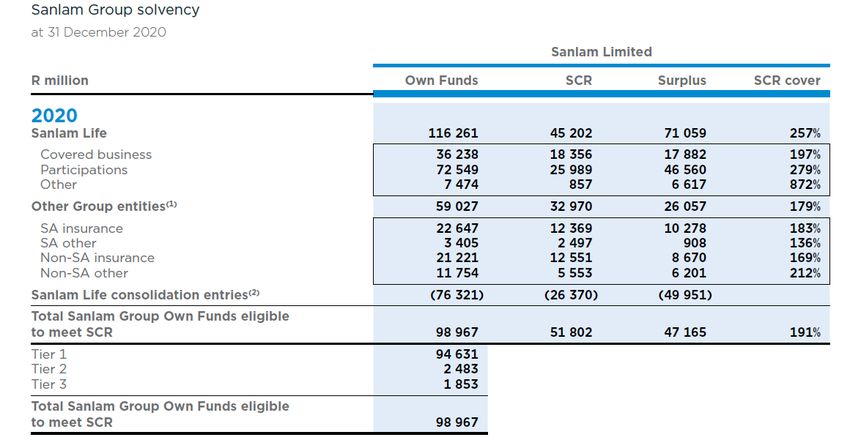
Becoming an African champion

                                                                                               OPTIMISE THE
                                                                                               PORTFOLIO
 Strong new business volume growth of +27% in Africa ex-South Africa (off a high base) for
                                                                                                Strategic review of
 the first four months of 2021                                                                  operations – continue
                                                                                                focus on optimising the
 Sanlam Pan-Africa general insurance (SPA GI) underwriting margin of 6.9% (4m20: 6.6%)          portfolio
 and net investment return on insurance funds 6.8% (4m20: -14.1%) for the first four
 months of 2021                                                                                 Pan-Africa portfolio –
                                                                                                sale of Saham Kenya,
 Adoption of new mandate for Morocco general insurance funds (float) by shifting to the         Sunu Group (West Africa)
                                                                                                and Netis
 following asset mix:
                                                                                                Morocco investment
 • Equity to a range of 25% to 35%                                                              portfolio – revised
                                                                                                investment strategy
 • Property to a range of 15% to 25%
                                                                                                supports achieving hurdle
 • Bonds to a range of 45% to 60%                                                               rate at a lower level of
                                                                                                expected volatility
 Simplification of the Pan-Africa portfolio by the sale of three operations in East and West
 Africa to raise almost US$40m
 FBN Insurance Nigeria transaction fully funded through debt to facilitate introduction of
 new majority partner

                                                                                                                            9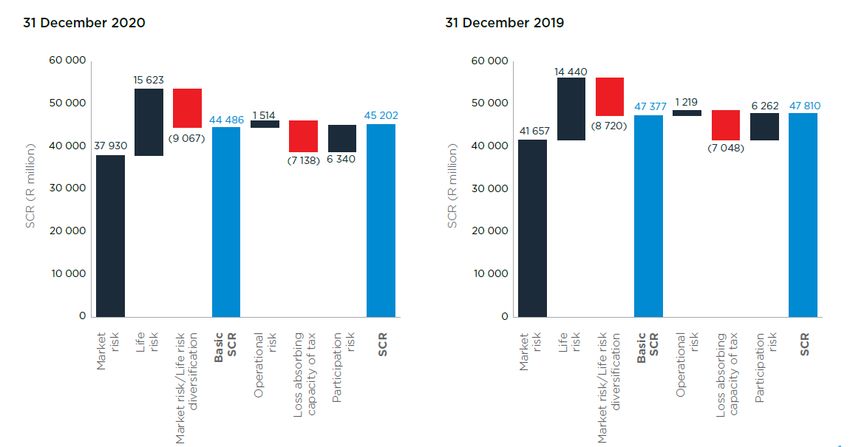
Strengthening the South African competitive position

                                                                                       KEY SEGMENTS FOR
                                                                                       STRENGTHENING
 Concluded African Rainbow Capital Financial Services (ARC FS) acquisition of 25% of
                                                                                        Asset Management
 Sanlam Investments third-party asset manager
                                                                                        Health Insurance

 Acquisition of 25% of ARC FS subsidiary enhances exposure to health insurance and      Employee Benefits
 employee benefit segment income streams for Sanlam                                     Retail Mass segment

 Continued strong performance from Capitec JV

 Proposed acquisition of Alexander Forbes Life group risk and retail life businesses

                                                                                                              10
Partnership with Ubuntu-Botho (UB) and ARC
LONG-TERM
MUTUALLY BENEFICIAL
Sanlam/UB/ARC FS partnership is key to Sanlam’s strategy of building a fortress position PARTNERSHIP
in South Africa 17-year partnership with
significant value added
Institutional segments of the South African market are particularly sensitive to the
UB retained its Sanlam
empowerment credentials of market participants, both at group and entity level shareholding and in 2014
parties agreed:
ARC FS acquired 25% of Sanlam’s third-party asset management business and as a
result Sanlam Investments is the largest black-owned asset manager in South Africa • Sanlam to assist UB to
establish a financial
services business in SA
Sanlam Life acquired 25% of ARC FS subsidiary which will enable further strategic
alignment • To jointly explore and
pursue mutually
beneficial transactions
ARC FS portfolio consists of:
Shareholder approved
• Established businesses like Afrocentric and Alexander Forbes with good growth prospects UB funding facility fully
utilised
• Newer generation businesses like Life Cheq, a start-up business aiming to digitalise advice and
financial planning
11Data intelligence, digitalisation, innovation and culture
Leveraging digital and data increases the
Client and intermediary experience
value offered to clients and improves
centre of excellence (CX)
efficiencies
Customer journeys digitalised to simplify
Data driven client insights – give clients more
client experience, including intermediary
reasons to engage with Sanlam
engagement
Sanlam Reality and Wealthbonus
Culture and alternative ways of work
Applying data analytics and robotics Opportunity to instill new culture – group
culture assessment
Targeted management of persistency
resulted in R157 million positive embedded Long-term savings of R150 million annually
value experience variance from rationalising the property portfolio
COVID-19 environment has Sanlam Investments partnering with
accelerated digital adoption by clients Robeco
Indie & MiWay Life combined sales growth of Aim of becoming a leader in ESG investing
62%
12Financial results
Key financial measures for 2020
Unit 2020
COVID-19 impact on investment market returns, increased mortality
Earnings claims, doubtful debt provisions, Santam CBI and relief offered to
clients and intermediaries
Net result from financial services R million 8 382 (13%) 17% growth in net result from financial services excluding sources of
earnings most affected by the COVID-19 pandemic
Net operational earnings R million 8 349 (23%) Excess claims of R383 million (net of tax and reinsurance) in SLS
after allowing for positive annuity and disability experience, R354
New business volumes R million 310 875 25% million (net of tax) release from pandemic reserve
Strong growth in new business despite impact on face-to-face sales,
Value of new business R million 1 921 (16%) supported by investment flows at Glacier, SIG and SEM
Net fund inflows increased by 8% to R62bn, with strong growth in
Net fund inflows R million 61 563 8% SEM
VNB down 16% due to lower sales in higher margin face-to-face
Group Equity Value (GEV) per share cents 5 920 (8%) channels
Adjusted RoGEV impacted by COVID-19 pandemic, especially the
Adjusted Return on GEV % 2.7 operating assumptions changes made to reflect higher persistency
risk, the impairments at Saham and Shriram, as well as the decline in
Dividend per share cents 300 (10%) the Santam share price
14Cluster contributions
Net result from financial services New business volumes VNB
% change
R million 2020 2019 % change (ex-COVID-19) 2020 2019 % change 2020 2019 % change
Sanlam Life and Savings 4 600 4 855 (5%) 5% 77 847 77 051 1% 1 638 1 937 (15%)
Sanlam Emerging Markets 2 377 2 632 (10%) 19% 46 898 34 809 35% 283 343 (17%)
Sanlam Investment Group 805 1 070 (25%) 19% 161 470 113 236 43% - -
Santam 686 1 217 (44%) 79% 24 660 24 227 2%
Group office and other (86) (100) 14% 14%
Sanlam Group 8 382 9 674 (13%) 17% 310 875 249 323 25% 1 921 2 280 (16%)
R million 2H20 1H20 % change
Net result - financial services 4 484 3 898 15%
New business volumes 153 395 157 480 (3%)
VNB 1 255 666 88%
15Key financial measures for the four-month period ending 30 April 2021
Net result from financial services increased by 18% on 2020 but remained 7% lower than 2019
SLS excess claims (claims above the long term expected level) of R1,2 billion net of reinsurance and positive annuity and
disability experience – fully offset by release of discretionary reserves
New Business volumes were 20% higher than 2020 and 58% higher than 2019
VNB up 81% on 2020 and 41% higher than 2019, with margins of 2,82% which were higher than both 2020 and 2019
margins
Net fund inflows were more than double that of 2020 and were 73% higher than 2019
Pan-Africa general insurance portfolio recorded a net insurance margin of 13,7% with both the underwriting margin and
investment return on insurance funds within respective target ranges
16Disciplined allocation of capital
Discretionary capital (R million)
DEPLOYMENT OF
CAPITAL
Reduction from January
2021 is mainly due to
asset management
related transactions in the
UK of some R200 million
and the acquisition of the
remaining 49% interest in
African Rainbow Life,
partially offset by excess
investment return on
required capital in
Sanlam Life
Expected sale of Nucleus
Financial Group plc in
2021 (GBP 75 million)
Substantial funding
sources available
• Disposal of non-core
investments
Available at Transactions Available at
Investment return, capital releases
centre 1-Jan-21 and other centre 30-Mar-21 • Debt exposure low
• IFRS17 reserve releases
• Excess investment return
17Return on group equity value
RoGEV (%) Adjusted RoGEV (%)
SALIENT FEATURES
20 25 Outperformed adjusted
RoGEV targets from 2015
15 20
to 2018,
1.6 underperformance in
6.4 2019 and 2020
3.7
10 15 2.6 2020 actual RoGEV of
14.1 13.2 13.0 13.5 13.3 negative 2.7% is lower
5 10 than adjusted ROGEV of
+2.7% mainly due to:
14.1 13.2 13.0 13.5 13.3
0 5
• Investment market
-2.3 -1.4 underperformance
-7.1 negatively affecting GEV
-5 0 valuations
-1.6
• A lower performance of
-16.0
Santam shares relative to
-10 -5 -10.6 benchmark
• An impairment charge of
-15 -10 R1.7 billion in respect of
B-BBEE SPV funding
-20 -15 • Goodwill write-down on
2016 2017 2018 2019 2020 2016 2017 2018 2019 2020 FBN Life Insurance
Target Out/(under) performance Target Out/(under) performance
18Capital Management
Consistent financial strength and performance
       SAM solvency cover ratio (%)                              Cash generated by life insurance operations (R billion)
                                                                                                                                      KEY CONSIDERATIONS
 270                                                        10                                                                         Capital position remains
 250   257                                                   8                                                                         solid
 230         242                                                    3.8                                                                Cash generation in the
                                                             6                           1.5          2.0       0.3        0.3
 210                                                                                                                                   life insurance operations
                                                             4                                                                         remains robust
 190                    197 195
                                              191                   4.5        4.7       5.2          5.1       5.3         5.0
 170                                                181      2                                                                         Environment remains
 150                                                         0                                                                         challenging
       Sanlam Life   Sanlam Life covered     Sanlam Group          2015      2016      2017           2018     2019        2020
                                                                                                                                       Impact of COVID-19
                                                                                                                                       mortality claims in 2021
       Dec-20          Mar-21              Target range                   Operating earnings            Capital releases
                                                                                                                                       uncertain
                                                                                                                                       Dividend policy
       Sanlam ordinary dividend history (cents per share)             Sanlam real dividend growth (%)                                  unchanged at 2% to 4%
                                                                                                                                       real growth over rolling
 400                      -10%          +13%
                                       CAGR
                                                            6                                                                          three-year period and
                           2020
 350                                since listing           4                                                                          1.0 to 1.2x cash earnings
 300
                                                            2
                                                                                                                                       cover ratio
 250
                                                            0
                                                                                                                                       Zero contribution to
 200
 150
                                                                                                                                       Group dividend from
                                                            -2                                                                         Santam in 2020
 100
  50                                                        -4                                                                         (2019: R 753 million)
   0                                                               2016         2017           2018          2019          2020
       2006

       2017
       1999
       2000
       2001
       2002
       2003
       2004
       2005

       2007
       2008
       2009
       2010
       2011
       2012
       2013
       2014
       2015
       2016

       2018
       2019
       2020

                                                                 3-year CAGR           Lower band (2%)              Upper Band (4%)

                                                                                                                                                                   20
Sanlam Life capital management philosophy
The management of the Group’s capital base requires a continuous review of optimal capital levels, including
the use of alternative sources of funding, to maximise Return on GEV (RoGEV) and ensure appropriate
solvency levels as a safeguard to our clients, regulators and broader society
The Group sets an appropriate level of required capital for Sanlam Life’s covered business under the
Prudential Standards, based on a standard formula Solvency Capital Requirement (SCR) targeted cover
range of between 170% and 210% over a 10-year projection period
At the lower end of the range, Sanlam Life’s covered business should be able to withstand more than two
economic shock scenarios and still have a SCR cover above 100%
For regulatory purposes, capital adequacy for the South African insurance operations is measured with
reference to the standard formula as specified under the Prudential Standards
21Sanlam Group and Sanlam Life Solvency
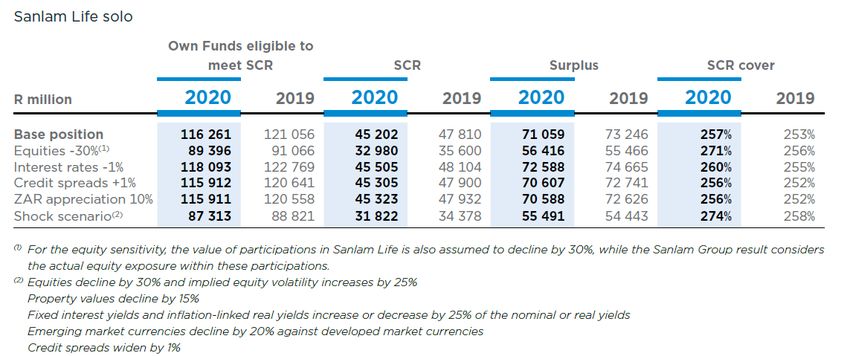
22Sanlam Life solo Solvency Capital Requirement
Main contributors to SCR are market risk and life risk
Main drivers of market risk are exposure to financial instruments
(especially resulting from future product fee income being linked to
policyholder investment portfolios) and participations, interest rate
movements and the value of investment guarantees
Main drivers of life risk include lapse assumptions, the level of interest
rates as well as mortality/longevity assumptions
23Sanlam Life solo SCR sensitivity analysis
24Outlook for 2021
Outlook for 2021

   Gradual economic recovery
   expected                         More clarity expected on Santam
                                    CBI matter
   However, recovery back to 2019
   levels only in the medium term
                                    Leave to appeal 18 months
                                    indemnity period granted

  Mortality claims outlook for
  remainder of 2021 is uncertain
                                    Sanlam has strong competitive
                                    positions in almost every market in
                                    which it competes
                                    Our people are resilient and ready to
                                    perform
  High base for new business
  volumes                           Our balance sheet is strong
  Persistency experience remains    We have a simple strategy for
  at risk                           execution to which all our people are
                                    aligned

                                                                            26
Debt programme
Key features of the programme
Issuer                          Sanlam Life Insurance Limited
Guarantor                       Sanlam Limited
Programme Type                  Unsecured Subordinated Callable Note Programme
Programme Size                  R6 billion
                                The Issuer is required to defer payment of principal if a Regulatory Deficiency Redemption Deferral Event has
Deferral of Principal
                                occurred, subject to conditions as prescribed by the Regulator.

                                If on any Interest Payment Date a Regulatory Deficiency Interest Deferral Event has occurred or would occur, the
Deferral of Interest
                                payment of interest in respect of the Notes otherwise falling due on such date shall be deferred.

Early Redemption or             If confirmed by the Auditors that a Capital Disqualification Event has occurred, the Issuer may at its option (but
                                subject to the prior written consent of the Regulator):
Substitution following
                                • Redeem all of the Notes; or
Capital Disqualification        • Substitute all of the Notes with new notes, or vary the terms of the Notes that it will become or remain
Event                              Qualifying Tier 2 Securities (subject to approval by noteholders by Extraordinary Resolution)
                                Notes may be redeemed at the option of the Issuer (subject to the prior written approval of the Regulator), if as a
Redemption for Tax
                                result of changes in laws or regulations the Issuer would be required to pay additional tax (relating to the Notes)
Reasons
                                and these additional amounts cannot be reasonably avoided.
                                • Non-payment (other than Deferred Payments)
Events of Default
                                • Insolvency
* The programme is in process of being updated to align inter alia with the latest Debt Listings Requirements of the JSE
                                                                                                                                                      28
Indicative issuance terms
Issuer Sanlam Life Insurance Limited
Issuer zaAAA (S&P)
Credit rating Guarantor zaA+ (S&P)
Subordinated Debt [zaA+] (S&P)
Programme R6 billion Unsecured Subordinated Callable Note Programme, registered on the JSE
Proposed auction date 11 August 2021 (settlement t+3)
Indicative target issue size R2 billion
5-year
Indicative tenor
7-year
Interest profile Floating, with the 3-month JIBAR as reference rate
Margin TBD
Ranking Subordinated
PA approval Application submitted 21 June - feedback expected late July
Auction process Sealed bid without feedback (Dutch Auction)
To refinance the SLI4 notes callable in August 2021, and to maintain the Issuer’s target debt /
Use of proceeds
equity ratio
29Indicative timeline
Indicative dates Action
22 – 24 June 2021 Investor virtual roadshow
26 July 2021 Term sheet, draft applicable pricing supplement and auction details released to investors
30 July 2021 Receive Prudential Authority approval
2 August 2021 S&P pre-sale rating released
4 August 2021 Updated term sheet with price guidance released to investors
11 August 2021 Proposed auction date
16 August 2021 Settlement date (T+3)
30thank you
31You can also read