PGM market outlook: our perspective - Richard Stewart EVP Business Development - The Vault
←
→
Page content transcription
If your browser does not render page correctly, please read the page content below
2. PGM market
        outlook:
our perspective

            Richard Stewart
  EVP Business Development

         SA PGM Investor Day
                 7 June 2018

                                 1
             www.sibanyestillwater.com
Disclaimer
 NOT FOR RELEASE, PRESENTATION, PUBLICATION OR DISTRIBUTION IN WHOLE OR IN PART IN, INTO OR FROM ANY JURISDICTION WHERE TO DO SO WOULD CONSTITUTE
 A VIOLATION OF THE RELEVANT LAWS OR REGULATIONS OF SUCH JURISDICTION.
 This presentation is for informational purposes only and does not constitute or form a part of any offer or solicitation to purchase or subscribe for securities in the United States
 or any other jurisdiction nor a solicitation of any vote of approval, nor shall there be any sale of securities in any jurisdiction in which such offer, solicitation or sale would be
 unlawful prior to registration or qualification under the securities laws of any such jurisdiction.
 The shares to be issued in connection with the offer for Lonmin plc (“Lonmin” and the “New Sibanye Shares”, respectively) have not been and will not be registered under the
 US Securities Act of 1933 (the “Securities Act”) and, accordingly, may not be offered or sold or otherwise transferred in or into the United States except pursuant to an
 exemption from the registration requirements of the Securities Act. The New Sibanye Shares are expected to be issued in reliance upon the exemption from the registration
 requirements of the Securities Act provided by Section 3(a)(10) thereof.
 This presentation is not a prospectus for purposes of Directive 2003/71/EC (and amendments thereto, including Directive 2010/73/EU, to the extent implemented in any
 relevant Member State) (the “Prospectus Directive”). In any EEA Member State that has implemented the Prospectus Directive, this presentation is only addressed to and is
 only directed at qualified investors in that Member State within the meaning of the Prospectus Directive. This presentation is not directed to, or intended for distribution to or
 use by, any person or entity that is a citizen or resident or located in any locality, state, country or other jurisdiction where such distribution, publication, availability or use
 would be contrary to law or regulation or which would require any registration or licensing within such jurisdiction.
 No statement in this presentation should be construed as a profit forecast.
 Forward looking statements
 This presentation contains forward-looking statements within the meaning of the “safe harbour” provisions of the United States Private Securities Litigation Reform Act of 1995.
 These forward-looking statements, including, among others, those relating to Sibanye Gold Limited’s trading as Sibanye-Stillwater’s (“Sibanye-Stillwater”) financial positions,
 business strategies, plans and objectives of management for future operations, are necessarily estimates reflecting the best judgment of the senior management and
 directors of Sibanye-Stillwater and Lonmin.
 All statements other than statements of historical facts included in this presentation may be forward-looking statements. Forward-looking statements also often use words such
 as “will”, “forecast”, “potential”, “estimate”, “expect” and words of similar meaning. By their nature, forward-looking statements involve risk and uncertainty because they
 relate to future events and circumstances and should be considered in light of various important factors, including those set forth in this disclaimer. Readers are cautioned not
 to place undue reliance on such statements.
 The important factors that could cause Sibanye-Stillwater’s and Lonmin’s actual results, performance or achievements to differ materially from those in the forward-looking
 statements include, among others, our future business prospects; financial positions; debt position and our ability to reduce debt leverage; business, political and social
 conditions in the United Kingdom, South Africa, Zimbabwe and elsewhere; plans and objectives of management for future operations; our ability to service our bond
 Instruments (High Yield Bonds and Convertible Bonds); changes in assumptions underlying Sibanye-Stillwater’s and Lonmin’s estimation of their current mineral reserves and
 resources; the ability to achieve anticipated efficiencies and other cost savings in connection with past, ongoing and future acquisitions, as well as at existing operations; our
 ability to achieve steady state production at the Blitz project; the success of Sibanye-Stillwater’s and Lonmin’s business strategy; exploration and development activities; the
 ability of Sibanye-Stillwater and Lonmin to comply with requirements that they operate in a sustainable manner; changes in the market price of gold, PGMs and/or uranium;
 the occurrence of hazards associated with underground and surface gold, PGMs and uranium mining; the occurrence of labour disruptions and industrial action; the
 availability, terms and deployment of capital or credit; changes in relevant government regulations, particularly environmental, tax, health and safety regulations and new
 legislation affecting water, mining, mineral rights and business ownership, including any interpretations thereof which may be subject to dispute; the outcome and
 consequence of any potential or pending litigation or regulatory proceedings or other environmental, health and safety issues; power disruptions, constraints and cost
 increases; supply chain shortages and increases in the price of production inputs; fluctuations in exchange rates, currency devaluations, inflation and other macro-economic
 monetary policies; the occurrence of temporary stoppages of mines for safety incidents and unplanned maintenance; the ability to hire and retain senior management or
 sufficient technically skilled employees, as well as their ability to achieve sufficient representation of historically disadvantaged South Africans’ in management positions;
 failure of information technology and communications systems; the adequacy of insurance coverage; any social unrest, sickness or natural or man-made disaster at informal
 settlements in the vicinity of some of Sibanye-Stillwater’s operations; and the impact of HIV, tuberculosis and other contagious diseases. These forward-looking statements
 speak only as of the date of this presentation. Sibanye-Stillwater and Lonmin expressly disclaim any obligation or undertaking to update or revise any forward-looking
 statement (except to the extent legally required).

Disclaimer                                                                                                                                                                                2
                                                                                                                                                      www.sibanyestillwater.com
Sibanye-Stillwater
   PGM demand
         outlook

                             3
         www.sibanyestillwater.com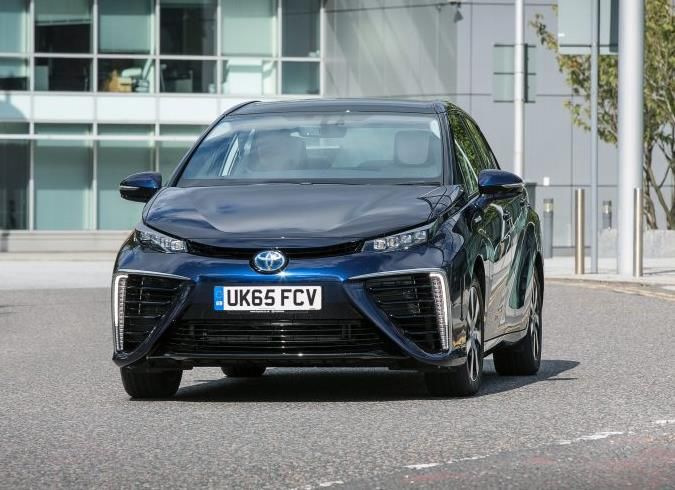
Platinum: the most functional precious metal
 • Gross platinum demand remains industrial biased
           – autocatalysts: 42% of platinum demand
           – industrial applications: 29%, with demand largely driven by global growth
           – platinum jewellery: 29% of total demand

                   2017 platinum demand                                                               Gross platinum demand
                            6%
                       3%                                                                     9 000
                  3%
            4%                                                                                8 000

                                                                                              7 000

                                                                      Platinum ounces (000)
       5%
                                                     42%                                      6 000
      2%
                                                                                              5 000

     6%                                                                                       4 000

                                                                                              3 000

                                                                                              2 000
            29%                                                                               1 000

                                                                                                  0
   Gross Autocatalyst                  Gross Jewellery                                                2007A        2009A         2011A   2013A       2015A      2017A

   Chemical                            Electrical (Net)
                                                                                              Gross Autocatalyst           Jewellery             Chemical
   Glass                               Investment
   Petroleum                           Medical and Biomedical                                 Electrical                   Fuel Cells            Glass
   Other                                                                                      Investments                  Petroleum             Medical and Biomedical

Sources include: Johnson Matthey, SFA Oxford, WPIC, company information                       Other
*PGMs: platinum group metals

There is more to PGMs* than autocatalysts                                                                                                                           4
                                                                                                                                            www.sibanyestillwater.com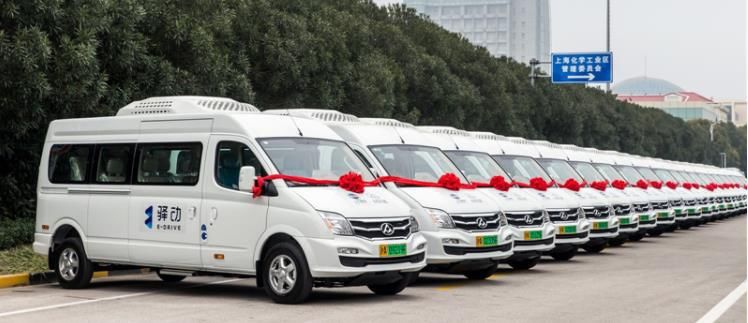
Palladium is largely an auto story
 • Palladium continues to have a much higher exposure to auto demand growth,
   given its primary use in gasoline autocatalysts
          – gross autocatalyst demand accounted for 84% of total palladium demand in 2017
          – other industrial demand components accounted for c.13% of total demand

            2017 palladium demand                                                                     Gross palladium demand

                    4% 2%1%
               4%                                                                            12 000
          5%
                                                                                             10 000

                                                                    Palladium ounces (000)
                                                                                              8 000

                                                                                              6 000

                                                                                              4 000

                                                                                              2 000

                                         84%                                                     0
                                                                                                      2007A 2008A 2009A 2010A 2011A 2012A 2013A 2014A 2015A 2016A 2017A

Gross Autocatalyst     Chemical                Dental                                                   Autocatalyst Gross     Chemical                 Dental

                                                                                                        Electronics (net)      Jewellery (net)          Investment (net)
Electronics (net)      Jewellery (net)         Other
                                                                                                        Other

Sources include: Johnson Matthey, SFA Oxford, WPIC, company information

Sustained growth in demand over the last decade                                                                                                                            5
                                                                                                                                                 www.sibanyestillwater.com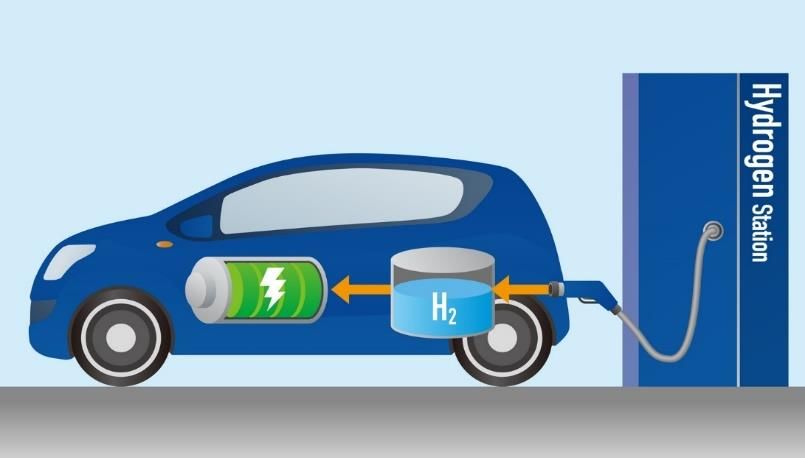
PGMs are a ‘basket’

                Breakdown of demand by metal use (2017)                          Demand           Global prill split
                                                                                 (Moz)
                                                                                           100%
      Irdium                                100
                                                                                 19.7
                                                                                           80%
  Ruthenium                                 100
                                                                                     7.2

    Rhodium      1                     82                        2       15                60%
                                                                                 10.2

  Palladium      -4                   83                     2      19                     40%
                                                                                     1.0

   Platinum      5             44                 22             29                        20%
                                                                                     1.0

Overall PGMs                    62                      10          28               0.2    0%
                                                                                                    South     Russia    North Zimbabwe    Other    Global
                                                                                                    Africa             America
  -20%         0%        20%          40%         60%        80%              100%
                                                                                                                     Pt
                                                                                                              Platinum    Pd   Rh
                                                                                                                          Palladium      Rhodium
                 Investment         Autocatalysts       Jewellery        Industrial

  Sources include: Johnson Matthey, SFA Oxford, WPIC, company information

  PGMs should not be looked at in isolation                                                                                                             6
                                                                                                                               www.sibanyestillwater.com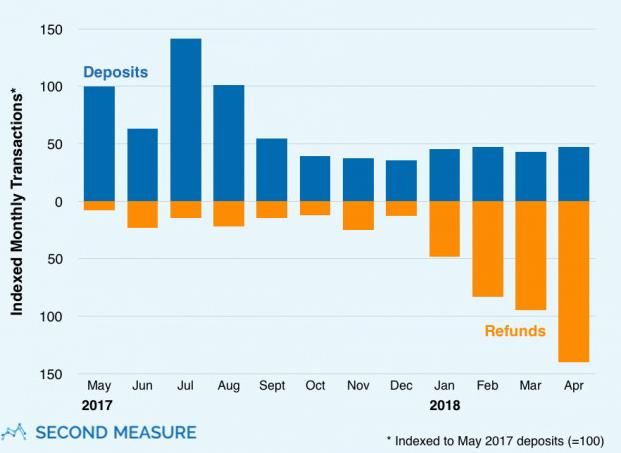
Automobiles and PGMs
 • Vehicle growth is expected to increase at a global CAGR of 2.1% over the next 10 years
 • By 2024, the light duty vehicle car park is expected to grow to 106 million vehicles
   from 92 million vehicles in 2017
 • By 2024, the heavy duty vehicle car park is expected to grow to 6 million vehicles
   from 5.4 million in 2017

                                                       Total number of vehicles produced

                           Passenger vehicles                                              Heavy duty vehicles

     Diesel         Petrol          Battery            Hybrid             Fuel      Diesel      Electric    Fuel cells
      ICE            ICE            electric           electric           cells

       ++Pt          ++Pd             No              ++Pd /Pt            +++Pt     +++Pt         No           +++Pt
                                     PGMs                                                        PGMs
          Pd               Pt                                   Rh           Rh            Pd                      Rh
          Rh              Rh                                                               Rh

                                Legislation, technology, macro economics, public perceptions

Sources include: Johnson Matthey, SFA Oxford, WPIC, company information

Autos are about more than battery electric vehicles (BEV) and diesel vehicles                                                7
                                                                                                      www.sibanyestillwater.com
The diesel debate
• Global warming versus human health
• Technology likely to close gap between diesel and gasoline CO2 emissions
and diesel and petrol NOx emissions
• Total cost of ownership of diesel still better
– fleet light duty diesel (LDD) accounts for 72% of total diesel LDD purchases in the EU
• Average 0.4g CO2/km increase of 2017 new vehicle fleet in Europe compared to 2016
(118.5 vs 118.1 in 2016) owes to reduced diesel share
• We forecast by 2024 global ICE diesel market share decrease to 10%
(from 18%), gasoline to 56% (from 78%) and the balance electric vehicles
Heavy duty diesel vehicles (HDD),
Light duty vehicles
by engine type
120 000 000
6 000 000
80 000 000
Vehicles
Vehicles
3 000 000
40 000 000
0 0
2016A
2017A
2018E
2019E
2020E
2021E
2022E
2023E
2024E
2016A
2017A
2018E
2019E
2020E
2021E
2022E
2023E
2024E
Gasoline Diesel Hybrid Electric Fuel Cell Gasoline Diesel Electric Hydrogen Other
Sources include: Johnson Matthey, SFA, BASF, company forecasts
A mix of vehicle types is required to meet global demands 8
www.sibanyestillwater.comThe outlook for BEVs is euphoric
• The outlook for battery electric vehicles (BEVs) is Tesla – Model 3 U.S. Deposits and Refunds
mixed and the spread of BEV penetration forecasts
is extreme
– outlier BEV penetration estimates range
from 2% to 11% by 2025E
• Electric vehicle (EV) and BEV assumptions
underpinning our PGM models are aggressive
– 33% EV penetration rate expected globally
by 2025E, with BEVs increasing global market share
to 6%
Outlier broker BEV penetration range Light vehicles, new technologies
(% of global car park)
40 000 000
14%
12%
10% outliers
8% Vehicles
20 000 000
6% consensus
4%
2%
0% 0
2017A 2018E 2019E 2020E 2021E 2022E 2023E 2024E 2025E 2016A 2017A 2018E 2019E 2020E 2021E 2022E 2023E 2024E
Gasoline - hybrid Diesel - hybrid Gasoline - electric
Sources include: Johnson Matthey, SFA, BASF, company forecasts Diesel - electric BEV Fuel Cell
Our BEV forecasts are well within current market ranges 9
www.sibanyestillwater.comWhat does this actually mean
• Hybrid vehicles are at worst neutral, and possibly positive for PGMs
• Gasoline vehicles – CAGR = 1.9% (+10.4m vehicles in 2024 compared to 2017)
• Diesel vehicles – CAGR = -0.8% (-0.95m vehicles in 2024 compared to 2017)
• BEV – CAGR = 33.9% (+4.3m vehicles in 2024 compared to 2017)
Light duty vehicles Light duty vehicles
120 000 000 120 000 000
80 000 000 80 000 000
Vehicles
Vehicles
40 000 000 40 000 000
0 0
2016A 2017A 2018E 2019E 2020E 2021E 2022E 2023E 2024E
2016A
2017A
2018E
2019E
2020E
2021E
2022E
2023E
2024E
Gasoline Diesel Hybrid Electric Fuel Cell Gasoline Gasoline - hybrid Gasoline - electric
Diesel Diesel - hybrid BEV
Fuel Cell
Sources include: Autofacts, Johnson Matthey, SFA, BASF, company forecasts
Gasoline and Diesel vehicles remain dominant in the autos mix 10
www.sibanyestillwater.comFuel cells
• Electrification of vehicle power train to include a range of
hybrids, batteries and fuel cells
• Batteries are a good supplier of power but a weak store of
energy while hydrogen tanks are a weak source of power
but a good store of energy
– Nissan Leaf (BEV): 110kW and 151 miles*
– Toyota Mirai (FEC): 114kW and 312 miles*
– Tesla Model S (BEV): 311kW and 303 miles*
• Fuel cell vehicles to be included in electrification mix
• Initial penetration to come from depot-structured
filling infrastructure
Fuel cell technology is an integral part of our powertrain strategy.
The advantages are very clear to us: zero emissions, long ranges
and short tanking times...
Christian Mohrdieck, Daimler's Fuel Cell Director
We believe fuel-cell vehicles remain the ultimate type
of zero-emission vehicle.
Honda CEO Takahiro Hachigo (June 2017)
*Johnson Matthey
Battery electric technology has paved the way for fuel cell development 11
www.sibanyestillwater.comFuel cells: China road map
• Chinese government roadmap the Fuel cell light vehicles
deployment of fuel cell vehicles 40 000
– 5,000 units (40% passenger cars) by
2020 and 100 hydrogen stations
Number of Vehicles
– 50,000 units by 2025 (80% passenger cars) and
300 hydrogen stations
20 000
– 1 million units by 2030 and
1,000 hydrogen stations
• Japanese government’s targets for
fuel cell vehicles:
0
– 40,000 units by 2020
– 200,000 units by 2025
– 800,000 units by 2030 Fuel Cell
• At 10g/ton, 5 million fuel cell vehicles
(Platinum jewellery – demand forecast
• Historically, jewellery has been a “shock absorber” to platinum demand
• However, since 2013 jewellery and investment buying have been more
consistently cyclical
Platinum jewellery price elasticity Platinum jewellery gross demand
2 500 2 000 3 500
1 800
2 000 3 000
1 600
1 500
Platinum price (US$/oz)
1 400 2 500
1 000
Ounces(000)
1 200
Ounces (000)
2 000
500 1 000
800 1 500
0
600
-500
1 000
400
-1 000
200
500
-1 500 0
2006A
2007A
2008A
2009A
2010A
2011A
2012A
2013A
2014A
2015A
2016A
2017A
2018E
2019E
2020E
2021E
2022E
2023E
2024E
2025E
0
2018E
2019E
2020E
2021E
2022E
2023E
2024E
2025E
2006A
2007A
2008A
2009A
2010A
2011A
2012A
2013A
2014A
2015A
2016A
2017A
China Demand Global Jewelry Pt Price (US$ / oz) (rhs)
- China - Europe - Japan - North America - Rest of World
Source: Johnson Matthey, SFA Oxford, PGI, company estimates
Demand likely to be driven by the platinum price 13
www.sibanyestillwater.comPlatinum – demand forecast
Gross platinum demand
9 000
8 000
7 000
6 000
Ounces(000)
5 000
4 000
3 000
2 000
1 000
0
2007A 2009A 2011A 2013A 2015A 2017A 2019E 2021E 2023E 2025E
Gross Autocatalyst Jewellery Chemical Electrical
Fuel Cells Glass Investments Petroleum
Medical and Biomedical Other
Source: Johnson Matthey, SFA Oxford, WPIC, company estimates
Platinum demand to remain steady over the forecast period 14
www.sibanyestillwater.comPalladium – demand forecast
• Gasoline expected to maintain majority share of global auto market to 2025
• Legislative and technological trends reinforcing outlook for steady, continued demand
for palladium
• Industrial sector demand expected to remain flat at best on the back of anticipated
palladium price resilience
• Jewellery demand expected to contract further due to increased price pressure and
limited market development
Gross palladium demand
14 000
12 000
10 000
Ounces('000)
8 000
6 000
4 000
2 000
0
2007A 2008A 2009A 2010A 2011A 2012A 2013A 2014A 2015A 2016A 2017A 2018E 2019E 2020E 2021E 2022E 2023E 2024E 2025E
Autocatalyst Gross Chemical Dental Electronics (net) Jewellery (net) Investment (net) Other
Source: Johnson Matthey, SFA Oxford, WPIC, company estimates
Sustained palladium demand growth 15
www.sibanyestillwater.comSibanye-Stillwater
PGM supply outlook
16
www.sibanyestillwater.comPlatinum – primary supply
• Capital underinvestment by South African PGM producers (c.70% of global primary
platinum supply) since 2008 global financial crisis
– insufficient to replace current production levels
• Without incentive-driven price growth, new supply coming on-stream seems unlikely
or delayed
– South African primary production expected to decline by 13% by 2025 (-1.5% CAGR)
• No new production expected from the western limb without a real basket price escalation
exceeding 20-25%.
– western limb represents more than 70% of South African supply
South African capital expenditure Primary platinum supply
7000
6000
5000
Ounces (000)
4000
3000
2000
1000
0
South Africa Russian Sales North America Zimbabwe Other
Sources: SBG Securities and Johnson Matthey, SFA Oxford, company estimates
Supply declines driven by low basket prices 17
www.sibanyestillwater.comPalladium – primary supply
• Supply expected to decline over forecast period on the back of a decline in
South African production
• Russian and North American supply expected to remain stable
Primary palladium supply
10000
9000
8000
7000
Ounces (000)
6000
5000
4000
3000
2000
1000
0
South Africa Russian Sales North America Zimbabwe Other
Source: Johnson Matthey, SFA Oxford, WPIC, company estimates
Palladium supply constant, driven primarily by regions where basket prices are not platinum dependent 18
www.sibanyestillwater.comPGM recycling – secondary supply
Platinum Palladium
1 600 2 000 4 000 1 200
1 400 1 800 3 500
1 000
1 600
1 200 3 000
1 400
800
1 000 2 500
Ounces (000)
Ounces (000)
1 200
US$/oz
US$/oz
800 1 000 2 000 600
600 800 1 500
400
600
400 1 000
400
200
200 200 500
0 0 0 0
2010A 2012A 2014A 2016A 2018E 2020E 2022E 2024E 2010A 2012A 2014A 2016A 2018E 2020E 2022E 2024E
Europe Japan North America Europe Japan North America
China Rest of World US$ / oz (rhs) China Rest of World US$/oz (rhs)
60% 2 000 60% 1 200
1 800
50% 50% 1 000
1 600
1 400 40% 800
40%
1 200
US$/oz
US$/oz
30% 600
%
30% 1 000
%
800
20% 20% 400
600
400 10% 200
10%
200
0% 0 0% 0
2010A 2012A 2014A 2016A 2018E 2020E 2022E 2024E 2010A 2012A 2014A 2016A 2018E 2020E 2022E 2024E
Recovery rate (%) US$/oz (rhs) Recovery rate (%) US$/oz (rhs)
A supply source driven by factors other than PGM prices 19
www.sibanyestillwater.comPlatinum – supply deficit on the horizon
• Despite ongoing diesel and EV concerns, platinum’s fundamentals remain robust
– limited primary and secondary supply growth anticipated globally
– significant producer capital underinvestment has resulted in long-term South Africa
primary producer supply instability
– demand is well supported, even in weakening diesel markets
• Platinum likely to be marginally in surplus for the remainder of this decade,
thereafter reverting to material deficit as primary production from
South Africa contracts
Platinum balance
1 000 2 000
800 1 800
600 1 600
400 1 400
Ounces (000)
200 1 200
US$/oz
0 1 000
-200 800
-400 600
-600 400
-800 200
-1 000 0
2007A 2012A 2017A 2022E
Surplus / (Deficit) Ex-ETF market balance Pt Price (US $ / oz) (rhs) Jewellery sensitivity
Source: Internal demand and supply model based on WPIC information, broker consensus and other sources
Despite declining diesel market share and EV concerns, we remain fundamentally bullish 20
www.sibanyestillwater.comPalladium – becoming the most precious PGM?
• Palladium set for sustained deficits
– excess inventories already closing in on normalised levels
– gasoline vehicles expected to maintain a majority market share to 2025 and
to increase in absolute numbers including gasoline hybrids
– primary supply to remain largely stable, to marginal decline
– excess palladium inventories forecast by Sibanye-Stillwater to reduce to nil by 2021
Palladium balance Excess inventory stocks
3 000 1 200 1 000
1 100 800
2 000
1 000
Days of excess inventory
600
900
1 000
400
800
US$/oz
Koz
0 700 200
600 0
-1 000
500
-200
400
-2 000
-400
300
-3 000 200 -600
2007A 2012A 2017A 2022E 1992A 1996A 2000A 2004A 2008A 2012A 2016A 2020E 2024E
Surplus / Deficit (koz) Ex-ETF market balance Platinum Palladium Rhodium
Pall Price (US $ / oz) (rhs)
Source: Internal demand and supply model based on WPIC information, broker consensus and other sources
Palladium outperformance set to continue 21
www.sibanyestillwater.comSubstitution – from palladium to platinum
• We believe that it is inevitable that there will be substitution from palladium to platinum
• In our view, significant substitution unlikely in the short term (< two – three years)
– Requires sustained (c.400 $/oz) price gap…(OEM)
– several years to develop, implement and licence…(OEM)
– Fabricators suggest technically feasible but timeous…..
• Recyclers claim to be seeing substitution already occurring in after market exhaust systems
• Our assumptions are modelled on substitution trends observed in 1990s
• Substitution reduces platinum's sensitivity to diesel
Average PGM loadings pre substitution Average PGM loadings post substitution
6.0 6.0
grams per vehicle
grams per vehicle
3.0 3.0
0.0 0.0
2010A 2013A 2016A 2019E 2022E 2025E 2010A 2013A 2016A 2019E 2022E 2025E
Platinum
Pt Palladium
Pall Rhodium
Rhod Pt
Platinum Pall
Palladium Rhod
Rhodium
Source: Johnson Matthey, SFA Oxford, company estimates
Supply pressures, technology and legislation will drive substitution rates 22
www.sibanyestillwater.comSubstitution means better overall balance
Platinum
1 000 2 000 1 500 2 000
800 1 800 1 800
1 000
600 1 600 1 600
400 1 400 1 400
500
200 1 200 1 200
US$/oz
US$/oz
Koz
0 1 000
Koz
0 1 000
-200 800 800
-500
-400 600 600
-600 400 400
-1 000
-800 200 200
-1 000 0 -1 500 0
2007A 2012A 2017A 2022E 2007A 2012A 2017A 2022E
Surplus / (Deficit) Ex-ETF market balance Surplus / (Deficit) Ex-ETF market balance
Pt Price (US $ / oz) (rhs)
Pt Price (US $ / oz) (rhs)
Palladium
2 500 1 200
3 000 1 200
2 000 1 100
1 100
2 000 1 500 1 000
1 000
900
900 1 000
1 000 800
US$/oz
800 500
US$/oz
Koz
700
Koz
0 700 0
600
600 -500
-1 000 500
500
-1 000 400
400
-2 000 -1 500 300
300
-2 000 200
-3 000 200
2007A 2012A 2017A 2022E
2007A 2012A 2017A 2022E
Surplus / Deficit (koz) Ex-ETF market balance
Surplus / Deficit (koz) Ex-ETF market balance
Pall Price (US $ / oz) (rhs)
Pall Price (US $ / oz) (rhs)
Source: Internal demand and supply model based on WPIC information, broker consensus and other sources
Substitution provides more near-term certainty but is not a long-dated solution 23
www.sibanyestillwater.comExcess inventories
Platinum
• A review of cumulative stocks 1 000 2 000
since1974 confirms material 900 1 800
palladium deficits 800 1 600
700 1 400
• Market is unsustainable as is 600 1 200
US$/oz
and requires investment to
Days
500 1 000
drive supply 400
300
800
600
• Balancing the PGM basket is 200 400
critical for a sustainable market 100
0
200
0
1992A 1996A 2000A 2004A 2008A 2012A 2016A 2020E 2024E
Days excess inventory US$/oz
Palladium
1 000 1 200
800
1 000
600
800
400
Days
US$/oz
200 600
0
400
-200
200
-400
-600 0
1992A 1996A 2000A 2004A 2008A 2012A 2016A 2020E 2024E
Source: Johnson Matthey, Sibanye-Stillwater (2018) Days excess inventory US$/oz
* Investment stock treated as a stock movement
Combined excess inventories are approaching the lowest levels in decades 24
www.sibanyestillwater.comConclusion
• Platinum demand expected to be stable while primary supply is under threat
– Supply driven deficits are expected in the next three years
– Basket price increases of more than 25% required to incentivise South African supply growth
• Palladium demand will continue to increase underpinned by robust growth in gasoline
market
– Sustained and material market deficits continue to be forecast
• Substitution across the PGM’s appears inevitable, but unlikely to occur on a material scale
in next three years
• Power trains will continue to evolve and comprise a mix of technologies over the long term,
including fuel cells
• PGM markets need to be strategically managed as a “basket” and Sibanye-Stillwater is
ideally positioned to deliver into changing demand cycles
Global platinum:palladium prill split
90%
80%
Russia North America
70%
Global net demand
60%
Palladium
50% Zimbabwe
40%
Sibanye-Stillwater
30%
South Africa
20%
10%
0%
0% 10% 20% 30% 40% 50% 60% 70% 80%
Platinum
Source: Johnson Matthey, SFA Oxford, WPIC, company estimates
Strategic management of the PGM supply chain is required to meet forecast demand 25
www.sibanyestillwater.comYou can also read