Half year results presentation - Six months ended 30 September 2019 7 November 2019

Page created by Cory Harmon
 
CONTINUE READING
Half year results presentation - Six months ended 30 September 2019 7 November 2019
Half year results
presentation
Six months ended 30 September 2019

7 November 2019

                                     1
Half year results presentation - Six months ended 30 September 2019 7 November 2019
Disclaimer
IMPORTANT: The following applies to this document, the oral presentation of the information in this document by Auto Trader Group plc (the “Company”) and/or any person on behalf of the Company, and any question-and-answer session that
follows the oral presentation (the “Information”). By attending the meeting where this presentation is made or by reading this document, you agree to be bound by the limitations set out below.

Not for publication, transmission, distribution or release, in whole or in part, directly or indirectly, in or into any jurisdiction in which the publication, transmission, distribution or release of the Information would be unlawful. Any failure to
comply with this restriction may constitute a violation of applicable securities laws and regulations. Persons into whose possession this document comes should observe all relevant restrictions.

This presentation is being communicated only to and is only directed at those persons (i) in the United Kingdom that are (a) investment professionals falling within Article 19(5) of the Financial Services and Markets Act 2000 (Financial Promotion)
Order 2005 (the “Order”), or (b) high net worth entities or other persons falling within Articles 49(2)(a) to (d) of the Order, or (ii) to whom it would otherwise be lawful to distribute it, and should not be relied upon by any other person. The
Information is for those persons attending this presentation (and to whom this presentation is directed) only, and is solely for their information and may not be reproduced, further distributed or passed on, directly or indirectly, to any other
person or published in whole or in part for any purpose.

This presentation does not constitute or form part of and should not be construed as an offer of securities for sale or subscription of or a solicitation of any offer to purchase securities in the United States. Securities may not be offered or sold in
the United States absent registration under the US Securities Act of 1933, as amended (the "US Securities Act") or pursuant to an exemption from, or in a transaction not subject to, the registration requirements of the US Securities Act. The
Company does not intend to register any securities under the US Securities Act or with any state or other jurisdiction of the United States and it does not intend to offer any securities for sale in the United States.

This presentation does not purport to be full or complete.

This presentation does not constitute or form part of and should not be construed as an offer for sale or subscription of, or solicitation of any offer to buy or subscribe for, any securities of the Company in any jurisdiction nor is it an invitation or
inducement to enter into investment activity nor should it form the basis of or be relied on in connection with any contract or commitment or investment decision whatsoever. It does not constitute a recommendation regarding any securities.

Past performance, including the price at which the Company’s securities have been bought or sold in the past and the past yield on the Company’s securities, cannot be relied on as a guide to future performance. Nothing herein should be
construed as financial, legal, tax, accounting, actuarial or other specialist advice.

The information and opinions provided in this presentation are provided as of the date of this presentation. Certain statements in this presentation constitute forward looking statements (including beliefs or opinions) which are based on current
expectations and projections about future events. These statements may include, without limitation, any statements preceded by, followed by or including words such as “target”, “believe”, “expect”, “aim”, “intend”, “may”, “anticipate”,
“estimate”, “plan”, “project”, “will”, “can have”, “likely”, “should”, “would”, “could” and other words and terms of similar meaning or the negative thereof. Any statement in this presentation that is not a statement of historical fact including,
without limitation, those regarding the Company’s future expectations, operations, financial performance, financial condition and business is a forward looking statement. Such forward looking statements are subject to risks and uncertainties
that may cause actual results to differ materially from those expressed or implied by such forward looking statements. These risks and uncertainties include, among other factors, changing economic, financial, business or other market
conditions. These and other factors could adversely affect the outcome and financial effects of the plans and events described in this presentation. No representation or warranty is made that any forward looking statement will come to pass.
As a result you are cautioned not to place reliance on such forward looking statements. Nothing in this presentation should be construed as a profit forecast.
No reliance may be placed for any purposes whatsoever on the Information, or on its completeness, accuracy or fairness.

No representation, warranty or undertaking, express or implied, is or will be made or given by or on behalf of the Company or any of its directors, officers, advisers, agents or employees or any other person, as to the accuracy, fairness or
completeness of the information or opinions contained in this presentation and, to the extent permitted by law, no liability whatsoever (in negligence or otherwise) is accepted by the Company or any of its respective directors, officers,
advisers, agents or employees, or any other person, for any loss, howsoever arising, directly or indirectly, from any use of such information or opinions or otherwise arising in connection therewith. In particular, no representation or warranty is
given as to the achievement or reasonableness of, and no reliance should be placed on, any projections, targets, estimates or forecasts contained in this presentation and nothing in this presentation is or should be relied on as a promise or
representation as to future events. Any reliance you place on the information contained in this presentation will be at your sole risk. The information set out herein may be subject to updating, completion, revision, verification and amendment
and may change materially without notice. None of the Company, its directors, officers, advisers, agents or employees or any other person undertakes to or is under any obligation to update or keep current the information in the presentation or
to provide recipients with any additional information.

To the extent available, the industry, market and competitive position data contained in the Information comes from official or third party sources. Third party industry publications, studies and surveys generally state that the data contained
therein has been obtained from sources believed to be reliable, but that there is no guarantee of the accuracy or completeness of such data. While the Company reasonably believes that each of these publications, studies and surveys has been
prepared by a reputable party, neither the Company, nor any of their respective subsidiary undertakings or affiliates, or their or their subsidiary undertakings’ or affiliates’ respective directors, officers, employees, advisers or agents have
independently verified the data contained therein. In addition, certain of the industry, market and competitive position data contained in the Information come from the Company’s own internal research and estimates based on the knowledge
and experience of the Company’s management in the markets in which the Company operates. While the Company reasonably believes that such research and estimates are reasonable and reliable, they, and their underlying methodology and
assumptions, have not been verified by any independent source for accuracy or completeness and are subject to change. Accordingly, reliance should not be placed on any of the industry, market or competitive position data contained in the
Information.

Certain figures contained in this presentation, including financial information, have been subject to rounding adjustments. Accordingly, in certain instances, the sum or percentage change of the numbers contained in this presentation may not
conform exactly to the total figure given.

                                                                                                                                                                                                                                                            2
Half year results presentation - Six months ended 30 September 2019 7 November 2019
Financial highlights

 +   6%   Revenue: up 6% to £186.7 million (H1 2019: £176.8 million)

 +   9%   Operating profit: up 9% to £131.4 million (H1 2019: £120.6 million)

 70%      Operating profit margin: up 2% points to 70% (H1 2019: 68%). Operating cost growth of 2%

+   14%   Earnings and distribution: Basic EPS up 14% to 11.13 pence (H1 2019: 9.78 pence); interim dividend of 2.4 pence per
          share (H1 2019: 2.1 pence per share)

 +   3%   Cash generated from operations: up 3% to £132.7 million (H1 2019: £129.0 million). Cash conversion for the period was
          98% (H1 2019: 101%)

£70m
          Cash returned to shareholders: £69.8 million cash returned to shareholders (H1 2019: £80.8million) through £27.2
          million of share buy-backs (H1 2019: £42.9 million) plus dividends paid of £42.6 million (H1 2019: £37.9 million)

                                                                                                                                  3
Half year results presentation - Six months ended 30 September 2019 7 November 2019
Operational highlights

             Cross platform visits: up 4% to 51.2 million per month on average (H1 2019: 49.3 million) and we have grown our share of
 +   4%      minutes amongst our full competitor set to over 75% (H1 2019: 72%). Advert views were down 6% at 233 million per month
             on average (H1 2019: 247 million)

    +   1%   Retailer forecourts up 1%: the average number of forecourts in the period was 13,316 (H1 2019: 13,153)

    +   7%   ARPR: up £125 to £1,951 on average per month (H1 2019: £1,826), with growth from product and price offsetting a small
             but expected decline in paid stock

+   10%      Physical car stock on site: up 10% to 481,000 cars (H1 2019: 437,000) on average. New car listings contributed 33,000
             to that average (H1 2019: 3,000)

 798         Number of employees and contractors (FTEs): stable at 798 on average during the period (H1 2019: 802)

                                                                                                                                     4
Half year results presentation - Six months ended 30 September 2019 7 November 2019
We are making good progress against our strategy
                                                                                                                Horizon 3
                                                                Horizon 2
                  Horizon 1

 Core                                           Adjacent                                         Future
  We look to continually enhance our            Become to new cars what we are in                Help consumers transact online
  core through:                                 used
                                                                                                 •   Vehicle Check enables increasing online
  •    core listing prominence
                                                Develop a more efficient way for                     confidence
       products;
                                                retailers to source, dispose and
  •    supplying data tools; and                move vehicles
  •    allowing retailers to advertise
       their finance products.                   •   Growing new car marketplace and
                                                     commencing monetisation
  •   Successful packaging event                 •   Dealer Auction - business integration and
  •   Upselling Advanced and Premium packages        move to a single platform progressing to
  •   Increasing Managing tools penetration          plan
  •   Acquisition of KeeResources

                                                                                                                                               5
                                                                                                                                                   5
Half year results presentation - Six months ended 30 September 2019 7 November 2019
Financials

             6
Half year results presentation - Six months ended 30 September 2019 7 November 2019
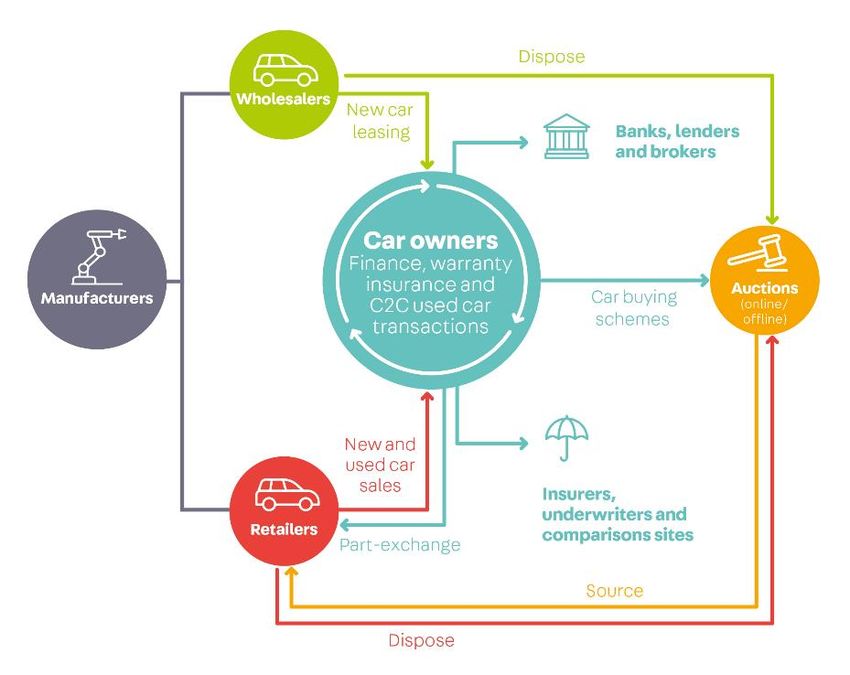
Revenue                                                                                                                Number of retailer forecourts (1)

                                                                                                                           Y-on-Y %                   (1%)           (0%)            1%

    Revenue (£m)
    Six months ended 30 September 2019 is shown as H1 2020
                                                                                                                                                 13,213             13,153          13,316
   Year-on-                  7%                           7%                          6%
   year growth
                                                                                                                                                H1 2018            H1 2019         H1 2020
                                                                                    186.7
                                                        176.8                                            (22%)
                           165.0                                                       9.0
                                                           11.5                       15.9                                 Average Revenue Per Retailer (ARPR) (£) (1)
                             9.0                          15.2                                             5%
                            16.6                                                                                           Y-on-Y                     £148           £152            £125
                                                                                                                           £pcm
                                                                                                                                                                             +7%
                                                                                                                                                             +9%

                                                                                     161.8                 8%                                                       1,826           1,951
                           139.4                         150.1                                                                                   1,674

                                                                                                                                               H1 2018             H1 2019         H1 2020

                                                                                                                           Retailer revenue (£m)
                          H1 2018                      H1 2019                     H1 2020
                                                                                                                           Y-on-Y %                   8%             9%              8%
                     Trade         Consumer services              Manufacturer & Agency

Trade revenue comprises:                                          Consumer services revenue comprises
H1 2020: Retailer (£155.9m); Home Trader (£4.9m); Other (£1.0m)   H1 2020: Private (£11.8m); Motoring Services (£4.1m)                            132.7             144.1           155.9
H1 2019: Retailer (£144.1m); Home Trader (£5.4m); Other (£0.6)    H1 2019: Private (£11.0m); Motoring Services (£4.2m)
H1 2018: Retailer (£132.7m); Home Trader (£6.2m); Other (£0.5m)   H1 2018: Private (£12.6m); Motoring Services (£4.0m)

                                                                                                                                                H1 2018            H1 2019         H1 2020

                                                                                                                         (1) Average monthly metric
                                                                                                                                                                                             7
Half year results presentation - Six months ended 30 September 2019 7 November 2019
Product remains the largest lever of ARPR growth whilst stock continues to be a
headwind as expected
ARPR levers                                                                                   Physical car stock and retailer forecourts
Growth in Average Revenue Per Retailer per month (£)

                                                                                              Y-on-Y average                                                0%
                                                                                                                                     (1%)                                        1%
                                                                                              retailers
                                           £152                    £125                       Y-on-Y average
(£)             £148                                                                                                                 1%                     2%                 10%
                                                                                              live physical car
                                                                                              stock
(%)              10%                        9%                     7%                                                                                               Impact of new car
                                                                                                                                                                    which does not
                                                                                                                  16,000                                            impact stock lever   500
                                                  142
                                                                                                                                                                                         480

                                                                                                                                                                                               Live physical car stock ('000)
                                                                                                                  15,000
                                                                                                                                                                                         460

                                                                                              Average retailers
                                                                            80                                                                                                           440
                                                                                                                  14,000
          55     48                  55                       50                                                                                                                         420
                       45
                                                                                                                  13,000                                                                 400
                                                                                                                                                                                         380
                                                                                                                  12,000
                                                                                                                                                                                         360
                                                                    (5)
                                                                                                                                                                                         340
                                                                          Includes a (£9)                         11,000
                                                                          headwind from the                                                                                              320
                                           (45)                           transfer of
                                                                          SmartBuying to                          10,000                                                                 300
                                                                          Dealer Auction                                   2018                   2019                    2020
               H1 2018                    H1 2019              H1 2020                                                            Average retailers
                             Price        Stock     Product                                                                       Live physical used car stock (12 month average)
                                                                                                                                  Live physical car stock (12 month average)                                                    8
Half year results presentation - Six months ended 30 September 2019 7 November 2019
Costs                                                                                          FTEs (including contractors)(2)

                                                                                               Y-on-Y %               (1%)                         (2%)                          (1%)
Costs (£m)
Six months ended 30 September 2019 is shown as H1 2020

Year-on-                                                                                                               818                         802                          798
                  4%                         2%                         2%
year growth

                55.1                       56.2                       57.1                                          H1 2018                      H1 2019                     H1 2020
                                                                       3.3           (27%)
                 4.6                        4.5
                                                                                               Marketing as a % of revenue

                                            14.1                      15.6            11%
                14.6                                                                                                5.3%                                                      5.4%
                                                                                                                                                 5.2%

                                            9.2                       10.1           10%
                 8.8

                                                                                                                   H1 2018                     H1 2019                      H1 2020
                                                                                     (1%)
                27.1                       28.4                       28.1
                                                                                               Capital expenditure (excluding acquisitions) (£m)

              H1 2018                    H1 2019                    H1 2020

              People costs         Marketing          Other costs     (1)
                                                                             D&A                                        2.2                         0.8                         0.9

              People costs include share-based payments and associated national
              insurance costs of £3.1m in H1 2020 (H1 2019:£3.2m ; H1 2018: £1.8m)
                                                                                                                     H1 2018                     H1 2019                     H1 2020

                                                                                             (1)   Other costs include: property, IT & comms, data services and other corporate overheads
                                                                                                                                                                                            9
                                                                                             (2)   Average monthly metric
Profit and cash flow
Operating profit (£m)*                                                                     Cash generated from operations (£m)
Six months ended 30 September 2019 is shown as H1 2020                                     Six months ended 30 September 2019

Year-on-            9%                        10%                           9%                9%                   2.7          (2.6)                      3%
year growth                                                                                             3.3                             (0.3)    (1.8)

                                              68%                           70%
                   67%

                                                                                             131.4                                                        132.7
                                                                            131.4
                                             120.6
                  109.9

                 H1 2018                    H1 2019                      H1 2020           Operating    D&A      SBP (exc Movement Other non- Share of      Cash
                                                                                             profit                NI)    in working cash    profit from generated
                     Operating profit                   Operating profit margin                                             capital             JVs       from ops

                            Operating profit includes the Group’s share of profit from
                            joint ventures: H1 2020: £1.8m; (H1 2019: nil; H1 2018: nil)
                                                                                                                                                                     10
Income statement

                                                                   H1 2020       H1 2019      Year-on-year
                                                                  £ million     £ million                 %
Revenue                                                               186.7        176.8                 6%
Administrative expenses                                               (57.1)       (56.2)              (2%)
Share of results of joint ventures                                        1.8             -            n.m
Operating profit                                                       131.4       120.6                 9%
Finance costs – net                                                     (3.7)         (6.1)            39%
Profit before taxation                                                127.7          114.5              12%
Taxation                                                             (24.5)         (21.9)            (12%)
Profit for the year attributable to equity owners of the parent       103.2          92.6              12%

Earnings per share (pence)
Basic                                                                 11.13p       9.78p               14%
Diluted                                                              11.08p        9.75p               14%

Dividend per share (pence)                                             2.4p           2.1p             14%

                                                                                                              11
Net external debt and capital allocation
      Reconciliation of net external debt (1) (£m)                                                                                     Capital allocation
                                                                                                                                       •   The Group’s capital allocation policy outlined in the
          1.2x                                                                                                           1.1x              2019 full year results remains unchanged
                                                            Leverage (2)
                                                                                                                                       •   The Group will continue to invest in the business
         307.1        132.7      (0.9)        (1.3)       (3.1)        (0.5)       (47.3)     (42.6)      (27.3)        297.4              however the high level of cash conversion means that
                                                                                                                                           significant surplus cash will be generated
                                                                                                                                       •   The majority of surplus cash will be used to continue the
                                                                                                                                           Group’s share buy-back programme. During the period,
                                                                                                                                           5.1m shares were repurchased at an average price of
                                                                                                                                           532p for consideration of £27.2m plus costs of £0.1m
                                                                        Increased as 4 quarterly instalment
                                                                        payments made as HMRC accelerated                              •   The acquisition of KeeResources meant that the Group
                                                                        payment dates for very large companies
                                                                                                                                           increased gross debt in the period, using the revolving
        March 2019      Cash     Capex       Lease      Net interest Refinancing   Tax paid   Dividends   Share buy-   September
                                                                                                                                           credit facility, in advance of completing the
                     generated              payments                     fees                             backs (inc      2019
                      from ops                                                                              costs)                         transaction on the 1st October. By the end of the
Gross                                                                                                                                      financial year we aim to have reduced the level of
bank £313m                        Gross bank debt increased by £16m through the period                                 £329m
debt                                                                                                                                       gross debt by a modest amount
                                                                                                                                       •   Our current policy is to distribute around one third of
(1) Net external debt represents gross external bank debt before amortised debt costs less cash and does not include amounts
    relating to leases
                                                                                                                                           total net income for the year in the form of dividend; an
(2) Leverage is net external debt as a multiple of Adjusted underlying EBITDA (AUEBITDA). AUEBITDA is earnings before interest, tax,       interim dividend of 2.4p has been recommended
    depreciation, amortisation, share-based payments and associated NI, share of profit from joint ventures and exceptional items

                                                                                                                                                                                                   12
The UK car
market and our
position

                 13
The UK market continues to be challenging as the volume of new and
used car transactions decline
New car registrations (1)                                                                Used car transactions (2)

                      (11.0%)                           (3.7%)                  (2.6%)                            (3.1%)                       (0.9%)   (2.9%)

 (1) Society of Motor Manufacturers & Traders (SMMT) – 12 month rolling total
                                                                                          (2) DVLA transaction data – 12 month rolling total

                                                                                                                                                                 14
Used car prices have decreased marginally in the period

Like-for-like
price increase                           0.3%                                                                        2.4%                                                                    3.5%                                            (0.6%)

14,000                                                                                                                                                                                                                                                               16.0%
                                                                                                                                                                                                                                                                     14.0%
12,000
                                                                                                                                                                                                                                                                     12.0%
10,000                                                                                                                                                                                                                                                               10.0%
                                                                                                                                                                                                                                                                     8.0%
 8,000
                                                                                                                                                                                                                                                                     6.0%
 6,000
                                                                                                                                                                                                                                                                     4.0%

 4,000                                                                                                                                                                                                                                                               2.0%
                                                                                                                                                                                                                                                                     -
 2,000
                                                                                                                                                                                                                                                                     (2.0%)
    -                                                                                                                                                                                                                                                                (4.0%)
                     Jun
                           Jul

                                       Sep

                                                         Dec
                                                               Jan

                                                                                             Jun
                                                                                                   Jul

                                                                                                               Sep

                                                                                                                                 Dec
                                                                                                                                       Jan

                                                                                                                                                                     Jun
                                                                                                                                                                           Jul

                                                                                                                                                                                       Sep

                                                                                                                                                                                                         Dec
                                                                                                                                                                                                               Jan

                                                                                                                                                                                                                                             Jun
                                                                                                                                                                                                                                                   Jul

                                                                                                                                                                                                                                                               Sep
               May

                                                                           Mar

                                                                                       May

                                                                                                                                                   Mar

                                                                                                                                                               May

                                                                                                                                                                                                                           Mar

                                                                                                                                                                                                                                       May
         Apr

                                 Aug

                                                                                 Apr

                                                                                                         Aug

                                                                                                                                                         Apr

                                                                                                                                                                                 Aug

                                                                                                                                                                                                                                 Apr

                                                                                                                                                                                                                                                         Aug
                                             Oct
                                                   Nov

                                                                                                                     Oct
                                                                                                                           Nov

                                                                                                                                                                                             Oct
                                                                                                                                                                                                   Nov
                                                                     Feb

                                                                                                                                             Feb

                                                                                                                                                                                                                     Feb
                                        2017                                                                    2018                                                                    2019                                                 2020
                                        Year-on-year price growth                                          Year-on-year impact caused by mix                                                  Average advertised price

                                       Note: During financial year 2019 we made a change to the price index to further identify changes in the average advertised price due to mix of
                                       stock compared to the underlying price increase. As a result 2017 and 2018 have been restated so all figures are on a like-for-like basis
                                                                                                                                                                                                                                                                              15
We are growing our audience with most of our visits coming organically

Cross platform visits Autotrader.co.uk (1)                                                                                 Split of unpaid vs. paid cross platform visits -
(Average pcm - million)                                                                                                    Autotrader.co.uk (1)

                                                                                                  60.0
             (2%)                         0%                                  4%
                                                                                                                                                    H1 2018                     H1 2019     H1 2020

                                                                                                  50.0
                                                                                                                           Non-
                                                                                                                           paid %
                                                                                                                           Paid %                          93%                      93%             91%
                                                                                                  40.0

                                                                                                  30.0
                                                                                                                            Advert views on Autotrader.co.uk (2)
             49.2                      49.3                                51.2                                             (Average pcm - million)

                                                                                                  20.0
                                                                                                                                   (2%)                                 1%                 (6%)

                                                                                                  10.0

                                                                                                                                  245.0                               246.9               233.0

                                                                                                  0.0
                                                                                                                                 H1 2018                             H1 2019              H1 2020
           H1 2018                  H1 2019                             H1 2020

                          (1)   As measured through Google analytics
                          (2)   Company measure of the number of inspections of individual vehicle advertisements on the UK marketplace (includes physical and virtual stock)                             16
Our position as market leader has strengthened in the period

         Share of minutes as measured by comScore (1)                                                                                      Total minutes spent in September 2019 (millions) (2)

                               H1 2018                             H1 2019                             H1 2020

                                                                                                                                                  707
     Auto Trader

                                   69%                              72%                                >75%

                   Gumtree/ Ebay
Ebay, Motors
  Gumtree,

                   Motors
                               19.3%                                17.4%                                 11.1%
                   Combined

                   CarGurus                                                                                                                                       89
Pistonheads

                                                                                                                                                                                  46
 CarGurus,

                   Piston-                                                                                                                                                                                                      22              14
                                                                                                                                                                                                   1              0
                   heads
                                   5.7%                               5.4%                               5.6%                                  AutoTrader      Gumtree/    CarGurus/            Heycar          Cinch      Manufacturers Dealer sites
                                                                                                                                                             Ebay/ Motors Pistonheads
                   Combined

                                     (1)   Share of minutes is a custom metric based on Comscore minutes (MM) (revised) and is calculated by dividing Auto Trader’s total minutes volume by the entire custom-defined competitive set’s total minutes
                                           volume. Comscore MMX® Multi-Platform, Total Audience, April 2017 through September 2019, UK. Custom-defined list includes: Auto Trader, Gumtree.com - Motors, eBay Motors UK, Pistonheads sites,
                                           Motors.co.uk, CarGurus, Auto Express.co.uk, Topgear.com, Parkers.co.uk, Whatcar.com, Carwow.com, Exchange&Mart, Vcars, RAC cars, Trusteddealers.co.uk, Carsnip.co.uk.
                                                                                                                                                                                                                                                        17
                                     (2)   Source: Comscore MMX® Multi-Platform, Total Audience, September 2019, UK. ‘Dealer sites’ Custom-defined list including - Arnold Clark, Evans Halshaw, Carshop, Lookers, Motorpoint, Availablecar.com,
                                           Stoneacre, Marshall, Motordepot, Cargiant, Imperial Car Supermarket, Big Motoring World, Pentagon, Pendragon, Sytner, Peter Vardy, Jardine, JCT600, TrustFord, Robins and Day, Carcraft, Listers.
Product
update

          18
Products launched through our April event have been well received
      Vehicle Check                                                                     Text Chat

 Vehicle Check enables retailers to check the provenance of vehicles they might    Text Chat gives buyers the ability to text
 be looking to source. The checks also provide consumers with a greater level of   retailers directly from adverts, through their
 transparency when searching on Auto Trader                                        text messaging app

                                                                                                                                    19
Our new car proposition is growing its audience and we are delivering
value for retailers

33,000       New cars on site per
             month

  19m        New car advert
             views in the first half

 1.6m        Consumers viewed a new
             car advert in September

                                                                        20
Outlook

          21
We have acquired KeeResources and Dealer Auction continues to
progress well

                                                     Sell faster. Buy smarter.

     Provides a unique vehicle data set that          Our joint venture with Cox
            underpins our platform                           Automotive

   Provides data to a range of customers in the   On track to transact approximately
 industry including fleet companies and lenders             100,000 vehicles

 Provides fleet management software to some of    Integration of the three businesses
          the largest providers in the UK                 is progressing well

                                                                                        22
2020 full year outlook
•   In the first half, we have seen stronger than expected revenue growth from retailers, underpinned by
    product innovation. We expect good ARPR growth to continue, albeit with a slightly increased
    headwind from stock.

•   We anticipate the average number of retailer forecourts to see modest year-on-year growth, largely
    through the acquisition of smaller retailers.

•   Consumer services growth is expected to moderate slightly as we lap a tougher comparative.

•   Manufacturer and Agency revenue, which is 5% of total revenue, has been weak due to challenges
    facing these customers and we anticipate the rate of decline will accelerate.

•   With KeeResources included, we anticipate total operating costs for the year to increase at low to
    mid-single digit percentage.

•   The Board is confident of meeting its growth expectations for the year.

                                                                                                           23
Appendix

           24
Cashflow statement
                                                        H1 2020       H1 2019
                                                       £ million     £ million

Profit before tax                                          127.7         114.5
Depreciation & amortisation                                   3.3          4.5
Share-based payments charge (excluding NI)                    2.7          2.6
Share of profit from joint ventures                          (1.8)           -
Finance costs - net                                           3.7          6.1
Other non-cash items                                        (0.3)            -
Changes in working capital                                  (2.6)          1.3
Cash generated from operations                             132.7        129.0

Tax paid                                                  (47.3)        (19.8)
Capital expenditure                                        (0.9)         (0.8)
Payment of lease liabilities                                (1.3)         (1.6)
Drawdown / (Repayment) of borrowings                         15.5      (20.0)
Interest paid                                               (3.1)        (3.3)
Payment of refinancing fees                                (0.5)         (3.3)
Dividends paid                                            (42.6)       (37.9)
Purchase of own shares                                    (27.2)       (42.9)
Fees on purchase of shares                                  (0.1)        (0.2)
Proceeds from exercise of share-based payments                0.1           0.1
Contributions to defined benefit contribution scheme        (0.1)             -

Net increase/ (decrease) in cash                           25.2         (0.7)

                                                                                25
KeeResources impact

• KeeResources annual revenue and Operating profit for their financial year ending December 2018 was
  £5.5m and £0.8m respectively

• 75% of KeeResources revenue, relating to non-Manufacturer customers will sit within Other, within our
  Trade segment, which does not impact ARPR. The remaining 25% will sit within Manufacturer and
  Agency

• We are yet to finalise the acquisition accounting but it is likely that we will recognise some specifically
  identifiable intangible assets that will be amortised

• At the time of acquisition, Kee Resources had 61 employees

• Consideration, net of cash acquired, was £25.3 million and was paid in full on the date of acquisition

                                                                                                                26
The automotive ecosystem

                           27
Auto Trader advertising package structure

        Starter                           Basic                          Standard                           Advanced                          Premium
                                                                         Improve visibility of your stock   Boost your ad views with our      Enjoy the greatest share of desktop ad
        Engage your buyers through        Stand out and encourage
                                                                         on mobile and drive more ad        bonus slot in search              views through priority stock placement
        the essentials of modern online   engagement through trust
                                                                         views
        retailing                         and transparency

                                                                                                                                                           Priority Listing
                                                                                                                                                           Desktop

                                                                                                                          Promoted                         Promoted

                                                                                        Priority Listing                  Priority Listing                 Priority Listing
                                                                                        Mobile                            Mobile                           Mobile
                                                     Enhanced Listings                  Enhanced Listings                 Enhanced Listings                Enhanced Listings

                                                     Vehicle Video                      Vehicle Video                     Vehicle Video                    Vehicle Video

                                                     Gallery Branding                   Gallery Branding                  Gallery Branding                 Gallery Branding

                    Text chat                        Text chat                          Text chat                         Text chat                        Text chatTrade
                                                                                                                                                           Test the

                    Live Chat                        Live Chat                          Live Chat                         Live Chat                        Live Chat

                    100 Images                       100 Images                         100 Images                        100 Images                       100 Images

                    Part-Ex Guide                    Part-Ex Guide                      Part-Ex Guide                     Part-Ex Guide                    Part-Ex Guide

                    Dealer Reviews                   Dealer Reviews                     Dealer Reviews                    Dealer Reviews                   Dealer Reviews

Relative prices between                             Starter                            Basic                          Standard                          Advanced
package levels:                                      + 16%                             + 19%                            + 20%                             + 27%

                                                                                                                                                                                       28
Notes

        29
Notes

        30
You can also read