ACCELERATING ORPHAN DRUG DEVELOPMENT - JANUARY 2021 - Investor ...
←
→
Page content transcription
If your browser does not render page correctly, please read the page content below

ACCELERATING ORPHAN DRUG
      DEVELOPMENT
       JANUARY 2021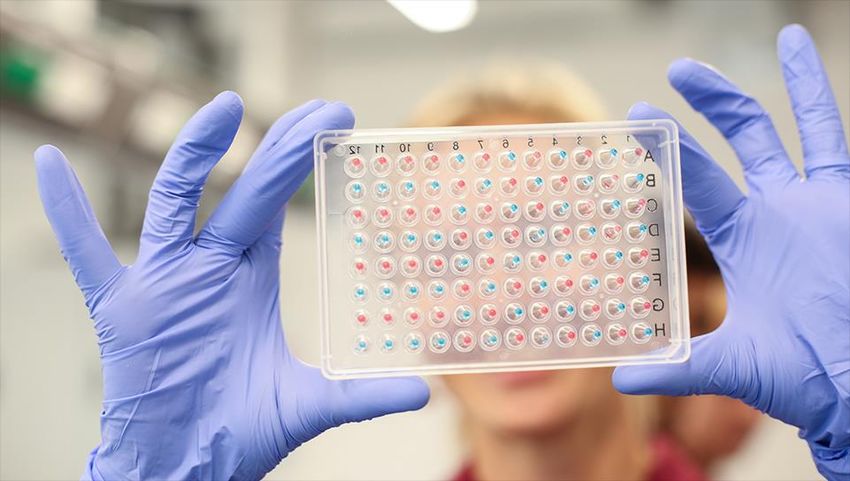
Important Notice and Disclaimer
This presentation has been prepared by Centogene N.V. (the “Company”), is made for informational purposes only and does not constitute an offer to sell or a solicitation of an offer to buy securities, nor
shall there be any sale of any of securities in any state or jurisdiction in which such offer, solicitation or sale would be unlawful prior to registration or qualification under the securities laws of any such state
or jurisdiction. The information set forth herein does not purport to be complete or to contain all of the information you may desire. Statements contained herein are made as of the date of this presentation
unless stated otherwise, and neither the delivery of this presentation at any time, nor any sale of securities, shall under any circumstances create an implication that the information contained herein is
correct as of any time after such date or that information will be updated or revised to reflect information that subsequently becomes available or changes occurring after the date hereof.

This presentation contains statements that constitute “forward-looking statements” as that term is defined in the United States Private Securities Litigation Reform Act of 1995, including statements that
express the Company’s opinions, expectations, beliefs, plans, objectives, assumptions or projections regarding future events or future results, in contrast with statements that reflect historical facts. Examples
include discussion of our strategies, financing plans, growth opportunities and market growth. In some cases, you can identify such forward-looking statements by terminology, such as “anticipate,” “intend,”
“believe,” “estimate,” “plan,” “seek,” “project” or “expect,” “may,” “will,” “would,” “could” or “should,” the negative of these terms or similar expressions. Forward-looking statements are based on
management’s current beliefs and assumptions and on information currently available to the Company. However, these forward-looking statements are not a guarantee of our performance, and you should
not place undue reliance on such statements. Forward-looking statements are subject to many risks, uncertainties and other variable circumstances, such as negative worldwide economic conditions and
ongoing instability and volatility in the worldwide financial markets, the effects of the COVID-19 pandemic on our business and results of operations, possible changes in current and proposed legislation,
regulations and governmental policies, pressures from increasing competition and consolidation in our industry, the expense and uncertainty of regulatory approval, including from the U.S. Food and Drug
Administration, our reliance on third parties and collaboration partners, including our ability to manage growth and enter into new client relationships, our dependency on the rare disease industry, our
ability to manage international expansion, our reliance on key personnel, our reliance on intellectual property protection, fluctuations of our operating results due to the effect of exchange rates or other
factors. Such risks and uncertainties may cause the statements to be inaccurate and readers are cautioned not to place undue reliance on such statements. Many of these risks are outside of the Company’s
control and could cause its actual results to differ materially from those it thought would occur. The forward-looking statements included in this presentation are made only as of the date hereof. The
Company does not undertake, and specifically declines, any obligation to update any such statements or to publicly announce the results of any revisions to any such statements to reflect future events or
developments, except as required by law.

Certain information contained in this presentation relates to or is based on studies, publications, surveys and other data obtained from third-party sources and the Company's own internal estimates and
research. While the Company believes these third-party sources to be reliable as of the date of this presentation, it has not independently verified, and makes no representation as to the adequacy, fairness,
accuracy or completeness of, any information obtained from third-party sources. In addition, all of the market data included in this presentation involves a number of assumptions and limitations, and there
can be no guarantee as to the accuracy or reliability of such assumptions. Finally, while the Company believes its own internal research is reliable, such research has not been verified by any independent
source.

For further information, please refer to the Risk Factors section in our Annual Report for the year ended December 31, 2019 on Form 20-F filed with the SEC on April 23, 2020, form 6-K containing our
financial results for the three and nine months ended September 30, 2020, filed with the SEC on December 16, 2020 and other current reports and documents filed with the U.S. Securities and Exchange
Commission (SEC). You may get these documents by visiting EDGAR on the SEC website at www.sec.gov.
Our goal

        “Providing precise medical diagnosis of inherited
         rare diseases at the earliest possible moment;
         transforming medical expertise and analytical
       information into actionable results for physicians,
            patients, and pharmaceutical partners.”

                                                             3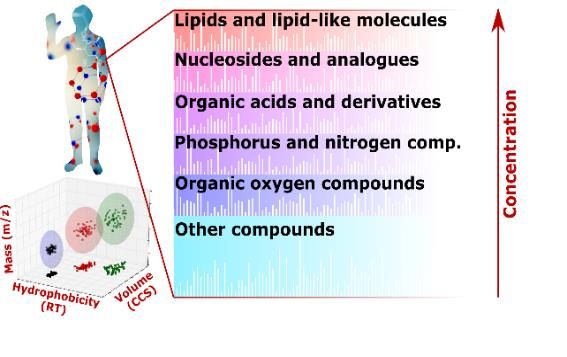
CENTOGENE: Rare disease company with two distinct business segments
                                                      Two business segments
                Company Snapshot                          Rare Disease Space

   • Founded in 2006 in Rostock, Germany with
     other locations in Cambridge and Berlin              Pharma partnerships
                                                    35+ partnerships with biopharma
   • Listed on NASDAQ in Nov 2019 (Ticker:          partners across 30+ disease areas
     CNTG)

   • 500+ employees with annual revenue of €49              Clinical Diagnostics
     million in 2019, with anticipated 2020 FY       Multi-omic data and bio-samples
     revenue over €100 million                   collected from 33,000+ physicians across
                                                               120+ countries

                                                                                            4
Significant unmet need in rare disease space

                                  5,600 identified              Only ~230 FDA         5-7 years on              30% of rare
                                  rare hereditary                  approved            average to            disease patients
                                     diseases                   treatments for          diagnose             will not see their
                                                                 rare diseases                                 5th birthday

                                                          Rare disease drug sales expected to be >$240B by 2024
                                             Revolutionizing services to the orphan drug market through the integration of
                                               diagnostic testing, informatics, biomarkers and interpretation of big data

Source: National Organization for Rare Disorders (NORD)

                                                                                                                                  5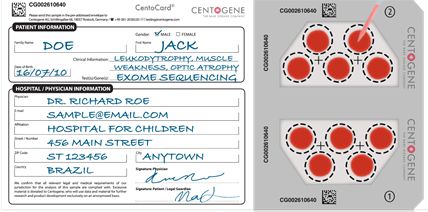
Pharma
Value creation through CENTOGENE’s platform

    Value for Biopharma Industry                                       Value for Patients
    Biomarker        • Developing biomarkers for high throughput       Early        • Expedited treatment through
    Development        patient testing and providing the ability to    Diagnosis      early diagnosis
                       monitor patients
                     • Support in monitoring progression of disease
                       and demonstrating efficacy for potential
                       therapies

    Development                                                        Access to    • Connecting patients and
                     • Expedited drug screening during discovery
    Acceleration                                                       Therapies      physicians to currently available
                     • Leverage existing CentoMD database &
                       repository to identify patients and aid study                  and future therapies
                       enrollment

    Patient                                                            Personalized • Ability to monitor patient’s
                     • Utilize sponsored genetic testing or
    Identification                                                     Medicine       disease state, allowing for
                       biomarker to accelerate patient
                       identification to increase commercial                          individualized dosing and optimal
                       adoption                                                       patient outcome

                                                                                                                                   6
Pharma
Key Pharma partnership examples

           Drug Discovery           Clinical Development       Commercialization

     • Data access and research    • Help with trial design   • Assist in diagnosis of
       collaboration                 and patient enrollment     patients with lysosomal
                                                                storage disorder
     • Potential discovery and     • Shorter development
       validation of novel           timeline through         • High throughput testing
       targets for new therapies     patient enrollment         via proprietary
       in rare diseases              acceleration (LRRK-2       biomarkers
                                     Parkinson’s disease)

                                                                                                   7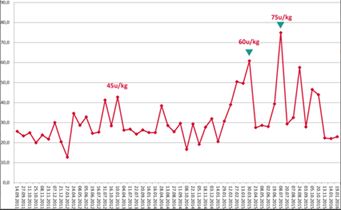
Pharma
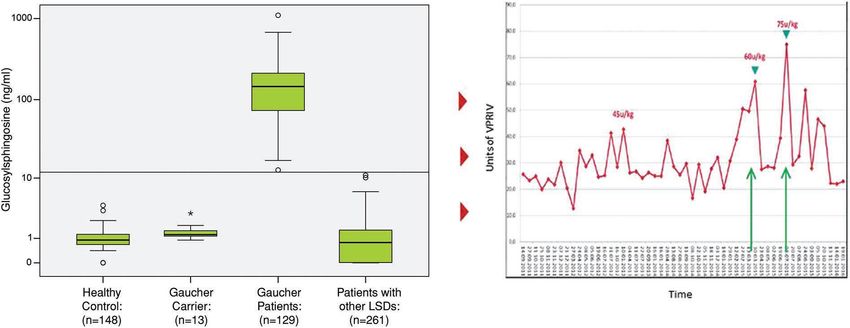
Case Study: Lyso-Gb1 biomarker in Gaucher Disease
High sensitivity and specificity for diagnosis and monitoring of Gaucher disease
Level of Biomarker
Disease manifestation threshold
Therapeutic
Window
Time
Easier patient identification
Ability to monitor disease
100% sensitivity and 99.9%
Potential to demonstrate drug
specificity of biomarker leading to
efficacy and guide individualized
100% accuracy in patient
treatment
identification*
*Based on the combination of biomarker and genetic confirmatory test and on the definition of the cut-off of 12ng/ml Lyso-Gb1
Source: Rolfs et. al 2013 8
Pharma
Depth and uniqueness in addressing unmet needs in the rare disease space

 Number of patients in Repository
                                                                  • Focused on rare disease patients
                                                      Enriched      with diverse ethnic background
                                                      database      from over 120 countries

                                                     HPO: Human   • Well-structured and standardized
                                                      phenotype     clinical information
                                           595,500     ontology
                                 498,756
                       364,966
             282,694                                              • Genetic, proteomic and
   177,294                                           Multi-Omic     metabolomic information

     2016     2017      2018        2019   Q3 2020
                                            YTD

                                                                                                           9
Comprehensive suite of diagnostic solutions from one sample
Diagnostics
Biochemistry Testing
1
✓ Biomarker Analysis
✓ Enzyme activity
Exomes/Genomes CNVs + Mutation quantification
✓ CentoXome® ✓ Genome wide aCGH – CentoArray Cyto™
✓ CentoGenome® ✓ MLPA (~600)
✓ qPCR + ddPCR (~850)
✓ FLA/RPA (25)
NGS Panels Testing
✓ Rare and Hereditary disease Panels CentoScreen®
✓ Sanger, Del/Dup, CNV
✓ Carrier Screening Panel - CentoScreen®
✓ Hereditary cancer panels
(331 autosomal and X-linked recessive
(CentoCancer®, CentoBreast®)
disorders, CNV, SMN1, FMR1 & CYP21A2)
✓ Somatic Oncogenetics
✓ Biochemical Genetics Panels (Enzyme)
Single Gene Sequencing
CentoNIPT®
✓ Sanger
✓ NGS ✓ Non-Invasive-Prenatal - CentoNIPT®
(T21, T18, T13, gender)
Up to December 30, 2020
10CentoCard – a simple logistic & storage solution
Diagnostics
✓ CE-marked
✓ Stable for 10+ years
✓ Ship via regular mail
✓ Available in 30+ languages
✓ Barcode for tracking
✓ Simple, efficient storage
✓ Contains consent to retest
biomaterial
Allows for global market coverage
11Continued expansion of platform and repository
Diagnostics
Diagnostic Segment – Primary Test Products (9M 2020) Source Patient Data by Geography Source Patient Data by Therapeutic Area
Cardiological Vascular, 1%
Opthalmological, and lung, 2%
3% Ear, nose and
NIPT & Biochemical NAMER, 3% APAC, 3% throat, 1%
Standard Liver, kidney and
testing, 21% Reproductive,
Genetics, Europe, endocrinological,
34% LATAM, 1%
17% 51% 5%
Whole Bone, skin,
Genome immune, 6%
Sequencing
, 4% Tumoral, 6%
Metabolic,
41%
Whole Malformation and
retardation, 11%
Exome
Sequencing
MENA, 26%
Panel
sequencing,
Neurological, 22%
12Objectives to drive Pharma growth over the next 12-24 months
Research stage Development stage Commercial stage
• Engage with 2 or more • Add 2 or more large scale • Develop 3 or more
Pharma partners in data epidemiology studies (> partners into a large
access and collaboration 1,000 subjects) volume sponsored
agreement genetic testing (> 2,000
• Demonstrate impact on test per year)
• Generate 3 or more actual trial timeline (e.g.,
discovery / biomarker % of referrals in actual • Add 5 or more new
validation partnerships study enrollment) partners to sponsored
testing programs
Achieving these goals would support growth of the Pharma segment at 20%-30% rate
13Pharma partnership total addressable market (TAM) has potential to grow to $3 billion
in size
Top-down market potential estimate for Pharma Bottom-up market potential
partnerships in rare disease industry estimate
Improving R&D Potential annual fee
R&D Spend $ 3M
productivity per partnership*
20% of $170B rare Ability to
disease drug sales 5% shorten R&D # of potential
$34B 3-4
partners per disease
in 2021 timeline $3B
# of hereditary rare
Marketing & Sales Reduction of 5,600
diseases
Spend commercial spend
% of rare diseases
14% of Ability to 5%
targeted
$170B rare identify new
$24B disease drug
5% patients with
sales in 2021 fewer sales
calls $ 3B
Source: Global Orphan Drug Clinical Trials, Patent & Guidelines Insight 2026, PNS Pharma
* Average annual fee per disease state from key Pharma partnerships 14Leveraging our expertise for commercial COVID-19 testing
Monthly airport test volume – 2020 Commercial COVID-19 testing offering
• Leveraged our expertise to offer commercial COVID-19
145,905 testing to support society navigate the global pandemic
139,485
• Airport test centers showed strong growth in particular
at test centers in Germany’s largest airports: Berlin
Brandenburg, Dusseldorf, Hamburg, and Frankfurt
airports
• PCR test results delivered via mobile app within 24 hours
• Added rapid antigen testing to complement our offering
40,816 and suit travelers’ needs
301
June July August September
15Financial information: full-year performance
Revenues by Segment – Full Year Segment Adjusted EBITDA* Margin– Full Year
(€ Millions)
Growth (%)
79%
48.8 21%
69%
40.5
21.5 24%
17.3
27.3 18%
23.2
10% 8%
FY 2018 FY 2019 FY 2018 FY 2019
Diagnostics Pharma Diagnostics Pharma
*for reconciliation of segment adjusted EBITDA to group loss, please refer to the Appendix 16Year-to-date revenues growth rate of 73%
Revenues by Segment – 9M Segment Adjusted EBITDA* Margin – 9M
(€ Millions)
Growth (%)
71%
58.1 73%
43%
29.5 N/A
35%
33.6
13.5
12.3 -9%
0% N/A
20.0
16.3 -19%
-17%
9M 2019 9M 2020 9M 2019 9M 2020
Diagnostics Pharma COVID-19 Diagnostics Pharma COVID-19
*for reconciliation of segment adjusted EBITDA to group loss, please refer to the Appendix 17Income statement*
€ Thousands
For the three months For the nine months
ended September 30, ended September 30,
2019 2020 2019 2020
Revenues 11,638 36,305 33,559 58,129
Cost of sales 6,641 26,059 19,499 39,892
Gross profit 4,997 10,246 14,060 18,237
Research and development expenses 2,011 4,796 6,119 10,606
General administrative expenses 4,884 8,373 16,487 24,038
Selling expenses 1,788 1,300 6,144 6,012
Impairment of financial assets 92 1,147 554 2,821
Other operating income 935 679 2,623 2,425
Other operating expenses - 53 2 191
Real estate transfer tax expenses - - 1,200 -
Operating result (2,843) (4,744) (13,823) (23,006)
* Selected information 18Cash flow & balance sheet*
For the nine months For the nine months Period over
ended Sept 30, 2019 ended Sept 30, 2020 period change
€ Millions € Millions
Cash flow (used in) operating activities (3.5) (19.7) (16.2)
Key Items Cash flow from/(used in) investing activities 13.5 (11.0) (24.5)
Cash flow from/(used in) financing activities (13.2) 18.4 31.6
As of June 30, 2020 As of Sept 30, 2020 Period over period
€ Millions € Millions change
Cash & cash equivalents 17.4 28.8 11.4
Key Items Debt outstanding** 27.0 26.5 (0.5)
Net debt / (net cash) 9.6 (2.3) 11.9
* Selected information
** Debt outstanding includes non-current loans, non-current lease liabilities, current loans and current lease liabilities.
19Investment thesis for CNTG
Solution for Rare • Leading position in the Rare Disease space to help Pharma
Disease Space partners identify patients and develop treatments faster
• Clinical Diagnostics segment will continue to provide a stable
Stable diagnostics
revenue base revenue base, while expanding CENTOGENE‘s patient
repository
• Financial contributions from commercial COVID-19 testing will
COVID-19 testing allow for key strategic investments to be better positioned for
future success
• Well positioned to return to strong topline growth driven by
Pharma driven
the Pharma segment in 2021
growth
20APPENDIX
21CentoMD 5.5 Comparison with HGMD and ClinVar
Total Genetic Variants
12,000,000
10,000,000
8,000,000
6,000,000
4,000,000
2,000,000
0
CentoMD 5.5 HGMD Pro ClinVar
2019.1 2019.09.16
N= 32,125 Shared Variants
13% Discordantly classified
N= 159,149 Shared Variants
9% Discordantly classified
Based on the variants in CentoMD 5.5 (released in September 2019), a comparison against the list of variants in other industry
databases such as ClinVar (version ClinVar 2019, September 2019) and HGMD Pro (version HGMD Pro 2019.1, January 2019) shows
that of the shared variants among CentoMD 5.5, ClinVar and HGMD Pro, approximately 9% and approximately 13% of such shared
variants in ClinVar and HGMD Pro, respectively, are discordantly classified.
22New extensive biomarker approach
SINGLE BIOMARKERS COMBINATION BIOMARKERS PATTERN REFERENCE METABOLOME
• 2-10 Biomarkers,
• Lyso-GB1 – like (highly • Pattern of complete
combination results in • Qualitative &
specific) measurement
increase of specificity Quantitative
• Patient finding, for certain diseases • Aims to direct characterization of
diagnostics and diagnostics & increase metabolomics features
• Diagnostics and patient
monitoring of patients diagnostic yield
finding
Lyso-Gb1 SM-465 & SM-509 Hyaline Fibromatosis Heatmap Human Reference Metabolome
N M 4 6 5 N M 5 0 9
2 0 4 8 1 4
1 0 2 4
1 2
5 1 2
1 0
r a tio to in te rn a l s ta n d a rd
n g /m L b lo o d
2 5 6
8
1 2 8
6
6 4
4
3 2
2
1 6
8 0
N P A /B p a tie n ts N P C P a tie n ts C o n tro ls N P A /B p a tie n ts N P C P a tie n ts C o n tro ls
COHORT NM-465 NM-509
SMPD1
NPC1/2 ✓
Control ✓ ✓
181 compounds
Biomarker = molecule, n Biomarkers for 1 disease or/and test
23Reconciliation of segment adjusted EBITDA to Group loss for the period
€ Thousands
For the years
ended December 31,
2018 2019
Reported segment adjusted EBITDA 15,926 17,262
Corporate expenses (15,836) (22,949)
90 (5,687)
Share-based payment expenses (5,521) (6,418)
Depreciation and amortization (5,175) (6,579)
Operating loss (10,606) (18,684)
Financial costs, net (1,042) (2,013)
Income tax benefits/(expenses) 310 (158)
Loss for the period (11,338) (20,855)
24Reconciliation of segment adjusted EBITDA to Group loss for the period
€ Thousands
For the three months
ended September 30,
2019 2020
Reported segment adjusted EBITDA 4,157 9,177
Corporate expenses (4,917) (10,261)
(760) (1,084)
Share-based payment expenses (471) (1,149)
Depreciation and amortization (1,612) (2,511)
Operating loss (2,843) (4,744)
Financial costs, net (1,433) (793)
Income tax expenses - (103)
Loss for the period (4,276) (5,640)
25You can also read