House of Fraser Investor Presentation
←
→
Page content transcription
If your browser does not render page correctly, please read the page content below

House of Fraser
   Investor Presentation
         6 June 2018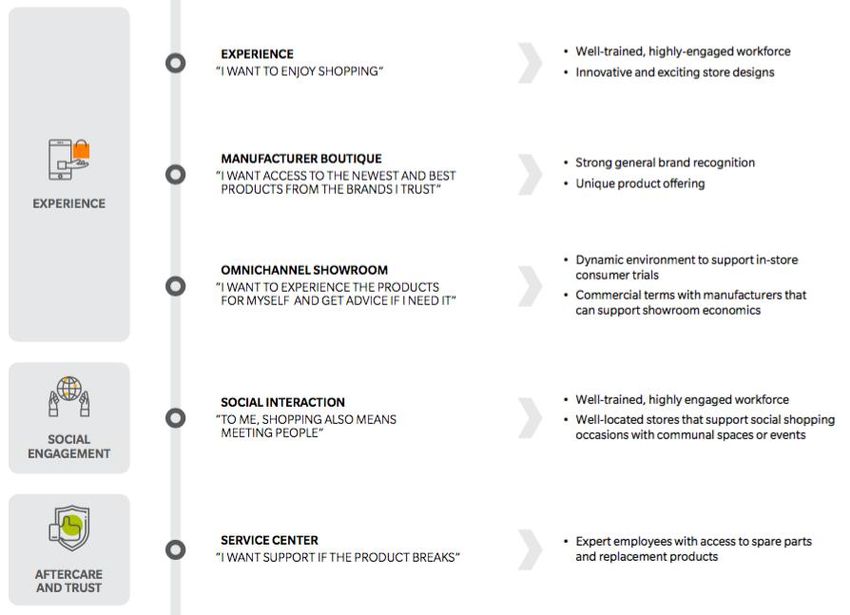
Disclaimer

IMPORTANT NOTICE: This Disclaimer contains important information concerning the nature and scope of the
information and statements appearing in this presentation, the audience for which it is intended, and the use
which may be made of it.
This presentation (“Presentation”) contains information that has been prepared by House of Fraser Funding Plc (the “Company”) for information purposes only.
The information and opinions contained in this Presentation (including, without limitation, any forward-looking statements) are provided as at the earlier of: (i) the
date of this Presentation; and (ii) any other date on which they are stated to be given, and are subject to change without notice. Save as required by law, neither
the Company, nor any of its affiliates (collectively, the “Group”) intends, or undertakes any obligation, to update any information or opinions contained in this
Presentation going forward, to correct any inaccuracies which may become apparent or to provide any further information relating to the future performance of
the Group. Recipients (including current and prospective holders of the Company’s £175,000,000 Floating Rate Senior Secured Notes due 2020 (the “Notes”)) are
cautioned not to place undue reliance on this Presentation or the information or opinions contained herein.
No representation, warranty or undertaking, express or implied, is made by any Group company or any of its affiliates or any of its or its affiliates’ respective
members, directors, officers or employees as to, and no reliance should be placed on, the accuracy, fairness or completeness of the information or the opinions
contained in this Presentation. The contents of this Presentation have not been independently verified by or on behalf of the Group or its advisers, or by any other
independent third party. This Presentation contains a brief overview of solely the matters to which it relates and does not purport to provide an exhaustive
summary of all relevant issues.
This Presentation does not constitute financial product, investment, tax, accounting or legal advice, a recommendation to invest in any securities of any Group
company, or any other person, or an invitation or an inducement to engage in investment activity with any person. This Presentation has been prepared without
taking into account the objectives, financial situation or needs of any particular recipient of this Presentation, and consequently the information and opinions
contained in this Presentation may not be sufficient or appropriate for the purpose for which a recipient might use it. Any such recipients should conduct their own
due diligence, consider the appropriateness of the information and opinions in this Presentation having regard to their own objectives, financial situation and
needs, and seek financial, legal, accounting and tax advice appropriate to their particular circumstances.
This Presentation does not constitute an offer to sell or a solicitation of an offer to buy any securities of the Group or any other person in the United States or any
other jurisdiction. This Presentation is not directed at, or intended for distribution, publication, availability to or use by, any person or entity that is a citizen or
resident or located in any locality, state, country or other jurisdiction, where such distribution, publication, availability or use would be contrary to law or
regulation, or which would require any registration or licensing within such jurisdiction.
This disclaimer shall be governed exclusively by and construed in accordance with English law. If any provision of this disclaimer is held to be invalid or
unenforceable, then that provision shall be severed accordingly, and the remaining provisions shall continue to be valid and enforceable.
                                                                                                                                                                            2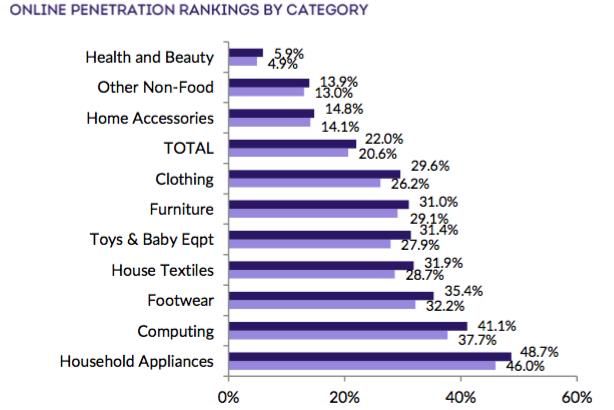
Contents

1.
1 Preliminary FY17 results and update on current trading

2.
2 Background to Transformation Plan

3.
3 Overview of the Transformation Plan

4.
4 Overview of the Transaction

                                                           3
01
     Preliminary FY17
     results and update
     on current trading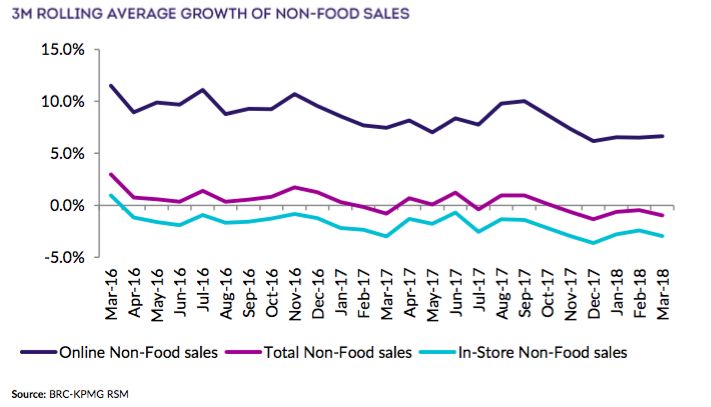
Unaudited preliminary results for FY17 – P&L

                 As disclosed on 24th April 2018, detailed audited accounts are to follow post completion of the transaction

House of Fraser (UK & Ireland) Limited                  Unaudited                                Commentary
£ millions                               28-Jan-17     27-Jan-18
                                                                      • Results reflect the changing nature of the UK retail market
Gross transaction value                     1,310.5      1,233.6        including changing consumption and buying patterns. Examples
                                                                        include:
Turnover                                     836.3         779.8
                                                                             • Increasing move towards ecommerce rather than buying in
Cost of sales                                (353.2)      (334.2)              store
                                                                             • Increasing focus from consumers on promotional activity
Gross Profit                                 483.1         445.6               before making purchase decision
Distribution costs                           (359.9)      (375.1)
                                                                      • Uncertainty around Brexit has acted as an accelerating factor,
Administrative expenses                       (94.7)        (84.3)      speeding up structural changes required to the retail market:
                                                                            • Market is currently too property heavy, with many of the
Other income                                    3.3          33.6
                                                                              properties under-invested
Operating profit                               31.8          19.8           • Economic centre of gravity of many towns has changed,
                                                                              with many retail properties no longer in the main areas of
D&A (including impairments)                    38.3          38.9             activity
EBITDA                                         70.1          58.7
                                                                      • Our margin has also been impacted by Brexit related currency
Exceptional items                              (6.5)        (23.3)      effects which have impacted input prices
Adjusted EBITDA                                63.6          35.4
                                                                      • Further cost pressures due to national living wage, increases in
                                                                        business rates, rent increases and increases in utility prices

                                                                      • Exceptional items includes £25m sale of house brands to
                                                                        Guangzhou Sunrise Trading Limited
                                                                                                                                           5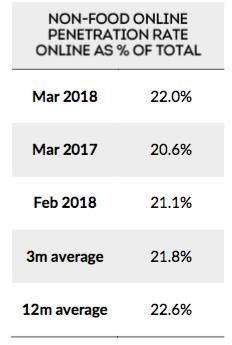
Unaudited preliminary results for FY17 – cash flow

                 As disclosed on 24th April 2018, detailed audited accounts are to follow post completion of the transaction

House of Fraser (UK & Ireland) Limited                  Unaudited                                Commentary
£ millions                               28-Jan-17     27-Jan-18
                                                                      • Underlying movements in operating working capital moves in-line
Operating profit                               31.8          19.8       with underlying sales patterns of the group
D&A (including impairments)                    38.3          38.9           • Consistent trade payables days and trade receivables days
                                                                              over the last three years
Change in inventories                         (11.9)         13.9
                                                                      • FY-17 increase in other receivables driven by £25m income
Change in receivables                          (3.6)        (25.3)      recognised for brand sales in January (receipt of cash in March)
Change in payables                            (18.3)        (26.6)    • Other working capital largely consistent with prior years, with
                                                                        limited fluctuations
Change in provisions                          (16.5)         (7.4)
Operating cash flow                            19.8          13.3
                                                                      • Capital expenditure of £57.3m in year to Jan-18 compared to
Net interest payments                         (15.9)        (18.7)      £45.1m in year to Jan-17 driven partly by timing, with run-rate
                                                                        capex for the last two years of c.£50m
Capital expenditure                           (45.1)        (57.3)
                                                                            • Higher than historical capex levels of c.£30m due to on
Debt repayments                               (11.3)         (2.8)            going catch up store refurbishments and ecommerce and
Net cash flow                                (52.5)        (65.5)             warehouse investments

                                                                      • Lower debt repayments in FY17 reflective of the bond repurchase
Opening cash                                 125.4           72.9       in FY16
Closing cash                                   72.9           7.4

                                                                                                                                           6
Update on current trading
(Preliminary unaudited Q1 results)

Operational highlights for the 13 weeks to 28th April 2018

• Q1 Fiscal Year 2019 witnessed a difficult trading environment across the entire UK retail industry, driven by lower consumer
  confidence, channel shift online and unusually cold weather during February and March

• LFL sales decreased by 7.4% compared to prior year, while turnover decreased 7.7%

• Gross profit of £75.4m is £14.6m lower than Q1 Fiscal Year 2018

• Gross margin of 32.8% decreased by 350bps compared to margin of 36.3% last year

• In what is seasonally the lowest trading quarter, negative EBITDA for the quarter widened year on year to (£31.4m), driven primarily by
  the decline in total sales

• Net increase in cash for the quarter was £2.0m compared to a £62.5m decrease in cash in Q1 of Fiscal Year 2018

• As announced in the 2 May announcement, the group has received £25m support from shareholders to fund the business in the lead
  up to the transaction

• An additional £5m has been received following the announcement from shareholders (with a further £5m to be received in June) and
  the group has also agreed a £10m short term overdraft facility with its banks

                                                                                                                                        7
02
Background to
Transformation
Plan2 ½ years of negative growth for retailers in UK
physical stores
Traditional retailers have been hit by declining physical store performance and challenges of adjusting to
digital growth
9Online growth is most rapid in our key categories
Growth will be driven by digital sales of sweet-spot categories. Digital penetration low enough to justify
physical stores.
10Immediate short-term challenges have created
significant stress on the business
A perfect storm of circumstances has seen top lines get squeezed and costs rise
Changing market Consumer confidence Project execution Leverage
Falling footfall in stores, the Brexit led a GDP reduction Moving our leading Total credit facilities of
rise and rise of pureplay and in 2017, a devaluation of the ecommerce business onto a £390m against run rate
retailers over-feeding pound from pre-Brexit new platform, changing the EBITDA and Q4-dominated
discounting has seen levels which in turn has pricing of our house brands cash cycles has placed
‘traditional’ retail businesses driven inflation up beyond and reducing the number of stress on working capital in
come under extreme stress. target levels and seen the womenswear private label Q1 – Q3 2018
BoE nudge interest rates up brands hit sales hard
Planned action
1. Become the antidote to the 1. Build a brand proposition 1. Build the right team at every 1. Trade the business properly
issues of the high street based on our extraordinary level to maximise cash generation
DNA
2. Target the market gaps in 2. Focus on a believable and 2. De-lever HoF to allow
Luxury, Premium 2. Focus on being a fabulous flexible plan that moves at transformation
retailer not a landlord pace
1103
Overview of the
Transformation
PlanOverview of the Transformation Plan
1• Create a smaller, higher-quality and more focussed store estate
• Store rationalisation and cost reduction programme to compromise certain of the leasehold liabilities of the
Group to be implemented via Company Voluntary Arrangements (“CVA”) or otherwise, (the “Restructuring Plan”)
• Reduced rent expense will reduce fixed costs, allowing for a more flexible cost base going forward – expected
annual cost savings of greater than £20m
• Pro-forma for the transaction, House of Fraser’s Gross Transaction Value would have been approximately 30%
lower in year ending Jan-18 (resulting in a GTV mix of c.70% in-store and c.30% web sales)
• Adjusted EBITDA as a percentage of GTV would have been two to three percentage points higher in the
year ending Jan-18
• Due to the smaller footprint, outflow for inventory pro-forma for the CVA would have been c.40% lower
2• Refocus towards concessions and own bought brands, driving a more premium in-store and online offering
• Higher concentration of premium brands creates a positive feedback effect, as House of Fraser becomes “the
house of brands”
• Received positive feedback from brand partners on plan
3• Become an eCommerce led retailer offering a seamless multi-channel proposition and integration between in-store
and online customer experience
13The market opportunity
Disposable income
UK disposable income by quintile Forecast growth in disposable income
• UK Disposable income now exceeds
pre-crisis levels
• Rate of growth has been highest for
those with the highest disposable
income
• Disposable income is forecast to
continue growing
UK luxury market
UK luxury market growth rates Forecast UK luxury market growth rates
• The total value of the UK luxury
retail market has grown by >60%
over the last 5 years
• The growth rate in the UK luxury
market is significantly greater than
the UK average
14Balanced portfolio focused on premium and luxury
multi-channel
The scale multi-channel premium & luxury department store group that becomes eCommerce led over
3 years
Digital Marketplace
Luxury & Premium
Stores in affluent locations offering the
finest brands in ever evolving and
improving retail experience centres,
Stores in city & regional locations
carrying accessible premium branded
products coupled with outstanding
services and partnerships
Volume
Luxury
eCommerce
One exceptional online store with
increasing levels of personalisation,
market place credentials delivered
seamlessly alongside in-store
Physical stores
15E-Commerce Roadmap 2018-2020 gets us
‘there’ first
Invest in House of Fraser brand to regain ‘Trademark’ strength across ecommerce marketing channels
2018 2019 and 2020
Focus on enhancing search and Personalisation Phase 2 Tailor Drive growth internationally
merchandising capabilities of experience to customers through translation and multi-
Hybris engine currency functionality
Develop loyalty schemes to offer
Start journey to create a single comprehensive experience e.g Mirror navigation of non-retail
customer view experiences to drive Gen 2.0 of
• Delivery subscriptions
experience
• Store-Experience based rewards
Broaden product range to (makeovers/F&B offers)
enhance our brand offering (all Social proofing
categories) and cover category • Expert recommendations
gaps (e.g athleisure, home & Curate product recommendations
technology) to increase conversion and AOV • Peer-to-peer recommendations in
loyalty
• Enhance reviews and ratings
Use data and new technologies to deliver personal & relevant customer experiences across our multichannel estate creating:
‘The world’s most welcoming department store online and offline’
16Stores that are clear in their role and held accountable
Multi-channel led physical stores committed to their local customer base and the service they demand
17Mitigating the E-Commerce impacts of store closures
The following is the list of activities that are planned to mitigate the potential for any downside impacts on E-Commerce
performance through the store reduction activity:
A significant increase in ‘above the line’ marketing Targeted spend and activity across all channels to
spend to offset any potential loss of brand awareness support the introduction of new brands
and to drive growth.
Redeployment of local bloggers to drive traffic solely
Geo bid adjustments and targeted messages across all online
paid channels to increase online presence and
message relevance in store closure areas to offset any
drop in brand awareness.
Customer targeting to change messages for customers
in target geographies
Redirecting onsite equity to increase visibility and
traffic
Reinvestment and redirection to new brands
18Our product offer sees us with more newness than
anyone else
We have more brands than any other business. We are the high street antidote to retailers looking for low risk
high street footprints. We are and will be the house of brands.
Concessions
Own-bought Branded House Brands
>50% of sales. Has significant potential
>35% of sales. Growing across most >10% of current sales – challenging
as we become the most vibrant market
categories and a strength performance and needs refocusing
place
Extraordinary support and will to win from Brands in all categories
1904 Overview of the
TransactionOverview of the Transaction
1• New retail focussed majority owner
• C.banner (owner of Hamley’s toy store) to become 51% shareholder of House of Fraser Group
Limited (a parent company of House of Fraser UK & Ireland Limited)
• Opportunity to share best practice in buying, supply chain and customer engagement
2• Significant new investment in the group
• £70m new money to be available for the group to fund the Transformation Plan, working capital
and general corporate purposes
• New money as well as anticipated cash flow benefit from CVA will fully fund the business over the
Transformation Plan, with minimum available liquidity headroom of c.£40m across the plan
• The combination of the Transaction and the successful implementation of the Transformation Plan
will help the group delever to refinanceable levels prior to maturity of the bonds
3• Constructive discussions are on-going to obtain required approvals from our banks and lock up from
the requisite majority of bondholders for the Transaction
• This includes potential amendments to the maturity of the RCF and Term Loan as well as a re-
profiled covenant package with our banks (including institutions holding £26m that did not
participate in the latest extension)
4• Completion of the Transaction is conditional on the successful implementation of the Restructuring
Plan and other conditions
21Overview of the Transaction
Pre transaction Step 1 – share purchase Step 2 – share subscription
Nanjing Xingjiekou Nanjing Xingjiekou Nanjing Xingjiekou
Department Store Department Store Department Store
Co. Ltd (China) Co. Ltd (China) Co. Ltd (China)
100% 100% 100%
Cenbest Hong Kong C.banner Cenbest Hong Kong C.banner Cenbest Hong Kong
Company Limited International Company Limited International Company Limited
(HK) Holdings Limited (HK) Holdings Limited (HK)
34% 66% 51% 49%
100%
House of Fraser House of Fraser Key: House of Fraser
Group Limited (UK) Group Limited (UK) Group Limited (UK)
Transaction
100% 100% Companies 100%
West Coast Capital House of Fraser West Coast Capital House of Fraser West Coast Capital House of Fraser
(HOF CO) Limited Global Retail Limited (HOF CO) Limited Global Retail Limited (HOF CO) Limited Global Retail Limited
(UK) (UK) (UK) (UK) (UK) (UK)
11% 89% 11% 89% 11% 89%
House of Fraser (UK House of Fraser (UK House of Fraser (UK
& Ireland) Limited & Ireland) Limited & Ireland) Limited
(UK) (UK) (UK)
100% 100% 100%
House of Fraser (UK House of Fraser (UK House of Fraser (UK
House of Fraser 100% & Ireland) House of Fraser 100% & Ireland) House of Fraser 100% & Ireland)
(Funding) Plc Acquisitions Limited (Funding) Plc Acquisitions Limited (Funding) Plc Acquisitions Limited
(UK) (UK) (UK)
22House of Fraser
You can also read