INVESTOR PRESENTATION - SMARTCENTRES
←
→
Page content transcription
If your browser does not render page correctly, please read the page content below
Investor Presentation
     Based on Fourth Quarter 2016
            February 2017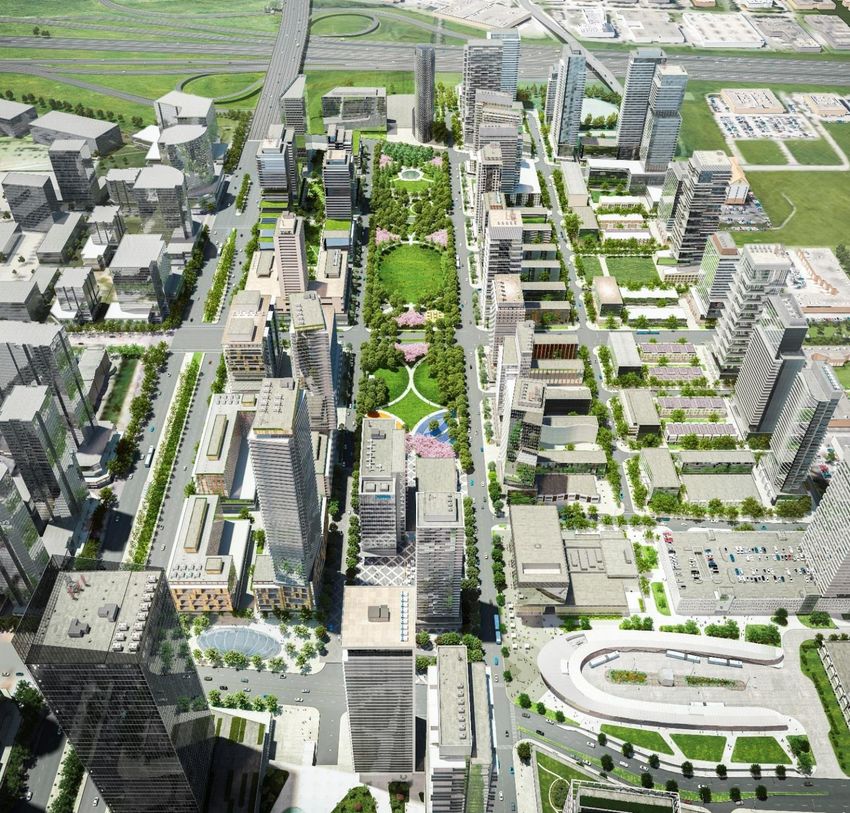
Notice to Reader

        Readers are cautioned that certain terms used in this Investor Presentation (“Presentation”) such as Funds from
        Operations ("FFO"), Adjusted Funds from Operations ("AFFO"), "Gross Book Value", "Payout Ratio", "Interest
        Coverage", "Total Debt to Adjusted EBITDA" and any related per Unit amounts used by management to measure,
        compare and explain the operating results and financial performance of the Trust do not have any standardized
        meaning prescribed under IFRS and, therefore, should not be construed as alternatives to net income or cash flow
        from operating activities calculated in accordance with IFRS. These terms are defined in this Presentation and
        reconciled to the consolidated financial information of the Trust in the Management’s Discussion and Analysis
        (“MD&A”) for the year ended December 31, 2016. Such terms do not have a standardized meaning prescribed by
        IFRS and may not be comparable to similarly titled measures presented by other publicly traded entities.

        Certain statements in this Presentation are "forward-looking statements" that reflect management's expectations
        regarding the Trust's future growth, results of operations, performance and business prospects and opportunities.
        More specifically, certain statements contained in this Presentation, including statements related to the Trust's
        maintenance of productive capacity, estimated future development plans and costs, view of term mortgage renewals
        including rates and upfinancing amounts, timing of future payments of obligations, intentions to secure additional
        financing and potential financing sources, and vacancy and leasing assumptions, and statements that contain words
        such as "could", "should", "can", "anticipate", "expect", "believe", "will", "may" and similar expressions and
        statements relating to matters that are not historical facts, constitute "forward-looking statements". These forward-
        looking statements are presented for the purpose of assisting the Trust's Unitholders and financial analysts in
        understanding the Trust's operating environment, and may not be appropriate for other purposes. Such forward-
        looking statements reflect management's current beliefs and are based on information currently available to
        management. However, such forward-looking statements involve significant risks and uncertainties. A number of
        factors could cause actual results to differ materially from the results discussed in the forward-looking statements.
        Although the forward-looking statements contained in this Presentation are based on what management believes to
        be reasonable assumptions, the Trust cannot assure investors that actual results will be consistent with these
        forward-looking statements. The forward-looking statements contained herein are expressly qualified in their entirety
        by this cautionary statement. These forward-looking statements are made as at the date of this Presentation and the
        Trust assumes no obligation to update or revise them to reflect new events or circumstances unless otherwise
        required by applicable securities legislation.

SMART REAL ESTATE INVESTMENT TRUST                                                                                              2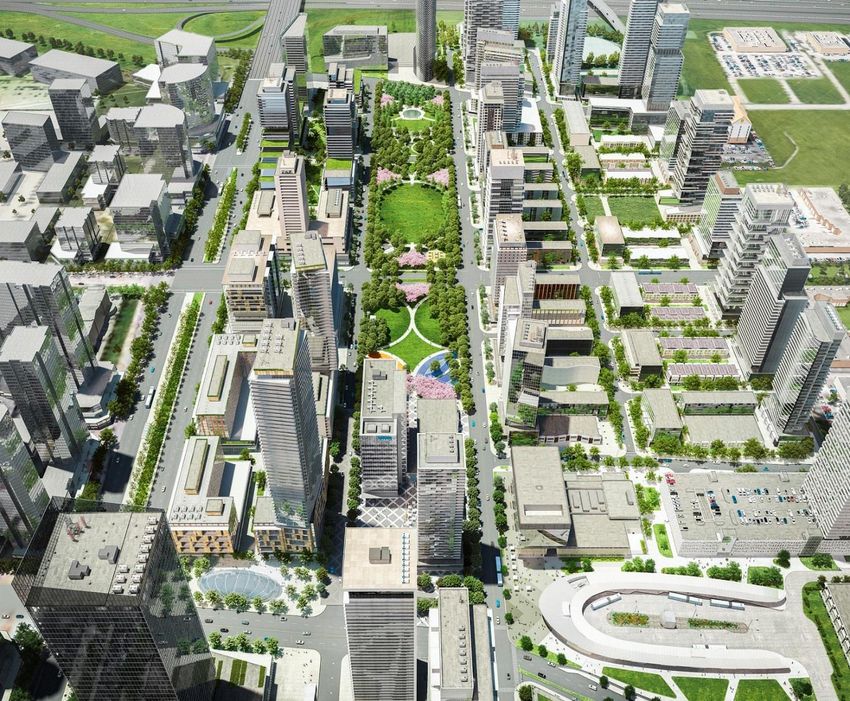
Smart Real Estate Investment Trust (TSX:SRU.UN)
One of Canada’s premier REITs
$5.1 billion equity capitalization
(unit price of $32.74 as of February 10, 2017)
$8.7 billion total asset value
142 shopping centres, 1 office property and 1
mixed-use property across Canada
SMART REAL ESTATE INVESTMENT TRUST 3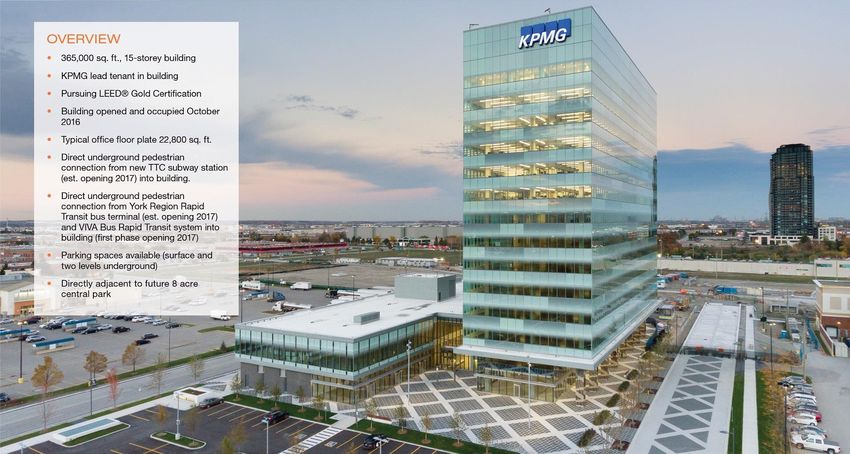
Track Record of Performance
Total Return to Unitholders
13.1% average annual return since IPO (as of
February 10, 2017)
$1,200
$1,000
$937.24
$800
$600
$418.61
$400
$361.38
$200
$0
SmartREIT TSX Capped REIT TSX Composite
SMART REAL ESTATE INVESTMENT TRUST 4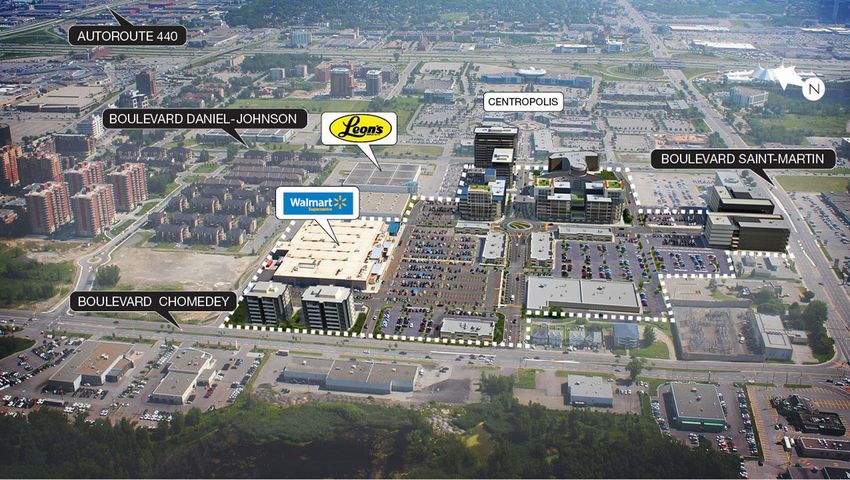
Track Record of Performance
Growth in Rental Revenue Growth in AFFO / Unit
7.3% CAGR since 2011 5.0% CAGR since 2011
Rental Revenue AFFO
(in millions of $) ($ per unit)
727.8
670.3 2.10
1.99
607.6 1.84
573.0 1.71 1.75
546.1 1.65
511.9
2011 2012 2013 2014 2015 2016 2011 2012 2013 2014 2015 2016
* YTD and remainder of year forecasted
SMART REAL ESTATE INVESTMENT TRUST 5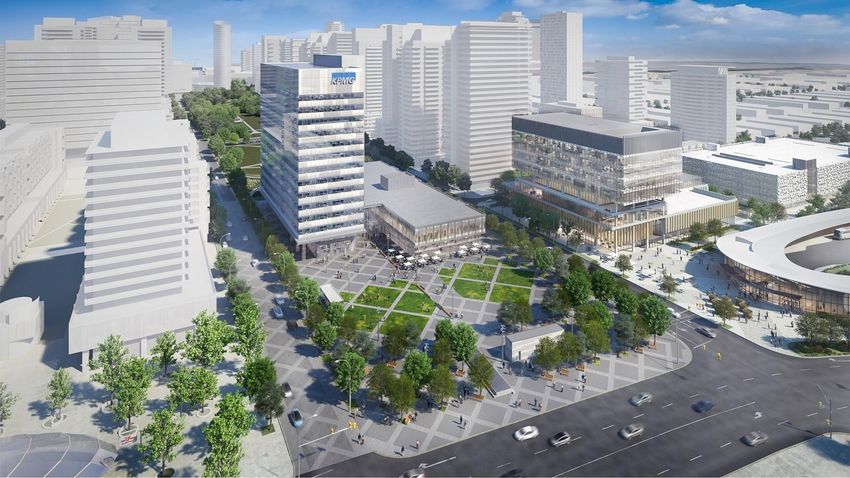
Track Record of Performance
Growth in Total Assets
36.8% CAGR since 2002
Total Assets
(in millions of $)
8,739
8,505
7,070 7,107
6,480
5,956
4,194 4,237 4,374
3,894
3,584
2,564
1,015
109 229
2002 2003 2004 2005 2006 2007 2008 2009 2010 2011 2012 2013 2014 2015 2016
SMART REAL ESTATE INVESTMENT TRUST 6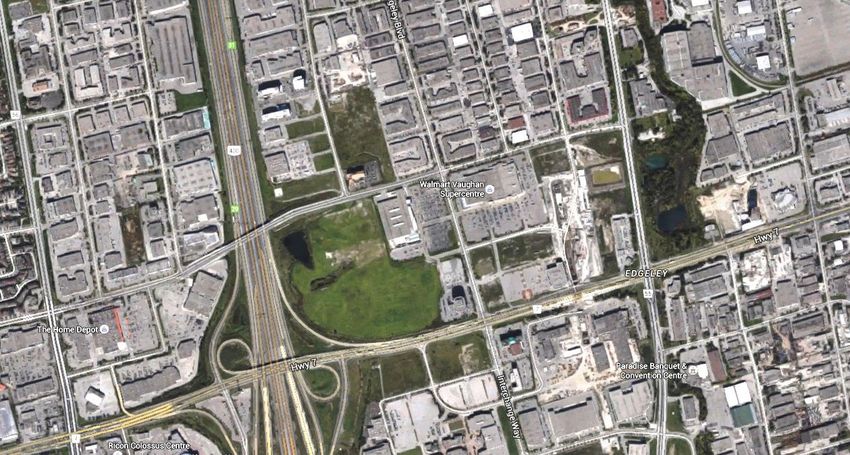
Key Investment Highlights
The quality of our shopping centre portfolio
Our exceptional list of growth initiatives
Our healthy balance sheet and financial
flexibility
The quality and depth of our development team
and JV relationships
SMART REAL ESTATE INVESTMENT TRUST 7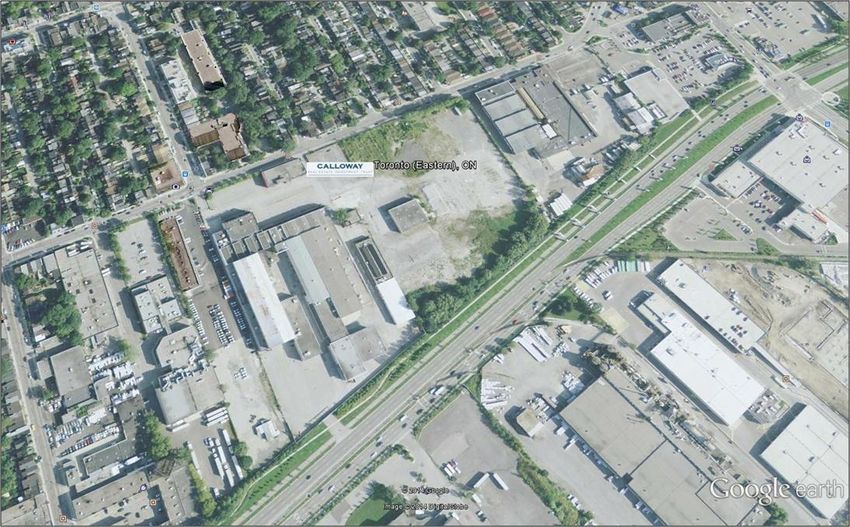
SmartREIT’s Retail Shopping Centre Portfolio
31.9 million square feet of principally open format shopping
centre space
Average age: 13.1 years (youngest in the industry)
Low capital expenditures
Coast to coast locations
84% are urban or near urban markets
82% by square feet in Ontario, Quebec and BC
Virtually 100% of sites contain both a food store and a
pharmacy, either in a Walmart store or independently
Strong value orientation
Results in high degree of stability:
Average occupancy of 99.0% since 2005
SMART REAL ESTATE INVESTMENT TRUST 8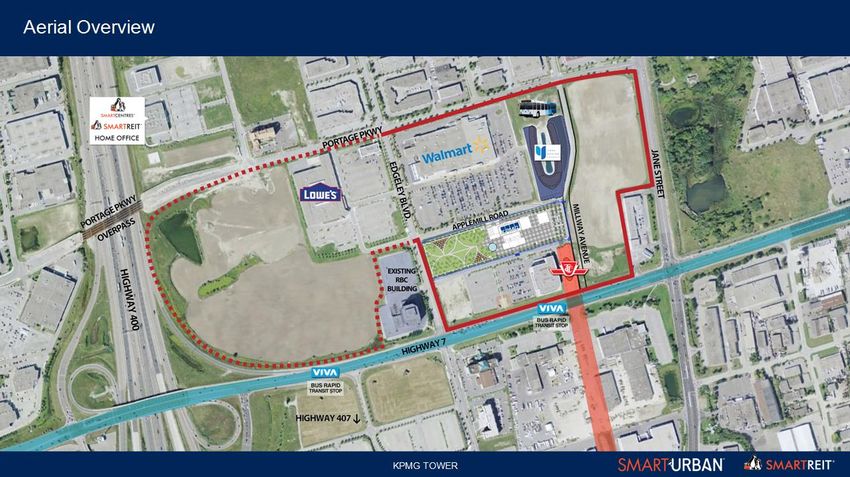
SmartREIT’s Portfolio

                                                                    144 Properties*
                                                                    31.9 million square feet*

                      Alberta                  Manitoba
                        8                         3

                                Saskatchewan                         Quebec
              BC                     4                                 21
              13                                                                     Atlantic

                                                          Ontario                      10

                                                            84

  * Excludes 8 development lands totalling 0.57 million square feet upon completion and an
    additional 3.56 million square feet of development density associated with existing centres

SMART REAL ESTATE INVESTMENT TRUST                                                                9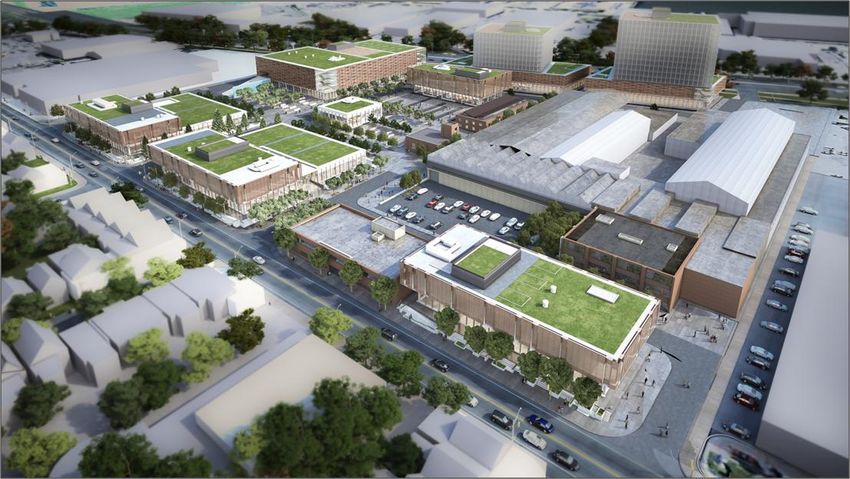
Stable Income Base
Average lease term of 6.2 years
Average remaining lease term of 7.8 years for Walmart, with multiple renewal options
of up to 80 years
Average remaining lease term excluding Walmart is 5.1 years
2016 retention rate of 81.2% and lifts on renewals of 4.0%
Average “same property” NOI growth is 1.0% to 1.5% p.a.
Lease Maturity by Area
(in millions of square feet)
2.5 3.1 3.4 3.5 3.7 2.6
2.0
1.3 1.4 1.4
0.5
0.3
2017 2018 2019 2020 2021 2022 2023 2024 2025 2026 Month- Vacant
to-month
Average roll of 2.3 million square feet annually (7.2% of total GLA per year)
SMART REAL ESTATE INVESTMENT TRUST 10Well Tenanted, High Quality Portfolio
The following table illustrates the top ten tenants for SmartREIT’s Property Portfolio as at
December 31, 2016, in terms of their percentage contribution to gross rental revenues of
SmartREIT’s Portfolio:
Average
% of Gross DBRS Credit
Tenant Number of Stores Remaining
Rental Revenues Rating
Lease Term
Walmart 95 26.3 7.8 AA
Canadian Tire, Mark's and FGL Sports 67 4.4 6.2 BBB (high)
Winners, HomeSense, Marshalls 48 3.9 5.5
Lowe’s, RONA 9 2.6 7.4 A (low)
Sobeys 17 2.4 6.4 BBB (low)
Reitmans 102 2.3 3.3
Loblaws and Shoppers Drug Mart 19 2.3 7.4 BBB
Best Buy 23 1.9 2.8
Dollarama 46 1.6 4.8 BBB
Michaels 24 1.6 4.6
Total 450 49.3 6.7
SMART REAL ESTATE INVESTMENT TRUST 11Key Investment Highlights – SmartREIT’s Key Growth Initiatives
1. Intensify and expand existing 31.9 million
square feet of retail properties
Retail
Seniors Housing
Residential – condominium, rental and single
family housing
Self-Storage
2. Urban Development Properties
3. Toronto Premium Outlets expansion and new
outlet sites in other locations
4. Select accretive acquisitions
5. Support Walmart Canada’s growth agenda
SMART REAL ESTATE INVESTMENT TRUST 12SmartREIT Retail Intensification
Multiple sites under investigation for
intensification. Currently estimated 30+ sites
have potential
Majority of initial sites in the Greater Toronto
Area
Collaborate with JV partners who bring
expertise
Can be both new builds or retrofit in existing
buildings
SMART REAL ESTATE INVESTMENT TRUST 13SmartREIT’s Urban Development Properties
Major urban developments in Toronto, Montreal
and Ottawa
Linked to new transit infrastructure
Mixture of Office, Residential (condominium and
rental) and Retail
Potential of in excess of 10 million square feet of
development over time
Will involve experienced JV partners
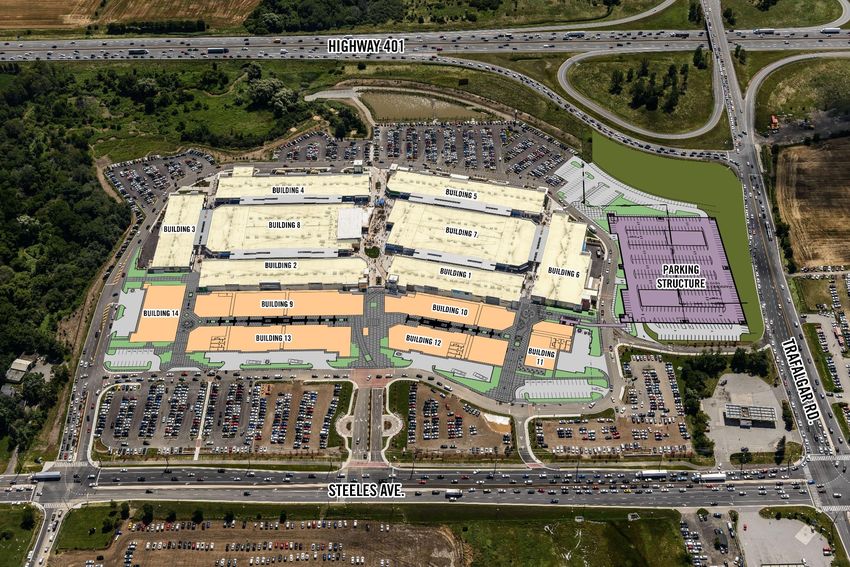
SMART REAL ESTATE INVESTMENT TRUST 14Vaughan Metropolitan Centre (“VMC”)
A long term build (10 – 15 years)
A 50:50 JV between SmartREIT and Penguin Investments
Potential density of 8-10 million square feet of residential,
office and retail development
First development completed – KPMG tower complex with
365,000 SF of LEED Gold space, opened in 2016
Second 220,000 SF office tower with PWC as lead tenant,
YMCA, library and community space to commence
building in Spring of 2017
Transit infrastructure, including TTC subway, VIVA bus
and York regional bus, to open in 2017 – now fully funded
and updated schedule in place
Moving forward with residential developer for first two
residential condominium towers on site now at 55 storeys
SMART REAL ESTATE INVESTMENT TRUST 15VMC – Phases 1 & 2 of Office Development SMART REAL ESTATE INVESTMENT TRUST 16
VMC Today – KPMG Tower

  KPMG Tower: now complete

SMART REAL ESTATE INVESTMENT TRUST   17
VMC Today – KPMG Tower Lobby

SMART REAL ESTATE INVESTMENT TRUST     18
SmartCentres VMC Central Park

SMART REAL ESTATE INVESTMENT TRUST      19
VMC – Aerial

SMART REAL ESTATE INVESTMENT TRUST   20
VMC – Major Construction Projects in Vicinity

SMART REAL ESTATE INVESTMENT TRUST                      21
VMC - Rapid Transit to Downtown Toronto

SMART REAL ESTATE INVESTMENT TRUST                22
Additional Mixed Use Developments
StudioCentre (Lakeshore Boulevard East Toronto)
1.2 million square foot site owned jointly with Penguin
Investments
Received council approval relating to the rezoning
application
Westside Mall (Eglinton and Caledonia Toronto)
Shopping centre redevelopment leveraging new LRT
station and proposed new GO station
Laval Centre (Montreal)
Development of 43 acre parcel at “Centre-Ville” to
include retail, residential, office and seniors housing
South Keys (Ottawa)
Redevelopment of shopping centre leveraging new
transit hub
Various other sites under investigation
SMART REAL ESTATE INVESTMENT TRUST 23StudioCentre SMART REAL ESTATE INVESTMENT TRUST 24
StudioCentre

  Architect’s rendering of potential new site layout

SMART REAL ESTATE INVESTMENT TRUST                     25
StudioCentre

SMART REAL ESTATE INVESTMENT TRUST   26
StudioCentre
StudioCentre is a brownfield
location next to Toronto’s
eastern waterfront. A former
industrial site, today it is an
underutilized film production
centre
SmartREIT and Penguin
Investments intend to revitalize
the centre, adding new
production, office, and retail
opportunities
Rezoning has created the
opportunity to build up to 1.2
million square feet of office,
retail and film studios at the
centre
SMART REAL ESTATE INVESTMENT TRUST 27Westside Mall Toronto
Current density - 143,800 square feet
City of Toronto proposed density for site: 4.5x coverage = approximately 2.0 to 2.5 million square feet
Buildings height of up to 33 storeys
LRT to open by 2021; construction well underway. Tunnel boring is complete in front of the centre. Station construction not yet
started
New GO station with regular service to Union Station further enhances transit links
Zoning and approvals will be a lengthy process. Commence in 2017
SMART REAL ESTATE INVESTMENT TRUST 28Laval Centre Lands designated by City as “Centre-Ville”, due to highway and transit access 43 acre site anchored by a 160,000 square foot Walmart Supercentre Parcels of land under contract for seniors housing and office development of 400,000 square feet Proposed JV for 290,000 square feet of rental residential in 330 units being negotiated Remaining 15 acres to be developed SMART REAL ESTATE INVESTMENT TRUST 29
Premium Outlets
Toronto Premium Outlets
JV with Simon Property Group
500,000 SF when all phases are completed
Phase I opened August 1, 2013
Phase II construction – Underway with new parking
facility as part of expansion
Stabilized yield continues to be in the double digits
Montreal Premium Outlets
JV with Simon Property Group
Phase I – 350,000 SF
Opened October 30, 2014
Additional 75 acres of potential retail development
adjacent to the site
Actively sourcing two other locations in Canada
SMART REAL ESTATE INVESTMENT TRUST 30Premium Outlets SMART REAL ESTATE INVESTMENT TRUST 31
Toronto Premium Outlets (“TPO”) – Expansion

SMART REAL ESTATE INVESTMENT TRUST                    32
TPO Expansion – Pedestrian Bridge & Parking Deck

SMART REAL ESTATE INVESTMENT TRUST                         33
Key Investment Highlights – Our Balance Sheet Will Support
Extensive Asset Growth
Unencumbered pool at $2.7 billion = flexibility
Ready access to mortgage and unsecured debt
capital when needed = strong liquidity
Key ratios improving
Payout ratio at 79.8% in Q4 2016, within target
range of 77% to 82%
Renewing interest rates still lower than maturing
rates despite rate increases improves FFO
SMART REAL ESTATE INVESTMENT TRUST 34Debt Maturity / Leverage
Debt Maturity
(in millions of $)
4.6%
4.2% 4.2% 4.3%
3.8% 3.8%
3.5% 3.7% 3.7%
160 3.4%
150 0 0
2.6%
150
200
150 150
100 250 0
323 327 335 123 125 225 146 25 325 63 48
2017 2018 2019 2020 2021 2022 2023 2024 2025 2026 Thereafter
Secured Debt Unsecured Debentures Average Int. Rate
Lower interest costs on refinancing available with 10 year unsecured rates around 3.5% and secured rates
below that
Interest Coverage: 3.1X Target: 2.5 - 2.75X
Debt to EBITDA: 8.4X Target: 7.25 - 7.5X
Debt to GBV: 51.9% Target: 50 - 60% long-term trend to continue to de-lever
Unencumbered pool: $2.7 billion (2.1X) Target: 1.5X unsecured coverage
Weighted Avg Interest Rate (Secured Debt): 3.79%
Weighted Avg Term to Maturity (Secured Debt): 4.8 yrs
DBRS rating of BBB with a Stable trend
SMART REAL ESTATE INVESTMENT TRUST 35Leverage Profile
Dec. 31 Dec. 31 Dec. 31 Dec. 31
2013 2014 2015 2016
Debt to Aggregate Assets(1) 43.8% 42.8% 44.7% 44.3%
Secured Debt to Aggregate Assets(2) 28.1% 24.7% 31.2% 29.5%
Unencumbered Assets $1.5B $2.4B $2.5B $2.7B
Debt to Adjusted EBITDA(1) 8.1X 7.4X 8.4X 8.4X
Interest Coverage 2.5X 2.7X 3.0X 3.1X
Liquidity: Cash Resources $338M $324M $345M $355M
Weighted Average Interest Rate(3) 5.17% 5.03% 3.87% 3.79%
Weighted Average Term to Maturity(3) 5.5 yrs 5.3 yrs 5.4 yrs 4.8 yrs
1) Leverage increased during 2015 in support of the transformative SmartCentres Platform transaction
2) Significant rate spread between unsecured and secured debt led management to increase secured debt financing during 2015
3) Secured Debt
SMART REAL ESTATE INVESTMENT TRUST 36Conservative Capital Structure
Total Enterprise Value – $9.0 Billion
Secured Mortgage Financing
27.9% Amount - $2.5 billion
Weighted Avg Interest Rate – 3.79%
Weighted Avg Term to Maturity – 4.8 years
Unsecured Debentures Focused on:
14.6% Amount - $1.31 billion
Weighted Avg Interest Rate – 3.71% Lowering interest rates on renewals
Weighted Avg Term to Maturity – 6.0 years
Maintaining maximum flexibility
Equity
57.0% Units Outstanding – 156 million Reducing leverage over time
Share Price – $32.74 as at Feb. 10, 2017
Market Capitalization – $5.1 billion
Operating Lines / Outstanding LC’s
0.5% Operating Line – $nil
Letters of Credit – $46 million
SMART REAL ESTATE INVESTMENT TRUST 37Stable Cash Flow
AFFO Payout Ratio
94.0% 90.3% 88.6% 84.7% 81.1% 79.8%
2011 2012 2013 2014 2015 2016
$ per unit
FFO 1.70 1.79 1.85 1.95 2.10 2.23*
AFFO 1.65 1.71 1.75 1.84 1.99 2.10*
Distributions 1.55 1.55 1.55 1.56 1.61 1.66
* includes $9.9 million settlement proceeds associated with the Target lease terminations net of other amounts
Distribution fully funded from operating cashflow
Management expects the payout ratio to remain in the high 70% to low 80% range
Annual distribution increased in October 2016 to $1.70 from $1.65, representing an
increase of 3.0%
SMART REAL ESTATE INVESTMENT TRUST 38Key Investment Highlights – Quality of Development Capability
Can Be a Differentiator
Very experienced development team
Close to 200 shopping centre developments over last
20 years
Up to 50 million square feet built
Growing expertise in Mixed Use
All key resources in-house
Experienced and knowledgeable leasing operations and
support team
Key JV Partners
Walmart CentreCourt
Simon Property Group Jadco
Mitchell Goldhar SmartStop
SMART REAL ESTATE INVESTMENT TRUST 39Other Issues We Are Monitoring
In the coming years, retailers’ businesses will be affected
by:
E-commerce
Aging population
Urbanization and the move to more convenient
shopping
Changing ethnic mix of population
We will continue to monitor the impact of these issues
and will adjust our business model accordingly, always
remembering:
The quality of our sites
The value we provide our tenants
The strength and capabilities of our partners
SMART REAL ESTATE INVESTMENT TRUST 40E-commerce Response – Penguin Pick-Up
Penguin Pick-Up located at Scarborough (1900 Eglinton) SmartCentre
SMART REAL ESTATE INVESTMENT TRUST 41E-commerce Responses
Penguin Pick-Up:
Initiative driven by Penguin Investments
Convenient locations for consumers to pick up
products ordered online
Drives traffic to shopping centres and supports
tenants
10 SmartREIT locations in place for the initiative at
year-end, along with 42 external sites, with significant
increase to come in 2017
Over 2,500 different retailers supported so far
Launching digital signage at select locations
Further initiatives in the planning stage
SMART REAL ESTATE INVESTMENT TRUST 42The Best Offense Starts With a Strong Defense - SmartREIT
Best-in-Class Portfolio
Newest retail portfolio amongst all Canadian peers.
84% located in urban or near urban locations, with
strong national tenants as anchors
Strong Financial Position
Strong balance sheet and strong credit metrics.
Growing unencumbered pool provides increased
financial flexibility. Access to multiple sources of
capital
Growth Prospects increasing, particularly after
SmartCentres acquisition
Portfolio of growth opportunities from smaller local
intensification to Vaughan Metropolitan Centre,
Canada’s largest mixed use development
SMART REAL ESTATE INVESTMENT TRUST 43Q4 2016 - Solid Performance
98.3% occupancy (98.5% including committed
leases)
Portfolio valued at $8.7 billion
FFO per unit increased 6.2% over 2015
2016 tenant retention at 81% with an average
rental increase of 2.8% (4.0% excluding anchor
tenants)
SMART REAL ESTATE INVESTMENT TRUST 44Q4 2016 - Solid Performance
December 31 December 31
2016 2015 Change
FFO / unit $2.23 $2.10 6.2%
AFFO / unit $2.10 $1.99 5.5%
Payout ratio 79.8% 81.1% -1.3%
Debt to Aggregate Assets 44.3% 44.7% -0.4%
Liquidity: Cash Resources $355.1M $345.1M 2.9%
Unencumbered Asset Pool $2.7B $2.5B 8.0%
Debt to Adjusted EBITDA 8.4X 8.4X 0.0%
Interest Coverage 3.1X 3.0X 3.3%
SMART REAL ESTATE INVESTMENT TRUST 45Appendix SMART REAL ESTATE INVESTMENT TRUST 46
October 2016 Acquisition – Pointe Claire SmartCentre

                                     Address: 195 Hymus Boulevard, Pointe Claire, QC

                                     Major Intersection: Hymus Boulevard & St. Jean Boulevard

                                     Site Area: 382,000 square feet

                                     Occupancy: 98%

                                     Major Tenants: Walmart Supercentre, Home Depot, Dollarama,
                                                   L’Equipier, Pier 1 Imports

SMART REAL ESTATE INVESTMENT TRUST                                                                47
August 2016 Acquisition – Lethbridge SmartCentre II
Address: 325 Bluefox Boulevard North, Lethbridge, AB
Major Intersection: Bluefox Boulevard North & 26 Avenue North
Site Area: 53,000 square feet
Occupancy: 100%
Major Tenants: Sobeys, Liquor Depot, Original Joe’s
SMART REAL ESTATE INVESTMENT TRUST 48SmartCentres - Oakville SmartCentre
Address: 234 Hays Boulevard, Oakville, ON
Major Intersection: Highway 5 & Trafalgar Road
Site Area: 445,000 square feet
Occupancy: 100%
Major Tenants: Walmart Supercentre, Real Canadian Superstore
(Loblaws), LCBO, CIBC
SMART REAL ESTATE INVESTMENT TRUST 49SmartCentres - Oshawa South SmartCentre
Address: 680 Laval Drive, Oshawa, ON
Major Intersection: Stevenson Road & Laval Drive
Site Area: 540,000 square feet
Occupancy: 100%
Major Tenants: Walmart Supercentre, Lowe’s, Sail, CIBC
SMART REAL ESTATE INVESTMENT TRUST 50Strategic Relationships
Walmart
Mitchell Goldhar
Simon Property Group
CentreCourt Developments
Jadco Corporation
SmartStop Asset Management
SMART REAL ESTATE INVESTMENT TRUST 51Strategic Relationship - Walmart Canada
Walmart Canada Number of Walmart Stores
attributes
Value pricing and fresh
food generates huge
traffic 222 299
Other
Dominant retailer Shadow
14 SmartREIT
13
Has benefited from the
90 95
closure of Target
76% of Canadians live Supercentres Total Walmart
(325)* Stores (408)*
within 10 km of a Walmart * Company source as at February 10, 2017
SMART REAL ESTATE INVESTMENT TRUST 52Strategic Relationship - Mitchell Goldhar
JV Partner
Vaughan Metropolitan Centre
StudioCentre Site
Salmon Arm
Consultant on mixed use projects
Board Chair, Trustee and Investment Committee
member
Ad hoc advice and council on shopping centre
portfolio
Multiple on-going business relationships as
service provider
SMART REAL ESTATE INVESTMENT TRUST 53Strategic Relationship - Simon Property Group
Largest public real estate company in the U.S.
Engaged primarily in retail real estate properties
including regional malls, Premium Outlets and
The Mills®
Exceptional relationships with the world’s largest
retailers provides strong tenant base for
premium sites
Canada is part of a continuing global expansion
SMART REAL ESTATE INVESTMENT TRUST 54Strategic Relationship – CentreCourt Developments
Leader in the development of high-rise
condominiums in downtown Toronto
Since 2011, CentreCourt has completed and/or
is in various stages of developing over 3,000
condominium units in six major high-rise projects
with a development value of over $1.2 billion
SMART REAL ESTATE INVESTMENT TRUST 55Strategic Relationship – Jadco Corporation
Well reputed family-owned business
Has gained a strong foothold in the real estate
sector in the Greater Montreal Area
Strengths lie in its commitment to excellence in
building exceptional living and mixed-used
environments
Diversified portfolio comprised of luxury
residential, upscale rental and mixed-used
projects such as Paton1, Quintessence and
Équinoxe
SMART REAL ESTATE INVESTMENT TRUST 56Strategic Relationship – SmartStop Asset Management
Diversified real estate company focused on self
storage assets, along with student and senior
housing
Portfolio currently includes 65,000 self storage
units, 7.5 million rentable square feet and $1
billion of real estate assets under management
Asset manager for 103 self storage facilities
located throughout the United States and
Toronto, Canada
SMART REAL ESTATE INVESTMENT TRUST 57You can also read