PART 6 - THE CHANGING SHAPE OF THE CPG DEMAND CURVE: E-COMMERCE - IRi

Page created by Fernando Green
 
CONTINUE READING
PART 6 - THE CHANGING SHAPE OF THE CPG DEMAND CURVE: E-COMMERCE - IRi
COVID-19 and Navigating the Path Ahead

PART 6 – THE CHANGING
SHAPE OF THE CPG DEMAND
CURVE: E-COMMERCE
July 29, 2020
                         Read Other CPG Demand Curve-Focused Reports:
                         Part 1 – Shopper Engagement, E-Commerce, CPG Demand & Beauty
                         Part 2 – Meat and Millennials’ Impact on CPG Demand Curve
                         Part 3 – Tracking Transformation of the Retail Landscape
                         Part 4 – A Global Perspective
                         Part 5 – Boomers
PART 6 - THE CHANGING SHAPE OF THE CPG DEMAND CURVE: E-COMMERCE - IRi
Executive Summary
A silver lining of the COVID-19 pandemic has been the rapid rise of e-commerce,
relieving shoppers of potential exposure in-store, making it easier for them to
compare prices and often extending access to product assortment. E-commerce has
its share of challenges in terms of shopper satisfaction, lost impulse sales and
increased cost to serve, but retailers, manufacturers and fulfillment partners have
opportunities to erase fulfilment friction and create new meaningful ways for shoppers
to buy and connect with brands and retailers.
The Rapid Rise of E-Commerce
• Driven by concerns over in-store safety, American shoppers during the COVID-19 pandemic
  shifted ~2.5% of edible and ~7.0% of nonedible CPG spend to grocery e-commerce.
• Crowd-sourcing model Instacart and large, invested retailers Amazon, Walmart, Target,
  Costco, Kroger, Ahold Delhaize and Albertsons have captured increased demand and are
  accelerating investments in better shopping experiences, further consolidating the
  online landscape to large, national players. See appendix for Instacart case study.
Looking Ahead
• Conversion to e-commerce will continue to rise into 2021 and beyond as infrastructure
  investments catch up with heightened demand amid the new normal.
• The rapid change in the omnichannel environment will require manufacturers and retailers
  to quickly assess changes in purchasing behavior across in-store and online and adapt
  distribution, assortment, marketing, pricing, promotion and logistics accordingly.
• Careful consideration of key word search should support shoppers, promote beneficial
  attributes and spark product discovery.

                                                                                       © 2020 Information Resources Inc. (IRI). Confidential and Proprietary.   2
PART 6 - THE CHANGING SHAPE OF THE CPG DEMAND CURVE: E-COMMERCE - IRi
E-Commerce, Grocery and Dollar Channel Sales Growth Have Particularly
Accelerated Since Peak COVID-19 Stockpiling in Mid-March
Dollar Sales Trends in Measured Channels
                                                                            Dollar Sales % Change vs. YA
                     CY 2019
          Channel
                    Sales ($B)                                       January &
                                                CY 2019                                                 March                                  April - Present
                                                                      February

 Grocery             $320.5              1.7%                     1.0%                                     51.4%                                         22.8%

 Mass                $230.3              3.8%                     3.2%                               28.9%                                           8.1%

 Convenience         $161.1              3.3%                     2.9%                        0.0%                                                  3.6%

 Drug                 $47.8      -0.5%                    -0.2%                                     23.1%                               -3.4%

 Club                 $41.8      -1.4%                    -0.6%                                         41.4%                                         12.5%

 Dollar               $19.8               12.6%                    8.3%                                       64.7%                                      24.5%

 E-Commerce           $99.4                22.4%                         30.8%                               61.8%                                                   82.9%

                                                                                             Source: IRI POS, Panel, and eMarket Insights data ending 7/12/20.
                                                                                            © 2020 Information Resources Inc. (IRI). Confidential and Proprietary.     3
PART 6 - THE CHANGING SHAPE OF THE CPG DEMAND CURVE: E-COMMERCE - IRi
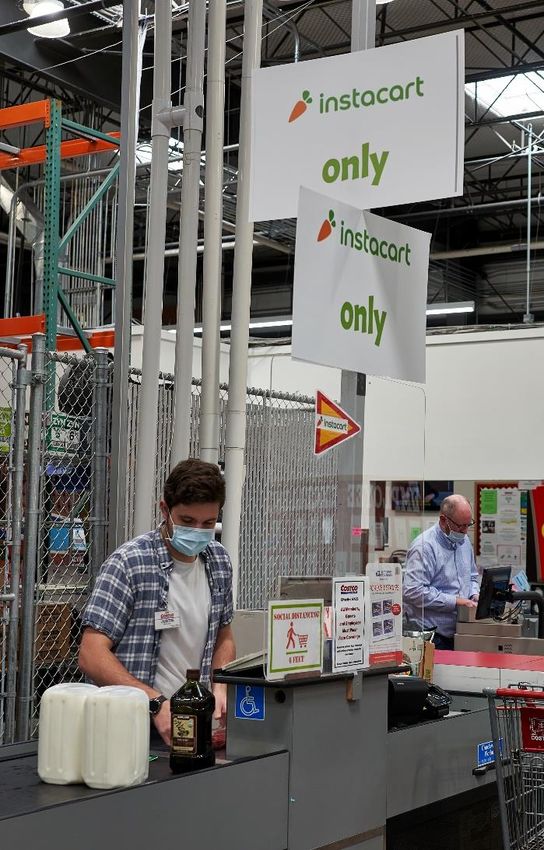
With COVID-19, E-Commerce’s Share of CPG Sales
Jumped +2.4 ppts in Edible and +7.0 ppts in Nonedible
CPG E-Commerce Dollar Share of Omnichannel

                                               Edible                                                                                                                   Nonedible
                                                                                                                                                                                                                                     29.7

                                                                                                                                                                                                            23.5        22.7
                                                                                                                                                               20.9                              20.9
                                                                                                                                                                          19.3        19.7
                                                                                                                                                    18.6
                                                                                                                                         15.5
                                                                                                                              12.8

                                                                                                    8.2
                                    4.9                             4.9        5.6        5.8
                         3.7                  4.5        4.6
    2.3       2.8

   2016 2017 2018 2019 2019 2019 2019 2019 2020 2020                                                                          2016 2017 2018 2019 2019 2019 2019 2019 2020 2020
                        Q1   Q2   Q3   Q4   Q1   Q2                                                                                                Q1   Q2   Q3   Q4   Q1   Q2
Ppt. chg.                                                                                                                   Ppt. chg.
vs. prior   +0.5       +0.9       +1.2                  +0.1       +0.3       +0.7       +0.2       +2.4                    vs. prior +2.7          +3.1       +2.3                   +0.4        +1.2       +2.6        -0.8        +7.0
period                                                                                                                      period

        Source: IRI eMarket Insights, ending 6/14/20. eCommerce share of Omnichannel based on 204 IRI tracked CPG categories, estimates for untracked CPG categories, channels, excludes Convenience. IRI Consulting analysis.
                                                                                                                                                            © 2020 Information Resources Inc. (IRI). Confidential and Proprietary.          4
PART 6 - THE CHANGING SHAPE OF THE CPG DEMAND CURVE: E-COMMERCE - IRi
In the Short-Term, Expandable Crowd-Sourcing Model Instacart
    is Driving Edible, While Shipment Remains Majority of Nonedible
    E-Commerce $M by Modality Type Pre- and During COVID-19
                                                                      EDIBLE                                                                                     NONEDIBLE
                                                                                            4,456                                                                                              8,118
                                                                                                                                                                                                                 400 (5%)
                                                                                           1,374                                                   5,911                                   673 (8%)
                                                                                           (31%)                                                  299 (5%)
                                                  2,883                                                                                                                 368
                                                                                                                                                                        (6%)
                          Click & Collect          995                                     1,645
                   (e.g., Walmart Pickup)         (34%)                                    (37%)                                                                                              7,044
                                  Delivery         875                                                                                               5,245                                    (87%)
                            (e.g., Instacart)     (30%)                                                                                              (89%)
                                                                                           1,438
                      Home Shipment               1,014
                      (e.g., Amazon.com)
                                                                                           (32%)
                                                  (35%)
                                                 Feb-20                                    Jun-20                                                   Feb-20                                   Jun-20

   TOP GAINERS
% of sales pre-COVID-19          12%                         23%                                  28%                                            58%                                  6%                                  1%
% of Feb.-June growth            34%                         19%                                  18%                                            59%                                  5%                                  5%

                                                Source: IRI eMarket Insights, data ending 6/14/20. Based on retailers where modality can be determined or assumed to majority classification. IRI Consulting analysis.
                                                                                                                                                 © 2020 Information Resources Inc. (IRI). Confidential and Proprietary.        5
PART 6 - THE CHANGING SHAPE OF THE CPG DEMAND CURVE: E-COMMERCE - IRi
E-Commerce Share Grew Across Categories, But Proportionately More in Edible
E-Commerce Dollar Share of Omnichannel by Category

                                                                       E-Commerce Share of Omnichannel                                                            June – February Change
  Category
                                                                         Feb-20              Jun-20                                                        Ppt. Changee            % Changee
  Beverage                                                                11.1%               13.5%                                                              2.4                  21%
  Packaged Food                                                            8.6%               12.7%                                                              4.1                  47%
  Frozen Foods                                                             8.8%               11.7%                                                              2.9                  33%
  Dairy                                                                    4.1%                6.6%                                                              2.4                  59%
  Fresh Foods                                                              1.8%                2.5%                                                              0.7                  39%
  EDIBLE                                                                   5.8%                7.8%                                                              2.0                  35%
  Cosmetics                                                               38.0%               47.8%                                                              9.7                  26%
  Personal Care                                                           33.0%               38.4%                                                              5.3                  16%
  Pet Food & Care                                                         31.2%               38.0%                                                              6.8                  22%
  Baby Food & Care                                                        28.4%               36.4%                                                              8.0                  28%
  OTC Healthcare                                                          22.1%               29.7%                                                              7.6                  35%
  Home Care                                                               14.9%               18.4%                                                              3.5                  23%
  Paper Products                                                          10.7%               15.8%                                                              5.1                  47%
  General Merchandise                                                     12.2%               11.5%                                                             -0.7                  -6%
  NONEDIBLE                                                               23.4%               28.2%                                                              4.8                  20%

       Source: IRI eMarket Insights, ending 6/14/20. eCommerce share of Omnichannel based on 204 IRI tracked CPG categories, estimates for untracked CPG categories, channels, excl. Convenience. IRI Consulting analysis.
                                                                                                                                                       © 2020 Information Resources Inc. (IRI). Confidential and Proprietary.   6
PART 6 - THE CHANGING SHAPE OF THE CPG DEMAND CURVE: E-COMMERCE - IRi
Households Shifting to E-Commerce for CPG Peaked in May / June
E-Commerce Penetration and Buy Rate Before and During COVID-19

     E-Commerce % Households Buying                           E-Commerce Dollars per Household
                             +7.8                                                     +38%

                                    31.8   32.9   32.6                                                           249.2         250.7
                                                                                                    231.2
                             28.6
                                                                                       202.1
        24.9   25.1   24.5                                                191.0
                                                          175.6   180.0

       12 w/e 12 w/e 12 w/e 12 w/e 12 w/e 12 w/e 12 w/e   12 w/e 12 w/e 12 w/e 12 w/e 12 w/e 12 w/e 12 w/e
        1/26   2/23   3/22   4/19   5/17   6/14   7/12     1/26   2/23   3/22   4/19   5/17   6/14   7/12

                                                                                   Source: IRI National Consumer Panel, data ending 7/12/20.
                                                                          © 2020 Information Resources Inc. (IRI). Confidential and Proprietary.   7
PART 6 - THE CHANGING SHAPE OF THE CPG DEMAND CURVE: E-COMMERCE - IRi
Shopping Online for Curbside Pickup
and Home Delivery is Here to Stay

50%
                          of those using curbside pickup more often than
                          previously now plan to use it for at least half of
                          their groceries after stay-at-home restrictions end.
                         Another 31% will continue to use it occasionally.

35%
                          of those who have been ordering groceries for
                          home delivery more often plan to get at least
                          half their groceries this way after restrictions end.

31%
                          say home delivery product prices are higher than
                          they would normally be willing to pay, compared with
                          17% for curbside.

     Source: IRI Consumer Network™ Panel Survey representing Total U.S. Primary Grocery Shoppers – 4/24-4/26
                                            © 2020 Information Resources Inc. (IRI). Confidential and Proprietary.   8
PART 6 - THE CHANGING SHAPE OF THE CPG DEMAND CURVE: E-COMMERCE - IRi
Awareness and Search Are Key Elements in Online Shopping
Experience; Support Shoppers with Key Words, Beneficial Attributes
Shopping Behaviors During Last Online Shopping Experience
Those Who Have Shopped for Groceries Online in the Past 2 Months (Base: 518)

       59% I used the search tool to type in the name of a specific item I wanted

       35% I used the category menus to browse for options within a category

       32% I accessed a list of items I had bought in the past from that site and re-ordered from that list

       29% I checked which items were on sale before making a decision on which item to choose

       12% I looked for new items to try

                                                           Source: IRI Consumer Network™ Panel Survey representing Total U.S. Primary Grocery Shoppers – 5/22 – 5/24
                                                                                                    © 2020 Information Resources Inc. (IRI). Confidential and Proprietary.   9
PART 6 - THE CHANGING SHAPE OF THE CPG DEMAND CURVE: E-COMMERCE - IRi
Instacart Quickly Increased Capacity and
Other E-commerce-Invested Retailers Benefited                                                                   Retailers are investing to
                                                                                                                meet heightened demand.
Further Investment in 2021 Likely to Accelerate Growth Curve                                                       Large-scale needed to
                                                                                                                  drive ROI favors existing
    Instacart and Amazon Address              Rapid Acceleration of Demand Pushes                                     leaders Amazon,
          Increased Demand                      Limits of Existing Infrastructure                                     Walmart, Target,
                                              Grocery Pickup & Delivery Availability Timing                         national grocery and
                                                       % of Respondents, April 2020                                other national retailers.
                                                                                  65
• 3-4x increase in orders early in pandemic
                                                                                                                       Kroger continues
• Executes improvements to web platform to
  handle increased demand                              21                                                            plan to roll out Ocado
                                                                    14
• Doubles shoppers in first 8 weeks,                                                                                    delivery in 2021.
  quadruples by summer
                                                    Same day     Next Day      2 days+                                  Ahold-Delhaize
                                              • Challenges predicting stock with existing                            rebranding Peapod to
                                                models and longer time between order and
                                                fulfillment                                                          Stop & Shop Delivery,
• 26% revenue increase in Q1 ending 3/31/20   • 62% of respondents indicate items were                                Giant Food Delivery
• Hires warehouse workers and increases         unavailable in orders
                                                                                                                     and revamping online
  hourly wage during COVID-19                 • Unavailability of items was the top reason
                                                for dissatisfaction with online ordering                                  experience.

                                                                                       © 2020 Information Resources Inc. (IRI). Confidential and Proprietary.   10
Retailers Experience Dramatic E-Commerce Sales Bump During Pandemic
Consumer Demand for Curbside Pickup and Home Delivery Continues to Rise

               74%                                   92%                                                141%
       increase through July vs. YAG;   online sales increase thru Q1 WE 5.23;      increase in e-commerce sales;
        Walmart x Shopify partnership   Ocado partnership includes three new assortment, shipping, employee costs cut
         results in 5,000 new sellers    robotic fulfillment centers nationwide  into net income; perishable foods for
                                                                                pickup will be in 70% of stores by July

            48.3%                                  276%                                                    42%
       March 2020 online sales were     increase in digital sales for 16 WE 6.20;    increase in online sales in Q1; click &
       48.3% higher than March 2019         delivery via 90% of 2,252 stores;           collect points and home delivery
                                             curbside pickup in 1,600 stores             fulfillment center investments

                                                                                    © 2020 Information Resources Inc. (IRI). Confidential and Proprietary.   11
E-Commerce Share Will Remain Elevated into 2021
                                                                                                                                                                                       While some new CPG
as Large Retailers Increase Infrastructure
                                                                                                                                                                                  e-commerce users will switch
E-Commerce Dollar Share of Omnichannel – During COVID-19 Forecast                                                                                                                  back to in-store, conversion
                                                                                                                                                                                  will stick for many as in-store
                         Edible                                                                                                                                                      safety concerns remain
                                                                                                                Nonedible
                                                                                                                                                                                    and e-commerce purchase
                                                                                                                                                         30.0-                            habits take hold.
                                                                                                                              28.0-                      35.0
                                                                                                                  29.7                      27.0-
                                                                                                                              30.0
                                                                                                                                            28.0                                           National players
                                                                                                    22.7                                                                              (e.g., Amazon, Walmart,
                                                                                       20.9
                                                                                                                                                                                    Instacart, Target, national
                                                               9.0-                                                                                                                 grocery, specialty pet and
                                     7.5-         7.2-         12.0                                                                                                               beauty retailers) will continue
                        8.2          8.5          7.7
           5.8
                                                                                                                                                                                    to dominate the market as
  4.9
                                                                                                                                                                                         they invest more in
                                                                                                                                                                                  infrastructure improvements
 2019     Q1            Q2         2020          2020          2021                   2019           Q1           Q2         2020           2020         2021                        like technology, staff and
         2020          2020        H2 (F)         (F)           (F)                                 2020         2020        H2 (F)          (F)          (F)
                                                                                                                                                                                 training, fulfillment space, etc.

        Source: IRI eMarket Insights, ending 6/14/20. eCommerce share of Omnichannel based on 204 IRI tracked CPG categories, estimates for untracked CPG categories, channels, excl. Convenience. IRI Consulting analysis.
                                                                                                                                                        © 2020 Information Resources Inc. (IRI). Confidential and Proprietary.   12
Implications for Manufacturers and Retailers

            MANUFACTURERS                                                     RETAILERS
 • Understand omnichannel purchasing              • Whether through own operations or
   behavior for your product categories and         secondary providers, invest in online
   invest accordingly in retail partners.           product availability and tracking to
 • Work with retailers to create brand              ensure consumers can get the products
   presence on platforms; use key words to          they want easily.
   promote search and encourage                   • Reallocate space and resources to in-
   discoverability.                                 store picking and curbside pickup; invest in
 • Ensure distribution in appropriate online        technology and training for associates to
   retailers to retain existing buyers as they      support new efforts.
   switch channels.                               • Build search and awareness capabilities
 • Customize innovation and pricing to              into platform; support each shopper’s list of
   online environment to maintain competitive       previously ordered items for easy reorders.
   advantage in a wider assortment universe.      • Use delivery promotions to encourage
 • Consider first-, second- and third-party         adoption, build baskets and spark impulse
   pricing and impact on brand performance          purchases.
   and perceptions.                               • Consider cost structure vs. competition.
 • Leverage promotion and marketing with
   each online retailer to benefit from ease of
   search and advertising on online platforms.

                                                    © 2020 Information Resources Inc. (IRI). Confidential and Proprietary.   13
IRI Offers a Variety of Solutions and Services to Help
Manufacturers and Retailers Enhance E-Commerce Strategy

                 Total eCommerce                                                                                                      Channel
                Market Measurement                                  ePOS
                                                                                                                                      Strategy
   • Total e-commerce and in-store              • Census ePOS item level data for                   • Outlines success factors for brand /
     macro omnichannel view of the                key retailers                                       category / portfolio in a new
     market                                     • Online and in-store item level POS                  omnichannel landscape
   • Largest total market view reporting          data is combined to help clients                  • Assesses impact on consumer
     of 200+ syndicated CPG categories            drive assortment and pricing                        journey, retailer relationships and
     and 200+ retailer and retail                 decisions and strategies                            internal operations
     fulfillment types, including click &                                                           • Identifies size of prize and strategic
     collect, direct shipment and delivery                                                            priorities to win
     services
   • Powered by unique combination of
     eShopper and retailer supplied
     ePOS data

   ACTION and IMPACT                            ACTION and IMPACT                                   ACTION and IMPACT
   • Macro market level solution                • Provides clear understanding of                   • Provides clear understanding of
   • Provides clear understanding of              assortment and pricing in the                       omnichannel environment
     omnichannel environment                      omnichannel environment                           • Identifies strategic priorities to win
   • Identifies and prioritizes key retailers   • Identifies strategic priorities to win
     and fulfillment types for growth

                                                                                           © 2020 Information Resources Inc. (IRI). Confidential and Proprietary.   14
IRI Has a Suite of Offerings to Reclaim the Shelf in an Economic Downturn,
from End-to-End Consulting to Automated Alerts and Granular Analytics

               Portfolio Profitability                  IRI’s Assortment
                    Consulting                         Planning Solutions
   • Provides end-to-end guidance to     • Delivers a fully automated and
     strengthen value proposition          personalized decision-making
   • Chooses most profitable               platform
     opportunities among pricing, pack   • Harnesses IRI’s advanced store-
     size, messaging and innovation        level modeling to determine
   • Grows both top and bottom line,       granular, retailer-specific impacts
     while also driving market share     • Simulates full category results from
   • Builds win-win for retailers and      assortment and space decisions,
     manufacturers to drive engagement     accounting for demand transfer
     and compliance                      • Allows contingency and scenario
                                           planning, along with ongoing
                                           monitoring and tracking

   ACTION and IMPACT                     ACTION and IMPACT
   • >10% growth in sales                • >2-5% sales growth
   • 10-20% reduction in COGS            • 2-5% retail category growth
   • >5% margin gains
   • Up to 10% category growth

                                                                                  © 2020 Information Resources Inc. (IRI). Confidential and Proprietary.   15
COVID-19
The Changing
 Shape of the
CPG Demand
    Curve

 The Rise of
  Instacart

                © 2020 Information Resources Inc. (IRI). Confidential and Proprietary.   16
Instacart Food and Consumables Sales
More Than Doubled into April 2020
Dry Grocery, Fresh & Frozen and Consumables All
Doubled, But Declined Slightly Since April
Instacart Food + Consumables Sales by Quad Week ($MM)
                                                                           $1.3B
                                                     $1.2B
                                                                            $222
                                                     $227                                            $1.0B
                                                                                                       $179
                                                                            $482
                                                     $386
                                                                                                       $374
                               $498MM
  $386MM       $409MM            $105
    $65           $67
                                 $156                $583                   $621
    $145          $149                                                                                 $490

    $178          $194           $239

4 WE 01-26-20 4 WE 02-23-20 4 WE 03-22-20 4 WE 04-19-20 4 WE 05-17-20 4 WE 06-14-20
                         Dry Grocery    Fresh & FZ     Consumables

                                                             Source: IRI eMarket Insights, Food + Consumables = Total Store eMI Product Universe, Does Not Include Random Weight Fresh
                                                                                                                     © 2020 Information Resources Inc. (IRI). Confidential and Proprietary.   17
Instacart Now Accounts for Almost 10%
           of Online Food and Consumables Sales
           Instacart Share Gain is Driven by Food, Especially
           by Fresh and Frozen, Now Reaching 30%
           Instacart Share of E-Commerce Sales by Quad Week

                                                                                                                  32.1
                                                                                                                                                   29.9
                                                                                   27.5

                                                                                                                  19.3
    16.9                17.9                                                       17.9                                                            17.2
                                                     15.5

    8.9                  9.9                          9.7                           9.3                             9.8
                                                                                                                                                    8.7

    4.4                  4.8                          4.6
                                                                                    2.7                             2.5                             2.2
    1.1                  1.1                          1.4
4 WE 01-26-20      4 WE 02-23-20             4 WE 03-22-20                 4 WE 04-19-20                  4 WE 05-17-20                   4 WE 06-14-20
              Ttl Dry Grocery             Ttl Fresh & FZ                    Ttl Consumables                        Food + Consumables

                          Source: IRI eMarket Insights, Food + Consumables = Total Store eMI Product Universe, Does Not Include Random Weight Fresh
                                                                                  © 2020 Information Resources Inc. (IRI). Confidential and Proprietary.   18
Despite Strong Share Gains into April,
 Instacart Regressed in June
 Share Gains in April Have Regressed Across
 Dry Grocery, Fresh and Frozen and Consumables
 Instacart Share of Total Market* Sales by Quad Week

                                                                                                                        3.1

                                                                                          2.5                           2.6                           2.6
                                                                                          2.3
                                                                                                                        2.1                           2.1
                                                                                          1.9
                                                                                                                                                      1.7

    1.2                       1.2
    0.9                       0.9                           1.0                           1.0                           0.9
                              0.8                           0.9                                                                                       0.8
    0.7                                                     0.7
    0.3                       0.3                           0.4

4 WE 01-26-20        4 WE 02-23-20                 4 WE 03-22-20                 4 WE 04-19-20                 4 WE 05-17-20                 4 WE 06-14-20
             Ttl Dry Grocery                    Ttl Fresh & FZ                    Ttl Consumables                       Food + Consumables

          Source: IRI eMarket Insights, Food + Consumables = Total Store in eMI, Excludes Random Weight Fresh, Total Market = Multi-Outlet (Brick & Mortar) + Total e-Commerce, B&M data from POS, Double Counts Removed
                                                                                                                                                       © 2020 Information Resources Inc. (IRI). Confidential and Proprietary.   19
Amazon Dominates Consumables Online,
But Instacart is a Major Competitor in Food
Instacart Fulfilled 22% of Online Food Sales in the Latest 13 Weeks, Up from 15% in the L52 Weeks

          Share of E-Commerce – L52 Weeks                                              Share of E-Commerce – L13 Weeks

           FOOD                   CONSUMABLES                                             FOOD                                             CONSUMABLES
                                          1%                                                                                                       2%

                15%
                                                                                                         22%
    33%                                                                    31%
                            36%                                                                                                  35%

                      27%                     57%                                                                                                                        57%
                                                                                                             25%
                               5%                                                                                                      5%
          25%                                                                      22%

                             Instacart   Amazon        Walmart (P&D + .com)                         All Other

                                             Source: IRI eMarket Insights, Food + Consumables = Total Store eMI Product Universe, Does Not Include Random Weight Fresh
                                                                                                     © 2020 Information Resources Inc. (IRI). Confidential and Proprietary.    20
Instacart Increased to 33% of Online Food
Growth in the Latest 13 Weeks (25% in L52)
Over That Same Time Period, Walmart Decreased from 34% of Growth to 21% of Growth

        Share of Online Growth* – L52 Weeks                                                                              Share of Online Growth* – L13 Weeks

            FOOD                                     CONSUMABLES                                                              FOOD                                             CONSUMABLES

                                                                 3%                                                                                                                         4%
      20%
                      25%                      27%                                                               25%
                                                                                                                                                33%                    29%

                                             9%                                                                                                                       6%
                                                                               60%                             21%                                                                                       60%
     34%               21%
                                                                                                                                       21%

                                              Instacart              Amazon               Walmart (P&D + .com)                          All Other

               Source: IRI eMarket Insights, Food + Consumables = Total Store eMI Product Universe, Excludes Random Weight Fresh, Share of Online Growth = Contribution to e-Commerce dollars change vs YA
                                                                                                                                         © 2020 Information Resources Inc. (IRI). Confidential and Proprietary.   21
Instacart is Gaining Significant Share
                                                                   Across Meat, Vegetables, Fruit and Nuts
                                                                   Gains Made in Both E-Commerce and Total Market Across Top Categories
                                                                   Instacart – Share of E-Commerce vs. Share of Total Market* (Change vs. YA)
                                                                   Latest 13 WE 06-28-2020 – Top Categories by Instacart Market Share
                                                                                                                                        DRIED FRUIT
                                                             7.0
                     Share of Total Market – Change vs. YA                                                      SNACK NUTS                                     VEGETABLES - SS
                                                             6.0
                                                                                        MEAT - FZ
                                                             5.0                                                                                   MEAT - SS

                                                             4.0                                    POULTRY                                                                                    SEAFOOD - SS

                                                             3.0     COFFEE CREAMER
                                                                                                                               CANNED FRUIT
                                                             2.0                                                                                                                   VEGETABLES - FZ
                                                                                      TOMATO PRODUCTS LUNCHEON MEATS
                                                             1.0
                                                                   2.0        4.0       6.0           8.0         10.0                12.0                  14.0                  16.0                   18.0

                                                                                                        Share of E-Commerce – Change vs. YA

Source: IRI eMarket Insights, Food + Consumables = Total Store eMI Product Universe, Excludes Random Weight Fresh, Share of Total Market = Multi-Outlet + e-Commerce, Double Counts Removed in OG
                                                                                                                                © 2020 Information Resources Inc. (IRI). Confidential and Proprietary.      22
Instacart Now Has a 4%+ Market Share in 11 Categories
Across Dry Grocery and Fresh / Frozen
These Top Categories Are Growing 150% on Instacart and Gaining Significant Share vs. YAG
Top Instacart Categories by Market Share – Food and Consumables – L13 WE 06-28-2020
                                                                                                     Market Share
                   Dollars ($MM)                    % Change vs. YA                          (Multi-Outlet + E-Commerce)                                      Change vs. YA

         BABY FOOD
           DRIED FRUIT      $11 $37                                  266%                                                         9.5                                             6.1
      FACIAL TISSUE
              MEAT - FZ   $10                $112                    265%                                                   7.3                                             4.0
     PAPER TOWELS- SS
      VEGETABLES                       $42
                                       $80                                 355%                                           7.1                                                 4.8
     PAPER NAPKINS
             MEAT - SS $5        $50                                       350%                                       6.0                                                   4.0
    DISH DETERGENT            $19$46
          CANNED FRUIT                                                278%                                            5.6                                                 3.7
      TOILET TISSUE                       $56
      LUNCHEON MEATS                   $95                    165%                                                  5.4                                                3.0
     FOILS & WRAPS      $7
      POULTRY - FZ/RFG                $87                        205%                                              5.3                                                 2.7
           SPONGES     $4
           SNACK NUTS              $65                                        403%                               4.5                                                     3.4
 FOOD & TRASH BAGS            $23
       VEGETABLES - FZ        $36                                              411%                             4.1                                                     3.1
     CUPS & PLATES          $20
      COFFEE CREAMER      $10                                 166%                                              4.1                                                  2.2
LAUNDRY DETERGENT              $26
    TOMATO PRODUCTS        $18                                         296%                                     4.0                                                   2.4
          PET FOOD                         $59
          SEAFOOD - SS       $31                                                        545%                   3.9                                                      3.1

                                                    Source: IRI eMarket Insights, Food + Consumables = Total Store eMI Product Universe, Does Not Include Random Weight Fresh
                                                                                                            © 2020 Information Resources Inc. (IRI). Confidential and Proprietary.      23
Instacart is Also Gaining Share Rapidly Across Many Key Consumables Categories
Market Share Increases Come From Food, Paper, Cleaning and Pet
Top Instacart Categories by Market Share – Consumables – L13 WE 06-28-2020
                                                                                                        Market Share
                    Dollars ($MM)                      % Change vs. YA                          (Multi-Outlet + E-Commerce)                                      Change vs. YA

          BABY FOOD         $11
              BABY FOOD         $11                      165%                                                                  2.5                                              1.5
       FACIAL TISSUE        $10
           FACIAL TISSUE        $10                              693%                                                         2.3                                                   1.9
      PAPER TOWELS                      $42
          PAPER TOWELS                     $42             309%                                                           2.0                                                 1.3
     PAPER NAPKINS       $5
         PAPER NAPKINS       $5                                            1403%                                          2.0                                                      1.8
    DISH DETERGENT             $19
        DISH DETERGENT             $19                        513%                                                      1.9                                                     1.4
       TOILET TISSUE                        $56
           TOILET TISSUE                        $56         386%                                                        1.7                                                  1.3
      FOILS & WRAPS       $7
          FOILS & WRAPS       $7                                636%                                                 1.6                                                     1.3
            SPONGES      $4
               SPONGES       $4                               508%                                                   1.6                                                    1.2
 FOOD & TRASH BAGS               $23
    FOOD & TRASH BAGS                $23                   311%                                                     1.5                                                    1.0
      CUPS & PLATES             $20
          CUPS & PLATES             $20                    344%                                                    1.4                                                     1.0
LAUNDRY DETERGENT                 $26
   LAUNDRY DETERGENT                  $26                 240%                                                    1.3                                                     0.9
            PET FOOD                          $59
               PET FOOD                          $59        381%                                                  1.2                                                     0.9

                                                       Source: IRI eMarket Insights, Food + Consumables = Total Store eMI Product Universe, Does Not Include Random Weight Fresh
                                                                                                               © 2020 Information Resources Inc. (IRI). Confidential and Proprietary.     24
Online Consumables’ Share Has Spiked
Most for Personal Care and Household
Pet, Baby and Health Also Saw Significant Share Gains in the Latest 12 Weeks
Instacart Share of E-Commerce by Quad Week – Consumables Departments

                                                                                                                            6.7
                                                                                              6.4                                                         6.5

                                                                                              5.4
                                                                                                                                                          5.0

                                                                                                                            4.0
                                 3.6
    3.4
                                                               3.1
                                                               3.0
    2.5                          2.6
                                                                                              2.1                           2.3
                                                                                                                                                          1.7
                                                                                              1.5                           1.5
                                                               1.1
                                                               1.0                                                                                        1.2
    0.8
    0.7                          0.9
                                 0.8
                                                                                              0.5                           0.5                           0.3
    0.1                          0.2                           0.3
4 WE 01-26-20           4 WE 02-23-20                 4 WE 03-22-20                  4 WE 04-19-20                 4 WE 05-17-20                 4 WE 06-14-20
                     Baby                Beauty               Health               Household                   Pets               Personal Care

          Source: IRI eMarket Insights, Food + Consumables = Total Store in eMI, Excludes Random Weight Fresh, Total Market = Multi-Outlet (Brick & Mortar) + Total e-Commerce, B&M data from POS, Double Counts Removed
                                                                                                                                                       © 2020 Information Resources Inc. (IRI). Confidential and Proprietary.   25
Instacart Total Market Share Gains Are
Also Highest in Pet and Personal Care
Total Market Share Gains in These Departments
Are Also Seeing Sustained Share Gains into June
Instacart Share of Total Market* Sales by Quad Week

                                                                                            1.8

                                                                                                                          1.4                            1.5
                                                                                            1.4
                                                                                                                          1.3                            1.3
                                                                                            1.1
                                                                                                                          1.0

                                                                                                                          0.8
                                0.7                           0.7                           0.7                                                          0.7
    0.6                         0.6                                                         0.6                           0.6
    0.5                                                                                                                                                  0.6
                                                              0.5                                                                                        0.4
    0.3
    0.3                         0.3
                                0.3                           0.3                           0.3                           0.3
    0.2                         0.2                           0.2                                                                                        0.2
                                                              0.1
    0.1                         0.1
4 WE 01-26-20          4 WE 02-23-20                 4 WE 03-22-20                 4 WE 04-19-20                 4 WE 05-17-20                  4 WE 06-14-20
                    Baby               Beauty                Health               Household                  Pets               Personal Care

          Source: IRI eMarket Insights, Food + Consumables = Total Store in eMI, Excludes Random Weight Fresh, Total Market = Multi-Outlet (Brick & Mortar) + Total e-Commerce, B&M data from POS, Double Counts Removed
                                                                                                                                                       © 2020 Information Resources Inc. (IRI). Confidential and Proprietary.   26
CPG Brand Leaders Need to Invest in Retail Marketing Programs;
Brands Need to Reintroduce Their Brands to Shoppers in New Setting
Retail Shoppers Commit to Online Search and Awareness

Search – Shoppers need to find you first
• Instacart claims that by purchase number 10, +25%
  of all purchases come from “previously ordered” items
• Build your product and brand presence on the platform
• Focus on discoverability; use key words in your content
• Invest in search (e.g., featured products)
• Stay in-stock

Awareness and funnel driver
• Use delivery promotions to build baskets of
  your brands (“Get $X Off When You Buy $X of Your
  or Partner Brands)
• Use coupons and department banners to build
  awareness of your brands on Instacart

                                                            © 2020 Information Resources Inc. (IRI). Confidential and Proprietary.   27
Insights and Strategic
Guidance for Better Decisions
IRI’s Online Resources Include Real-Time
Updates and Weekly Reports That Track
the Impact of the Virus on CPG and Retail
The IRI COVID-19 lmpact
Includes COVID-19 impact analyses, dashboards
and the latest thought leadership on supply chain,
consumer behavior and channel shifts for the U.S.
AND international markets.

IRI CPG Economic Indicators, Including
the IRI CPG Demand Index™, IRI CPG
Supply Index™ and IRI CPG Inflation
Tracker™
Accessible through the insights portal
to track the daily impact of COVID-19.
This includes top-selling and out-of-stock
categories across the country and
consumer sentiment on social media.

                                                     © 2020 Information Resources Inc. (IRI). Confidential and Proprietary.   28
The Latest COVID-19 Reports and Insights from IRI (click to see full report)
      IRI COVID-19 IMPACT           THE CHANGING SHAPE                                LESSONS FROM
     ASSESSMENT REPORTS          OF THE CPG DEMAND CURVE                           THE GREAT RECESSION

                                                           © 2020 Information Resources Inc. (IRI). Confidential and Proprietary.   29
NOW INCLUDES

IRI CPG Demand Index™
                                                                                            U.S., UK, FRANCE, ITALY,
                                                                                           GERMANY & NETHERLANDS

The IRI CPG Demand Index™ provides a
standard metric for tracking changes in spending
on consumer packaged goods. It measures
weekly changes in consumer purchases, by
dollar sales, against the year-ago period across
departments, including fixed and random weight
products, grocery aisles and retail formats. The
IRI CPG Demand Index™ is available for eight
U.S. regions, all U.S. states, UK, France, Italy,
Germany and the Netherlands.

                                                                                         CLICK HERE FOR MORE!

                                                    © 2020 Information Resources Inc. (IRI). Confidential and Proprietary.   30
NOW INCLUDES

IRI CPG Inflation Tracker™
                                                                                            U.S., UK, FRANCE, ITALY,
                                                                                           GERMANY & NETHERLANDS

The IRI CPG Inflation Tracker™ provides the
well-known price per unit metric for tracking
changes in pricing of consumer packaged goods.
It provides weekly changes in consumer prices,
price per unit against the year-ago period across
departments, including fixed and random weight
products, grocery aisles and retail formats. The
IRI CPG Inflation Tracker™ is available for eight
U.S. regions, all U.S. states, UK, France, Italy,
Germany and the Netherlands.

                                                                                         CLICK HERE FOR MORE!

                                                    © 2020 Information Resources Inc. (IRI). Confidential and Proprietary.   31
NOW INCLUDES
IRI CPG Supply                 Index™                                                           U.S. AND ITALY

The IRI CPG Supply Index™ provides a
standard metric for tracking changes in
product availability (i.e., in-stock rates) in
stores for consumer packaged goods. It
measures weekly changes in product
availability against the baseline across
departments and retail formats. The IRI
CPG Supply Index™ is available for eight
U.S. regions, all U.S. states and Italy.

                                                                                      CLICK HERE FOR MORE!

                                                 © 2020 Information Resources Inc. (IRI). Confidential and Proprietary.   32
Want to Be the First to Know?

                                www.iriworldwide.com/en-US/Insights/Subscribe

                                        Registered Users Get New
                                        Thought Leadership from IRI’s
                                        Research, Data & Analytics Experts

                                                  © 2020 Information Resources Inc. (IRI). Confidential and Proprietary.   33
IRI Global Headquarters
 CONTACT US   150 North Clinton Street
              Chicago, IL 60661-1416
   FOR MORE   IRI@IRIworldwide.com
              +1 312.726.1221
INFORMATION   Follow IRI on Twitter: @IRIworldwide

                                                       © 2020 Information Resources Inc. (IRI).
                            © 2020 Information Resources Inc. (IRI). Confidential
                                                                     Confidential and
                                                                                  and Proprietary.
                                                                                      Proprietary.   34 34
You can also read