Tri-graph Information Propagation for Polypharmacy Side Effect Prediction
←
→
Page content transcription
If your browser does not render page correctly, please read the page content below
Tri-graph Information Propagation for
Polypharmacy Side Effect Prediction
Hao Xu1 , Shengqi Sang2,3 , and Haiping Lu1
1
Department of Computer Science, University of Sheffield, UK
2
Department of Physics and Astronomy, University of Waterloo, Canada
3
arXiv:2001.10516v1 [cs.LG] 28 Jan 2020
Perimeter Institute for Theoretical Physics, Waterloo, Ontario, Canada
hxu31@sheffield.ac.uk, s4sang@uwaterloo.ca, h.lu@sheffield.ac.uk
Abstract
The use of drug combinations often leads to polypharmacy side effects (POSE).
A recent method formulates POSE prediction as a link prediction problem on a
graph of drugs and proteins, and solves it with Graph Convolutional Networks
(GCNs). However, due to the complex relationships in POSE, this method has
high computational cost and memory demand. This paper proposes a flexible
Tri-graph Information Propagation (TIP) model that operates on three subgraphs
to learn representations progressively by propagation from protein-protein graph
to drug-drug graph via protein-drug graph. Experiments show that TIP improves
accuracy by 7%+, time efficiency by 83×, and space efficiency by 3×.
1 Introduction
When treating complex or simultaneous diseases, patients often have to take more than one drugs
concurrently, called polypharmacy. This often causes additional side effects, i.e., polypharmacy
side effects (POSE) due to interactions between drugs. Graph convolutional network (GCN) is
an emerging approach for graph representation learning [4, 6, 7]. GCN-based drug representation
learning has shown improved performance in POSE prediction [8, 9, 12, 14, 16].
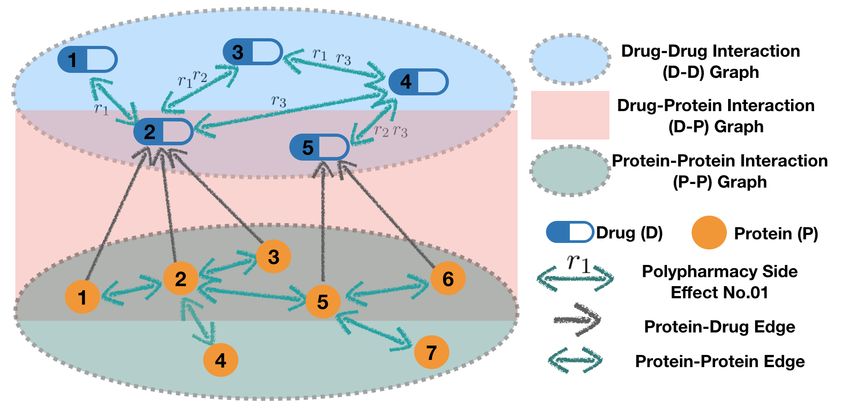
POSE prediction can be viewed as a link predic-
tion problem. As shown in Fig. 1, a multi-modal
graph can be constructed using 1) drug-drug inter-
actions (D-D) with side effects as edge labels, e.g.,
from POSE clinical records, 2) protein-drug interac-
tions (P-D) with edges labeled as t, and 3) protein-
protein interactions (P-P)) with edges labeled as b,
e.g., from pharmacological information. On such
a graph, Zitnik et al. [16] proposed a GCN-based
Decagon model to learn drug/protein representation Figure 1: A multi-modal biomedical graph
via weighted aggregation of local neighbourhood in- with two types of nodes: Drug (D) and Protein
formation, with different weights assigned to differ- (P), and three types of edges: Protein-Protein
ent edge labels. It predicts all relationships between (P-P) edges labeled with b (fixed), Protein-
all nodes (drug/protein). This formulation enables the Drug (P-D) edges labeled with t (fixed), and
prediction of side effects that have strong molecular Drug-Drug (D-D) edges labeled by a side ef-
origins. However, due to the large number of nodes fect r ∈ R.
and possible edge labels, the aggregation operation
has both high computational cost and high memory demand.
Inspired by the Decagon model and motivated by its limitations, we propose a Tri-graph Information
Propagation (TIP) model for improving prediction accuracy, and time and space efficiency, as shown
33rd Conference on Neural Information Processing Systems (NeurIPS 2019), Vancouver, Canada.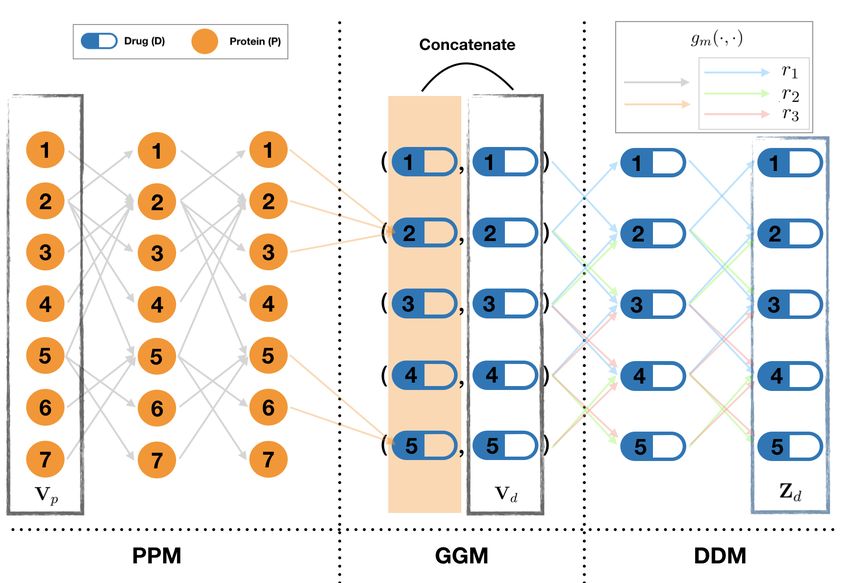
Figure 2: Information propagation in TIP encoder.

    Table 1: BioSNAP-Decagon [10] datasets. (P) denotes protein node, and (D) denotes drug node.
        Dataset                  Nodes            Edges Unique Labels Graph Name
        PP-Decagon                19081(P)         715612                   1      P-P graph
        GhG-TargetDecagon      3648(P), 284(D)      18690                   1      P-D graph
        ChChSe-Decagon             645(D)           63473                1317      D-D graph

in Fig. 2. We start from the same multi-modal biomedical graph as in [16], constructed from three
open BioSNAP-Decagon datasets [10], as detailed in Table 1. Instead of viewing the graph as a whole,
we propose to view it as three subgraphs: the P-P graph, P-D graph and D-D graph, as in Figs.1
and 2. TIP focuses on predicting relationships (side effects) in the D-D graph only rather than all
relationships in the whole graph in Decagon. Thus, we treat drug nodes and protein nodes differently.
Specifically, TIP has four steps: 1) learn protein embedding on the P-P graph; 2) propagate such
embedding to the D-D graph via the P-D graph; 3) learn the final drug embedding; 4) predict the side
effects on the D-D graph.
TIP embeds proteins and drugs into different spaces of possibly different dimensions, rather than
the same space and dimensions as in Decagon. This enables the propagation of flexible protein
embedding to drug embedding as supplementary information. This brings three key benefits: 1)
Flexibility. We design three information propagation GCN modules corresponding to the first three
TIP steps and two ways to combine protein and drug information in the P-D graph (step 2). Thus, we
have the flexibility to set the number of GCN layers to control the order of neighborhood considered in
each module. 2) Efficiency. Separate embedding of proteins and drugs can greatly improve the time
(83×) and space (3×) efficiency of GCN-based representation learning and information propagation
for them, 3) Accuracy. More focused learning of drug representation makes better use of available
data sources and can lead to improved POSE prediction, e.g., by 7.2% in our experiments.

2     Tri-graph Information Propagation (TIP)

TIP follows the popular encoder-decoder framework [4]. Figure 2 shows the structure of the TIP
encoder, within which Pharmacological information is propagated from P-P to D-D graph via P-D
graph. The drug representation is produced by combining protein embedding and other available
drug information. Further, drug embedding is used as input to the decoder to compute a set of
side-effect-specified scores. Given a side effect and a drug pair, a higher score means the side effect
is more likely to exist.
TIP Encoder: We follow the same Message Passing Neural Networks (MPNN) framework [3] as
GCN [7], Decagon [16] and R-GCNs [13]. Our Encoder can be considered as a sequence of different
                                                            p    p               d   d
MPNN cases. The protein and drug input features are Vp ∈ RN ×N and Vd ∈ RN ×N , where
N p/d is the total number of proteins/drugs.
1) P-P Graph Embedding Module (PPM): PPM is a GCN module [7] used to learn protein embed-
ding. The input of PPM module is the protein features h0 = Vp . The relation between two hidden

                                                  2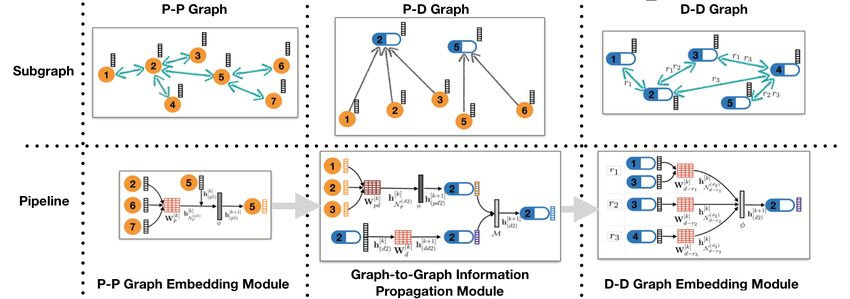
layers is given by
1 X k k
hk+1
(pi ) = ReLU( Wp h(pj ) + hk(pi ) ), (1)
ci
j∈Ni
where ci = |Ni | and i is associated with a protein node pi ∈ P .
2) Graph-to-Graph Information Propagation Module (GGM): This module takes Vd and the
protein embedding generated by PPM to learn the embedding of pharmacological information
associated with each drugs. It contains two units:
2a) Graph-to-Graph unit: a one-layer MPNN with
1 X
hH
(di ) = ReLU( Wh h(pj ) ), (2)
ci
j∈Ni
where hH
(di ) can be regraded as a higher level representation of a subset of proteins, inspired by the
subgraph embedding algorithm [1] which simply sums over the feature vectors of the involved nodes.
2b) Drug feature dimension reduction unit: A linear transformation followed by an activation function:
hD
(di ) = ReLU(Wd v(di ) ). (3)
The output of GGM hk+1
(di ) is the concatenation (TIP-cat) or the sum (TIP-sum) of hH
(di ) and hD
(di ) .
3) D-D Graph Embedding Module (DDM): This module is a R-GCN encoder with a basis-
decomposition regularization [13]. The update rule between layers is:
X X 1 X
hk+1
(di ) = ReLU
Wrk hk(dj ) + Wok hkdi Wrk = akrb Vbk , (4)
i
ci,r
r∈R j∈Nr b∈[B]
where ci,r = |Nrdi | and h0 = [hH , hD ] or hH + hD . The weight Wrk was regularized by basis-
decomposition [13], which decomposes the matrix into the linear combination of a small number of
l+1 l
basis matrices Vbk ∈ Rd ×d with side-effect-specified coefficients akrb .
TIP Decoder: TIP takes the final drug representation Zd learned from TIP encoder, and computes
the probability pi,j
r of side effect r ∈ R given a pair of drugs embedding (zi , zj ). For the POSE
task we only care about predicting edges and edge labels on the D-D graph. We consider using the
DistMult factorization [15] or a 2-layer neural network multi-label classifier as the decoder.
1) DistMult Factorization decoder (DF): For the DF decoder [15], we first compute a N d ×N d ×N r
score tensor G = {gri,j }, and then get the probability by acting the sigmoid function on it:
pij ij T
r = σ(gr ) = σ(zi Mr zj ), (5)
where Mr is a trainable diagonal matrix associated with the side effect r.
2) Neural Network Decoder (NN): NN-decoder is a multi-classifier with each side effects corre-
sponded to a classifier. It takes the concatenation of drug pair’s representations as input and embeds
it into a lower-dimensional space in the first layer. For second layer it predicts the probability of all
the possible side effects with the sigmoid function.
We will compare the performance of two decoders in the following chapter.
3 Experimental Results and Discussions
We implement TIP in PyTorch [11] with PyTorch-Geometric package [2]. The code is available at
https://github.com/NYXFLOWER/TIP. Hyper-parameter setting, model training, optimization
and performance measurement details are in the supplementary material.
Models and Baselines As shown in Table 2, we study two TIP model implementations TIP-cat and
TIP-sum with concatenation or sum in GGM, and two degenerated TIP (dTIP) models dTIPD and
dTIPP focusing on modelling drug or protein, respectively. We compare them with two recent POSE
prediction models reporting state-of-the-art performance on the same dataset: Decagon [16] and
DistMult [15] (reported by [9]). We also study R-GCN [13], which shows good performance on
standard datasets. These models are described in detail in the supplementary materials.
3Table 2: Performance comparison on the SNAP-Decagon dataset. The best result is in bold for each
evaluation metric. For Decagon, we quote the accuracy score in [16] (marked with ∗ ) and estimate
the space and time cost from sub-set implementation (indicated by + ). Acronyms are described
Secs. 2 and 3. ARCT: architecture; Mem: peak memory usage; TpE: computational time per epoch
(including training and testing score computation).
Model ARCT AUPRC AUROC AP@50 Mem(G) TpE(s)
∗ ∗ ∗
Decagon 0.832 0.872 0.803 >+ 28 >+ 9600
DistMult DF 0.835 0.859 0.834 9.25 41
R-GCN DDM-DF 0.882 0.908 0.883 10.49 82
dTIPD DDM-NN 0.791 0.847 0.792 9.49 118
dTIPP PPM-GGM-NN 0.746 0.743 0.733 6.38 29
TIP-cat PPM-GGM-DDM-DF 0.889 0.913 0.890 9.47 116
TIP-sum PPM-GGM-DDM-DF 0.890 0.914 0.890 9.47 115
Performance comparison TIP-cat and TIP-sum are the top two performers, outperforming Decagon
by 7.2+% in AUPRC and much more in AUROC and AP@50. Compared to Decagon, TIP-cat and
TIP-sum reduce Decagon’s computational time by at least 98.9% and the peak GPU usage by at
least 66.1%. TIP models achieve good performance because of the efficient information propagation
between graphs. Learning the embedding of proteins in the P-P graph is efficient as all the propagation
operations share the same trainable parameter at each layer. The most time and memory consuming
part is the drug embedding learning on D-D graph, which takes ∼ 74% of the total training time and
hits the peak GPU memory usage of 9.47G.
Learning drug embedding with pharmacological information Pharmacological information does
contain drug-drug interaction information. By using it directly in dTIPP , we can get decent result
with the shortest time. However, compared with R-GCN, additional pharmacological information
in TIP-sum only improves the performance slightly. In addition, the comparable performance of
TIP-cat and TIP-sum has an interesting implication: information propagation from PPM to GGM can
be considered as learning a higher-level representation of a subset of proteins, which captures the
relationship between proteins, and between proteins and drugs.
Drug representation learning on D-D graph Compared with DistMult that uses the dimension-
reduced drug features directly (DF), the additional use of DDM in R-GCN (i.e., DDM-DF) improves
over DF only by 5.6% (in AUPRC), and the further additional use of PPM and GGM in TIP-sum
(i.e., PPM-GGM-DDM-DF) improves over DF only by 6.6%. This is because when using DDM,
the drug can learn from its local neighborhoods and capture the relationship information. While
protein-protein interaction and protein-drug interaction are extracted as additional drug features when
using PPM-GGM. When decoding the drug embedding, The DF decoder outperforms the NN decoder
by 11.5% in accuracy and 43.9% in time cost. However, the DF decoder requires more memory than
the NN one.
Prediction of molecular-original side effects We list side effects with 20 best and worst perfor-
mance in TIP-cat in AUPRC score in Figs. 4 and 5 of the supplementary materials, which show
consistent conclusion that TIP is particularly good at modeling side effects with inter-molecular
origins. However, by comparing these side effects, we find that even if the model does not have
access to pharmacological information, it can predict the side effects with molecular origins very
well. As shown in Table 2, the R-GCN model with architecture DDM-DF achieves performance that
is competitive with TIP-cat or TIP-sum.
4 Conclusion
In this work, we proposed a new Tri-graph Information Propagation (TIP) model for predicting
more than one thousand side effects between hundreds of drugs, using pharmacological information
and drug-drug interaction clinical records. TIP has achieved state-of-the-art performance on POSE
prediction task with much less training time and memory consumption. It can be further improved by
using general optimization strategies. It can also be applied to other problems such as cancer risk or
drug response prediction.
4References
[1] David K Duvenaud, Dougal Maclaurin, Jorge Iparraguirre, Rafael Bombarell, Timothy Hirzel, Alán
Aspuru-Guzik, and Ryan P Adams. Convolutional networks on graphs for learning molecular fingerprints.
In Advances in neural information processing systems, pages 2224–2232, 2015.
[2] Matthias Fey and Jan E. Lenssen. Fast graph representation learning with PyTorch Geometric. ICLR
Workshop on Representation Learning on Graphs and Manifolds, 2019.
[3] Justin Gilmer, Samuel S Schoenholz, Patrick F Riley, Oriol Vinyals, and George E Dahl. Neural message
passing for quantum chemistry. In Proceedings of the 34th International Conference on Machine Learning-
Volume 70, pages 1263–1272. JMLR. org, 2017.
[4] William L Hamilton, Rex Ying, and Jure Leskovec. Representation learning on graphs: Methods and
applications. arXiv preprint arXiv:1709.05584, 2017.
[5] Diederik P Kingma and Jimmy Ba. Adam: A method for stochastic optimization. arXiv preprint
arXiv:1412.6980, 2014.
[6] Thomas N Kipf and Max Welling. Variational graph auto-encoders. arXiv preprint arXiv:1611.07308,
2016.
[7] Thomas N Kipf and Max Welling. Semi-supervised classification with graph convolutional networks.
International Conference on Learning Representations, 2017.
[8] Tengfei Ma, Cao Xiao, Jiayu Zhou, and Fei Wang. Drug similarity integration through attentive multi-view
graph auto-encoders. In Proceedings of the 27th International Joint Conference on Artificial Intelligence,
pages 3477–3483. AAAI Press, 2018.
[9] Brandon Malone, Alberto García-Durán, and Mathias Niepert. Knowledge graph completion to predict
polypharmacy side effects. In International Conference on Data Integration in the Life Sciences, pages
144–149. Springer, 2018.
[10] Sagar Maheshwari Marinka Zitnik, Rok Sosic and Jure Leskovec. BioSNAP Datasets: Stanford biomedical
network dataset collection. http://snap.stanford.edu/biodata, August 2018.
[11] Adam Paszke, Sam Gross, Soumith Chintala, Gregory Chanan, Edward Yang, Zachary DeVito, Zeming
Lin, Alban Desmaison, Luca Antiga, and Adam Lerer. Automatic differentiation in PyTorch. In NIPS
Autodiff Workshop, 2017.
[12] Jae Yong Ryu, Hyun Uk Kim, and Sang Yup Lee. Deep learning improves prediction of drug–drug and
drug–food interactions. Proceedings of the National Academy of Sciences, 115(18):E4304–E4311, 2018.
[13] Michael Schlichtkrull, Thomas N Kipf, Peter Bloem, Rianne Van Den Berg, Ivan Titov, and Max Welling.
Modeling relational data with graph convolutional networks. In European Semantic Web Conference, pages
593–607. Springer, 2018.
[14] Junyuan Shang, Cao Xiao, Tengfei Ma, Hongyan Li, and Jimeng Sun. Gamenet: Graph augmented memory
networks for recommending medication combination. In Proceedings of the AAAI Conference on Artificial
Intelligence, volume 33, pages 1126–1133, 2019.
[15] Bishan Yang, Wen-tau Yih, Xiaodong He, Jianfeng Gao, and Li Deng. Embedding entities and relations
for learning and inference in knowledge bases. arXiv preprint arXiv:1412.6575, 2014.
[16] Marinka Zitnik, Monica Agrawal, and Jure Leskovec. Modeling polypharmacy side effects with graph
convolutional networks. Bioinformatics, 34(13):i457–i466, 2018.
5Supplementary Materials
This is the supplementary material, including detailed problem formulation, notation, information propagation
between nodes and graphs in TIP, model variants definitions, experimental setup and results.
5 Problem Formulation and Notation
As shown in Figure.1, we construct a large multi-modal biomedical graph with Drug (D) nodes and Protein (P)
nodes for polypharmacy side effect modeling. Given a set of drugs Vd = {di }i∈[N d ] , a set of proteins Vp =
{pi }i∈[N p ] and a set of side effects R = {ri }i∈[N r ] , where N d/p/r is the total number of drugs/proteins/side
effects, the graph can be denoted as G = {V, E}, where V = {vi |vi ∈ Vd ∪ Vp }.
In the graph G, edges are directed and labeled: E = {(vi , q, vi )}, vi , vj ∈ V and l is a label of edges (q will be
defined below). There are three edge types: protein-protein (P-P) edges , drug-protein (P-D) edges and drug-drug
(D-D) edges, the labels of edges are associated with different edge types. Corresponding to the edge types, there
are three subgraphs:
1. Undirected P-P graph: Gp = {Vp , Ep }. The edges Ep = (pi , b, p) are labeled with b, pi , pj ∈ Vp .
2. Undirected D-D graph: Gd = {Vd , Ed }, where Ed = {(di , rk , dj )} means that a pair of drugs
(di , dj ) can cause multi-pharmacy side effect rk .
3. Directed D-P graph: Gh = {V, Eh }, Eh = pi , t, di is a set of edges directed from a protein to a drug
with edge label t.
As shown above, the Gp /Gh have the same label b / t, but the label of Gd is chosen from R, where each ri ∈ R
represents a side effect. Note that between a pair of drugs there might be more than one links with different
labels (a pair of drug might cause more than one side effects). Use Q = {q|q ∈ {b, t} ∪ R} represents all kinds
of labels.
We here consider POSE prediction task as a graph completion problem which aims to find the undiscovered
edges and labels on the graph. Specifically, we extract the representation of the drugs from the defined graph G
i.e. Hd = {hdi |di ∈ D}, and predict the probability of all possible side effects of a queried drug pair (di , dj ),
i.e. {Prk (di , dj )|rk ∈ R}.
6 TIP Encoder Design - An MPNN Framework Perspective
In our TIP encoder, each module corresponding to a special case of the Message Passing Neural Networks
(MPNN) framework [3] on a graph. A simple differentiable MPNN framework on a graph G0 = {V 0 , E 0 } is:
(l+1)
X (l)
hi = σ( gm (hi , Ni )), (6)
m∈Mi
where i is associated with a node vi ∈ V 0 . The input of the framework h(0) is a node feature vector, and
(l) (l)
hi ∈ Rd is the hidden state of this node in the lth layer of the neural network. Mi is the set of type-specified
message passed in the form of gm (·, ·) related to node vi , and gm (·, ·) is typically a neural network-like function
of the node state vi and its neighborhood Ni .
Inspired by this architecture, we define the tri-graph interaction propagation (TIP) encoder for calculating the
update in each graphs forwardly. Figure.3 shows an example for information propagation between nodes and
graphs in a TIP-cat implementation.
7 Detail of Models
The number of layers for PPM, GGM and DDM are set to (2, 1, 2) in all the experiments.
TIP-cat and TIP-sum They both use a two-layer PPM with d1p = 32 and d2p = 16, a one-layer GGM
and a two-layer DDM with d1d = 32, d2d = 16 and base number dbd = 16. Their difference lies in the choice
of aggregation function in GGM: TIP-cat uses concatenation with dpg = 16, ddg = 48, while TIP-sum uses
summation with dpg = ddg = 64.
R-GCN It’s composed of a two-layer DDM with d1d = 32, d2d = 16 and a DistMult Factorization (DF)
decoder. It models the D-D graph directly and is a special case of generic R-GCN for multi-relational link
prediction [13].
6Figure 3: An example of information propagation between nodes and graphs in a TIP-cat implemen-
tation with a 2-layer PPM, a GGM with concatenation operation and a 2-layer DDM.
dTIPD It uses the same DDM as DR-DF, and does not use any protein information. Drug embeddings are
learned from DR module, and a 2-layer neural network multi-classifier with d1n = 16, d2n = 964 is used as a
decoder.
dTIPP This variant uses the protein information and relationship information between drugs and proteins
only to predict drug side effects. It uses a two-layer PPM with d1p = 32 and d2p = 16, a one-layer GGM
dpg = 16, ddg = 48 with concatenation, and the same two layer NN decoder as DDM-NN.
8 Experimental Setup
Loss Function and Negative Sampling We use cross-entropy loss to optimize model, aiming to assign
higher probabilities to observed edges and lower probabilities to undiscovered ones. Given a set of positive
samples Ep0 = {(di , r, dj )|r ∈ R} , the negative samples En0 are sampled randomly from R until E 0 n∩E 0 p = ∅
[7].
Training and Testing data We pre-processed the whole dataset (See 1) by removing the side effects with
less than 500 occurrence in the dataset.1 For each side effect, we use 80% of the total edges in D-D graph for
model training and the remaining 20% for testing.
Optimization We use the Adam optimizer [5] with learning rate of 0.01 and train for 100 epochs for all the
experiments. The TIP model is optimized end-to-end which means all trainable parameters in both encoder and
decoder are trained together. Due to the Graph-to-Graph information propagation architecture of TIP model, the
memory cost is much less than Decagon model [16]. TIP model therefore is optimized by full-batch, which
means the whole dataset is fed into the model in each epoch.
Model Implementation We implement our TIP model in PyTorch [11] with the PyTorch-Geometric
package [2]. The evaluation of peak GPU memory usage uses the tools provided by pytorch_memlab package2 .
Performance Measurement We measure the performance using: 1) AUPRC: area under precision-recall
curve, 2) AUROC: area under the receiver-operating characteristic, and 3) AP@k: average precision for the top
k predictions for each side effect. 4) The computing cost (i.e. training time and peak GPU memory usage) .
1
It’s the same pre-processing as in Zitnik et al. [16]
2
https://github.com/Stonesjtu/pytorch_memlab
79 Prediction of Molecular-original Side Effects
We visualize the top 20 best and worst performance side effects in the DDM-DF model as shown in 4 and 5. Via
comparing these figures, we find that even if model does not have pharmacological information, they can predict
the side effects which have molecular origins very well. See more discussion in the main body.
Figure 4: Side effects with the top 20 best and worst performance in TIP-cat on AUPRC scores. The
side effects marked with red rectangular is in the side effect rank of the top 10 best/worst performance
in [16]
Figure 5: Side effects with the top 20 best and worst performance in DDM-DF model on AUPRC
scores. The side effects marked with red rectangular is in the side effect rank of the top 10 best/worst
performance in [16]
8You can also read