INSTITUTIONAL RESEARCH - Biotechnology PRICE TARGET CHANGE - Dawson James Securities
←
→
Page content transcription
If your browser does not render page correctly, please read the page content below
INSTITUTIONAL RESEARCH
                                                                                                         Biotechnology
                                                                                                     PRICE TARGET CHANGE
            Member FINRA/SIPC
 Toll-Free: 561-391-5555 ⬧ www.DawsonJames.com ⬧ 101 North Federal Highway - Suite 600 ⬧ Boca Raton, FL 33432

Mesoblast (NASDAQ/MESO, ASX/MSB)
                                                                                                                      January 22, 2021
BUY: Yes…DDD Results are Ahead – What’s Priced In?
                                                                                                                      Jason Kolbert
                                                                                                                 Healthcare Research
The key question is, do you believe that Regenerative Medicine works? If so, can a recent
string of technical trial misses (narrow failures to achieve p-values on the primary endpoint)            jkolbert@dawsonjames.com
be explained by adjusting our understanding of which patients benefit the most from cell
therapy? We think so, yes. We strongly believe that Mesoblast’s Revascor is a viable heart
failure therapy and that remestemcel has efficacy in GvHD. So, what’s next? The Degenerative
Disc Disease (DDD) trial. We view the outcome of this trial as very tough to predict, and in
fact, have a negative bias. The challenge is for cells to work in what we consider to be a hostile
environment, the intervertebral space. Expectations are low, and failure appears to be
“mostly” priced into the stock. We adjust our probability of success down to 50% in our
revenue model, which drives a price target reduction from $20.00 to $16.00.

Investment Highlights:
A New Treatment Paradigm in Back Pain – Moving Beyond Steroids and
Opiates. From the time man crawled out of the primordial ooze and stood upright as
a biped, back pain followed. Chronic lower back pain (CLBP) likely results in more
disabilities than just about any other condition. With the recognition of the hazards
of prescribing opiates to treat pain (the symptom), versus addressing the underlying
cause, such as a herniated disc and in its final stages, spinal fusion (surgery), a new
modality is needed. Mesoblast’s CLBP hopes to be part of the solution, literally
swapping cells for steroids for injection into the intra-vertebral space, supporting
repair of the underlying cause, disc herniation, and the resulting inflammation.

The Heart Failure Trial. Top-line data from the Phase 3 trial of Revascor in
Congestive Heart Failure Patients showed that over a mean 30 months of follow-up,
patients with advanced chronic heart failure who received a single endomyocardial
treatment with rexlemestrocel-L on top of maximal therapies had 60% reduction in
incidence of heart attacks or strokes and 60% reduction in death from cardiac causes
when treated at an earlier stage in the progressive disease process. Unfortunately,
and despite the significant reduction in the pre-specified endpoint of cardiac death,
there was no reduction in recurrent non-fatal decompensated heart failure events,
which was the trial's primary endpoint.

GvHD Trial. Back in October, Mesoblast received a Complete Response Letter
(CRL) regarding the Biologics License Application (BLA) for remestemcel-L for the
treatment of pediatric steroid-refractory acute graft versus host disease (SR-
aGVHD). On the surface, this is surprising given the Oncologic Drugs Advisory
Committee (ODAC) voted 9:1 that the available data support the efficacy of
remestemcel-L in pediatric patients with SR-aGVHD. So, what happens now? The
FDA wants one additional randomized, controlled study in adults and children to
provide further evidence of the effectiveness of remestemcel-L. Still, given the lack
of approved treatments for this life-threatening condition in children under 12,
Mesoblast plans to seek an accelerated approval with a post-approval condition that
could satisfy regulators.

Risk to our thesis, include the following: (1) clinical and regulatory; (2)
commercial; (3) employee; (4) financial; (5) legal and intellectual property; and (6)
partnership. We review these and other risks in the risk section of this report.

                                    Please find Important Disclosures beginning on Page 7.
                                                                     Page 1 of 8
www.dawsonjames.com
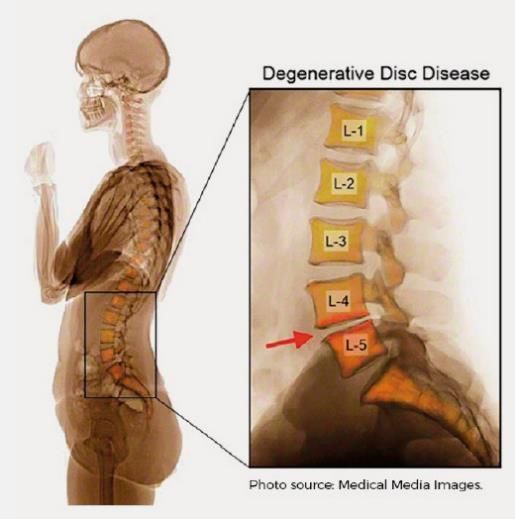
Chronic Lower Back Pain (CLBP) is most commonly caused by disruption to the discs found in between vertebrae. These fluid-filled
discs give people movement and stability in their everyday lives. When the nerves surrounding these discs are damaged, causing an
inflammatory response, it causes chronic pain and functional disability. This damage can be caused by trauma, genetic predisposition,
or aging and affects more than 3.2 million people in the United States alone.
Exhibit 1. The Effect of Degenerative Disc Disease on Spinal Vertebrae
The Current Standard of Care for CLBP focuses on masking the pain rather than treating the problem at its core. All treatment options
provide patients with short term solutions to their pain with the intention of temporarily minimizing it. Ibuprofen is a common relief to
this problem, with more extreme solutions being major back surgery for long term management. Opioids are commonly prescribed in
order to relieve the pain associated with degenerative disc disease. In fact, more than half of the prescriptions for opioids are for people
with this condition. Opioids have recently been declared a public health emergency due to their addictive qualities, leading to the need
for a non-addictive solution.
MPC-06-ID is a Phase 3 drug intended for the treatment of CLBP due to disc degeneration. The product will be injected directly into
the patient's damaged disc, using only 6 MPCs. MPC-06-ID will act as an anti-inflammatory, triggering the creation of new proteoglycan
and collagen in order to regenerate the disc. Therefore, this drug does not aim to simply cover the pain, but rather strengthen the disc in
order to resolve the problem at its core.
Phase 3 Trial. Mesoblast has completed enrollment for the pivotal (Phase 3 trial). The trial is evaluating n ̴ 404 patients with CLBP
due to disc degeneration. The primary endpoints would be pain relief as well as a 50% reduction in lower back pain. While seemingly
subjective, these factors would be measured using Visual Analog Score and a 15-point improvement in the Oswestry Disability Index,
ensuring the objective nature of the data. Overall Treatment Success Composites will be measured both at 12 months and 24 months,
with no additional treatments over the course of time.
Phase 2 Trial. The Phase 2 trial of MPC-06-ID had several primary endpoints: efficacy, medication usage, and quality of life
improvement measures. There were 100 patients enrolled; each suffered from CLBP due to disc degeneration for at least sixth months
prior to the trial. After the injection of MPC-06-ID, patients saw statistically significant improvements in pain and function up to three
years after.
Modeling Assumptions for Degenerative Disc Disease (DDD)
1. We assume market share penetration for Back Pain & Related Disc Repair to be 5% in 2023 and increase to 24% in 2030.
2. We assume that the market size will increase by 0.5% annually.
3. We assume the probability of success for all CLBP patients to be 50%.
4. We assume the cost of therapy to be $10,040 in 2018 and grow 0.2% each year to reach $10,284 in 2030.
Mesoblast 1/22/2020 Page 2 of 8www.dawsonjames.com
Exhibit 2. DDD Model. We apply a 50% risk cut to the model below.
Back Pain & Related Disc Repair 2018 2019 2020 2021 2022 2023 2024 2025 2026 2027 2028 2029 2030
Back Pain Prevalance 30,452,254 30,604,515 30,757,538 30,911,325 31,065,882 31,221,211 31,377,317 31,534,204 31,691,875 31,850,334 32,009,586 32,169,634 32,330,482
Market Size Growth (Annual) 0.5% 0.5% 0.5% 0.5% 0.5% 0.5% 0.5% 0.5% 0.5% 0.5% 0.5% 0.5% 0.5%
5% Patients Considered Candidates for Therapy 1,522,613 1,530,226 1,537,877 1,545,566 1,553,294 1,561,061 1,568,866 1,576,710 1,584,594 1,592,517 1,600,479 1,608,482 1,616,524
Patients which qualify 25.0% 25.0% 25.0% 25.0% 25.0% 25.0% 25.0% 25.0% 25.0% 25.0% 25.0% 25.0% 25.0%
Target Market 380,653 382,556 384,469 386,392 388,324 390,265 392,216 394,178 396,148 398,129 400,120 402,120 404,131
Market Share Penetration 0.0% 0.0% 0.0% 0.0% 0.0% 5.0% 10.0% 15.0% 20.0% 22.0% 24.0% 24.0% 24.0%
Number of Patients Procedures 0 0 0 0 0 19,513 39,222 59,127 79,230 87,588 96,029 96,509 96,991
Cost of Therapy $ 10,040 $ 10,060 $ 10,080 $ 10,100 $ 10,121 $ 10,141 $ 10,161 $ 10,181 $ 10,202 $ 10,222 $ 10,243 $ 10,263 $ 10,284
Price Growth 0.2% 0.2% 0.2% 0.2% 0.2% 0.2% 0.2% 0.2% 0.2% 0.2% 0.2% 0.2% 0.2%
Probability of Success 50% 50% 50% 50% 50% 50% 50% 50% 50% 50% 50% 50% 50%
U.S. Annual Sales (M) $ - $ - $ - $ - $ - $ 99 $ 199 $ 301 $ 404 $ 448 $ 492 $ 495 $ 499
Source: Dawson James estimates
Valuation: Our valuation methodology begins with our projected revenues from our product models, which are adjusted by a
“probability of success or risk factor.” We apply assumptions for the timing of approval, launch dates, and product attributes to estimate
revenues. These estimates feed into our income statement through the year 2030. The result of these projections is then fed into our
income statement projections. Our price target is derived from an equal-weighted average of free cash flow to the firm (FCFF),
discounted EPS (EPS), and sum-of-the-parts (SOP) models. A 30% discount is then applied and rounded to the nearest whole number
to derive our price target. A higher risk rate of 30% is applied (vs. 15% or 10%) since Mesoblast is a microcap company with drug
candidates in clinical trials that have yet to gain FDA approval.
Exhibit 3. Free Cash Flow Model
Average $ 16
Price Target $ 16
Year 2021
DCF Valuation Using FCF (mln):
units (millions - $) 2020E 2021E 2022E 2023E 2024E 2025E 2026E 2027E 2028E 2029E 2030E
EBIT (75) (117) (122) 21 390 921 2,070 2,901 3,634 3,664 3,692
Tax Rate 3% 0% 0% 15% 25% 30% 35% 36% 36% 36% 36%
EBIT(1-t) (73) (117) (122) 18 293 645 1,345 1,857 2,326 2,345 2,363
CapEx
Depreciation
Change in NWC
FCF (73) (117) (122) 18 293 645 1,345 1,857 2,326 2,345 2,363
PV of FCF (95) (117) (94) 11 133 226 362 385 371 287 223
Discount Rate 30%
Long Term Growth Rate 1%
Free Cash Flow 8,229
Terminal Value YE 2030 776
NPV 2,469
NPV-Debt 84
Shares out (M) 146 2030E
NPV Per Share $ 16
Source: Dawson James estimates, company reports
Exhibit 4. Discounted-EPS Model
2021 Discount Rate and Earnings Multiple Varies, Year is Constant
Year of EPS 2030 2030 EPS
Earnings Multiple 10 15 10% 15% 20% 25% 30% 35%
Discount Factor 30% 1 $6.87 $4.60 $3.14 $2.17 $1.53 $ 1.09
Selected Year EPS $ 16.20 5 $34.34 $23.02 $15.69 $10.87 $7.64 $ 5.44
NPV $ 15 10 $68.69 $46.04 $31.39 $21.74 $15.27 $ 10.87
Earnings 15 $103.03 $69.06 $47.08 $32.61 $22.91 $ 16.31
Multiple 20 $137.38 $92.08 $62.78 $43.48 $30.55 $ 21.75
25 $171.72 $115.10 $78.47 $54.35 $38.18 $ 27.19
30 $206.06 $138.12 $94.17 $65.22 $45.82 $ 32.62
35 $240.41 $161.14 $109.86 $76.08 $53.46 $ 38.06
Source: Dawson James estimates
Mesoblast 1/22/2020 Page 3 of 8www.dawsonjames.com
Exhibit 5. Sum-of-the-Parts Model
Mesoblast Sum of the Parts LT Gr Dis count Rate Yrs . to Mkt % Succes s Peak Sales MM's NPV
Revas cor - CHF (Clas s II - III) U.S. 1% 30% 4 25% $5,152 $17,766
NPV $5.33
Revas cor - CHF - LVAD: Clas s IV 1% 30% 2 25% $361 $1,246
NPV $0.63
Revas cor - CHF (Clas s II - III) EU 1% 30% 5 25% $3,895 $13,431
NPV $3.10
Acute Pediatric GvHD - U.S. 1% 30% 0 100% $142 $490
NPV $1.68
Acute Adult GvHD U.S. 1% 30% 4 100% $319 $1,101
NPV $1.32
Acute Pediatric GvHD - E.U. 1% 30% 3 100% $101 $350
NPV $0.55
Acute Adult GvHD E.U. 1% 30% 3 100% $383 $1,322
NPV $2.06
CLBD-DDD U.S. 1% 30% 2 30% $984 $3,392
NPV $2.06
TEMCELL 1% 10% 0 75% $20 $222
NPV $0.57
Other Indications 1% 30% 5 30% $0 $0
NPV $0.00
Net Margin 50%
MM Shrs OS 2030E 146
Total $17
Source: Dawson James estimates
Mesoblast 1/22/2020 Page 4 of 8www.dawsonjames.com
Exhibit 6. Income Statement
Mesoblast, Inc. Income Statement (M)
Mesoblast: YE June 30 2019A 2020E 2021E 2022E 2023E 2024E 2025E 2026E 2027E 2028E 2029E 2030E
Milestone / Partnership Revenues 14
% Sequential Growth
Revasco in CHF U.S. - - - - 153 383 768 1,156 1,546 1,550 1,555
% Sequential Growth
Revascor in CHF; EU - - - - - - - 498 832 1,169 1,172 1,176
% Sequential Growth
Discogenic Disc Chronic Lower Back (U.S.) - - 99 199 301 404 448 492 495 499
% Sequential Growth
Remestemcel-L GvHD - USA - Pediatric 1 - - - 44 86 124 137 139 142 145 148
% Sequential Growth
Remestemcel-L GvHD - USA - Acute Adult - - - - - 102 198 288 313 319 326 332
% Sequential Growth
Remestemcel-L GvHD - EU Pediatric - - - - 33 65 82 98 99 101 104 104
% Sequential Growth
Remestemcel-L GvHD - EU Acute Adult - - - - - - 119 230 352 383 391 399
% Sequential Growth
Product Revenues 15 12 - - 177 605 1,207 2,422 3,340 4,152 4,183 4,211
TemCell GvHD - Japan Adult & Pediatric 1 7 7 9 11 12 13 14 16 17 18 19
Product & Royalty Revnues 17 22 7 9 187 616 1,220 2,437 3,355 4,169 4,200 4,231
Expenses
MesoBlast COGS - - - - 35 91 169 242 334 415 418 421
COGS % Sales 0% 0% -20% -15% -14% -10% -10% -10% -10% -10%
R&D 60 63 66 69 73 76 73 69 65 66 67 67
Manufacturing & Commercialization 15 16 32 26 21 20 19 18 18 17 16 16
Management & Adminastration 22 13 25 36 37 39 38 38 37 36 35 35
Total expenses 97 92 124 131 166 226 299 367 454 534 537 539
Oper. Inc. (Loss) (80) (70) (117) (122) 21 390 921 2,070 2,901 3,634 3,664 3,692
Oper Margin
Fair Value Remeasurement (contingent consideration) (6)
Finance Cost/Interest Expense
Changes in the fair value of available-for-sale financial assets
Exchange differences on translation of foreign operations (1)
Interest Payments (11) (0) - - - - - - - -
Other comprehensive loss/income for the period, net of tax
Total other income (20) 5 - - - - - - - - - -
Pre-tax income (105) (75) (117) (122) 21 390 921 2,070 2,901 3,634 3,664 3,692
Pretax Margin
Tax benefit (or expense) 9 2 - - (3) (98) (276) (724) (1,044) (1,308) (1,319) (1,329)
Tax Rate 3% 0% 0% 15% 25% 30% 35% 36% 36% 36% 36%
Net Income (97) (73) (117) (122) 18 293 645 1,345 1,857 2,326 2,345 2,363
Net Margin
EPS $ (0.72) $ (0.63) $ (0.83) $ (0.86) $ 0.13 $ 2.05 $ 4.51 $ 9.37 $ 12.88 $ 16.07 $ 16.14 $ 16.20
Non GAAP EPS (dil)
Wgtd Avg Shrs (Bas) - '000s 106 117 141 141 142 142 143 144 144 145 145 146
Wgtd Avg Shrs (Dil) - '000s 106 117 141 141 142 142 143 144 144 145 145 146
Source: Dawson James estimates, company reports
Mesoblast 1/22/2020 Page 5 of 8www.dawsonjames.com
Risk Analysis
In addition to the typical risks associated with development stage specialty pharmaceutical companies, potential risks specific to
Mesoblast are as follows:
Clinical and regulatory risk. Lead products must start and complete clinical trials. Trials may not produce results sufficient for
regulatory approval.
Commercial risk. There are no assurances that the company will be able to secure favorable pricing, commercially launch products,
and achieve significant market share to become profitable.
Employee risk. Mesoblast has an experienced and dedicated management team, many of whom have been with the company since
its founding. The company plans to bring its proposed products to market in the next two years, and as such, transitioning from a
clinical to a commercial team will be a critical success factor. The success of the business may depend on the experience, abilities,
and continued services of its senior officers, sales staff, and key scientific personnel.
Financial risk. The company may need to raise capital in the marketplace in order to support operations. There are no assurances
that the company will be able to successfully raise capital and or do so on favorable terms.
Legal and intellectual property risk. The company may have to defend its patents and technical know-how, and there can be no
assurances that the patents will not be infringed or will be held as valid if challenged, and or that the company may infringe on third
parties’ patents.
Partnership risk. Mesoblast may seek partnerships for clinical development support and commercialization. We have no specific
knowledge of any discussions with possible partners today, and there can be no assurances that the company will be able to secure a
favorable partnership.
Important Disclosures:
Companies that May Be Mentioned in this report which Mesoblast has worked with or which may be relative to Mesoblast
include the list below. None of these companies are rated.
BlueBird
Cephalon
Grunethal
JCR Pharma
Juno
Kite
Lonza
Novartis
Osiris
Takeda (which acquired Tigenix)
Teva
Tasly
Mesoblast 1/22/2020 Page 6 of 8www.dawsonjames.com
Price Chart:
Price target and rating changes over the past three years:
Initiated – Buy – December 19, 2019 – Price Target $14.00
Update – Buy – January 16, 2020 – Price Target $14.00
Update – Buy – January 28, 2020 – Price Target $15.00
Update – Buy – February 3, 2020 – Price Target $15.00
Update – Buy – February 28, 2020 – Price Target $15.00
Update – Buy – March 10, 2020 – Price Target $15.00
Update – Buy – April 1, 2020 – Price Target $15.00
Update – Buy – April 6, 2020 – Price Target $15.00
Update – Buy – April 17, 2020 – Price Target $15.00
Update – Buy – April 24, 2020 – Price Target $15.00
Update – Buy – May 1, 2020 – Price Target $15.00
Update – Buy – May 6, 2020 – Price Target $15.00
Update – Buy – May 26, 2020 – Price Target $15.00
Update – Buy – May 28, 2020 – Price Target $15.00
Update – Buy – July 30, 2020 – Price Target $15.00
Price Target Change – Buy – August 24, 2020 – Price Target Increased to $20.00 from $15.00
Update – Buy – September 2, 2020 – Price Target $20.00
Update – Buy – October 2, 2020 – Price Target $20.00
Update – Buy – October 13, 2020 – Price Target $20.00
Update – Buy – November 20, 2020 – Price Target $20.00
Update – Buy – December 8, 2020 – Price Target $20.00
Update – Buy – December 15, 2020 – Price Target $20.00
Update – Buy – December 18, 2020 – Price Target $20.00
Price Target Change – Buy – January 22, 2021 – Price Target lowered to $16.00 from $20.00
Dawson James Securities, Inc. (the "Firm") is a member of the Financial Industry Regulatory Authority ("FINRA") and the Securities
Investor Protection Corporation ("SIPC").
The Firm does not make a market in the securities of the subject company(s). The Firm has NOT engaged in investment banking
relationships with MESO in the prior twelve months, as a manager or co-manager of a public offering and has NOT received
compensation resulting from those relationships. The Firm may seek compensation for investment banking services in the future from
the subject company(s). The Firm has NOT received other compensation from the subject company(s) in the last 12 months for services
unrelated to managing or co-managing of a public offering.
Neither the research analyst(s) whose name appears on this report nor any member of his (their) household is an officer, director or
advisory board member of these companies. The Firm and/or its directors and employees may own securities of the company(s) in this
report and may increase or decrease holdings in the future. As of December 31, 2020, the Firm as a whole did not beneficially own 1%
or more of any class of common equity securities of the subject company(s) of this report. The Firm, its officers, directors, analysts or
Mesoblast 1/22/2020 Page 7 of 8www.dawsonjames.com
employees may affect transactions in and have long or short positions in the securities (or options or warrants related to those securities)
of the company(s) subject to this report. The Firm may affect transactions as principal or agent in those securities.
Analysts receive no direct compensation in connection with the Firm's investment banking business. All Firm employees, including the
analyst(s) responsible for preparing this report, may be eligible to receive non-product or service specific monetary bonus compensation
that is based upon various factors, including total revenues of the Firm and its affiliates as well as a portion of the proceeds from a broad
pool of investment vehicles consisting of components of the compensation generated by investment banking activities, including but
not limited to shares of stock and/or warrants, which may or may not include the securities referenced in this report.
Although the statements in this report have been obtained from and are based upon recognized statistical services, issuer reports or
communications, or other sources that the Firm believes to be reliable, we cannot guarantee their accuracy. All opinions and estimates
included in this report constitute the analyst's judgment as of the date of this report and are subject to change without notice.
Information about valuation methods and risks can be found in the "VALUATION" and "RISK ANALYSIS" sections of this
report.
The securities of the company discussed in this report may be unsuitable for investors depending on their specific investment objectives
and financial position. This report is offered for informational purposes only and does not constitute an offer or solicitation to buy or
sell any securities discussed herein in any jurisdiction where such would be prohibited. Additional information is available upon request.
Rating Definitions:
1) Buy: The analyst believes the price of the stock will appreciate and produce a total return
of at least 20% over the next 12-18 months;
2) Neutral: The analyst believes the price of the stock is fairly valued for the next 12-18
months;
3) Sell: The analyst believes the price of the stock will decline by at least 20% over the next
12-18 months and should be sold.
The following chart reflects the range of current research report ratings for all companies followed by the analysts of the Firm. The
chart also reflects the research report ratings relating to those companies for which the Firm has performed investment banking services.
Company Coverage Investment Banking
Ratings Distribution # of Companies % of Total # of Companies % of Totals
Market Outperform (Buy) 22 79% 2 9%
Market Perform (Neutral) 6 21% 0 0%
Market Underperform (Sell) 0 0% 0 0%
Total 28 100% 2 7%
Analyst Certification:
The analyst(s) whose name appears on this research report certifies that 1) all of the views expressed in this report accurately reflect his
(their) personal views about any and all of the subject securities or issuers discussed; and 2) no part of the research analyst's
compensation was, is, or will be directly or indirectly related to the specific recommendations or views expressed by the research analyst
in this research report; and 3) all Dawson James employees, including the analyst(s) responsible for preparing this research report, may
be eligible to receive non-product or service specific monetary bonus compensation that is based upon various factors, including total
revenues of Dawson James and its affiliates as well as a portion of the proceeds from a broad pool of investment vehicles consisting of
components of the compensation generated by investment banking activities, including but not limited to shares of stock and/or warrants,
which may or may not include the securities referenced in this report.
Mesoblast 1/22/2020 Page 8 of 8You can also read