Acting on Insight Tips for developing and optimizing scientific applications 28/06/2019 - VI-HPS
←
→
Page content transcription
If your browser does not render page correctly, please read the page content below

Acting on Insight
Tips for developing and optimizing
             scientific applications

             Florent.Lebeau@arm.com
                          28/06/2019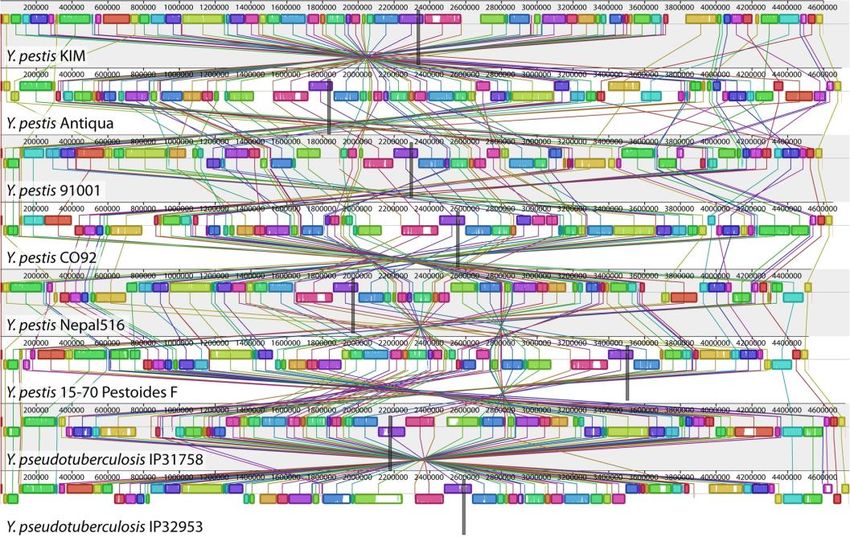
Agenda

•   Introduction
•   Maximize application efficiency
•   Analyze code performance
•   Profile multi-threaded codes
•   Optimize Python-based applications
•   Visualize code regions with Caliper

2    © 2019 Arm Limited

Arm Technology Already Connects the World

        Arm is ubiquitous               Partnership is key                  Choice is good
        21 billion chips sold by       We design IP, we do not      One size is not always the best fit
           partners in 2017             manufacture chips                         for all
    #1 in Infrastructure today with   Partners build products for         HPC is a great fit for
           28% market shares             their target markets         co-design and collaboration

3      © 2019 Arm Limited
Arm’s solution for HPC application development and porting
Combines cross-platform tools with Arm only tools for a comprehensive solution
    Cross-platform Tools         Arm Architecture Tools

               FORGE             C/C++ & FORTRAN
         DDT             MAP        COMPILER

    PERFORMANCE                   PERFORMANCE
      REPORTS                       LIBRARIES

4   © 2019 Arm Limited
The billion dollar question in “weather and forecasting”
Is it going to rain tomorrow?
       1. Choose domain         2. Gather Data   3. Create Mesh

    4. Match Data to Mesh        5. Simulate      6. Visualize

5    © 2019 Arm Limited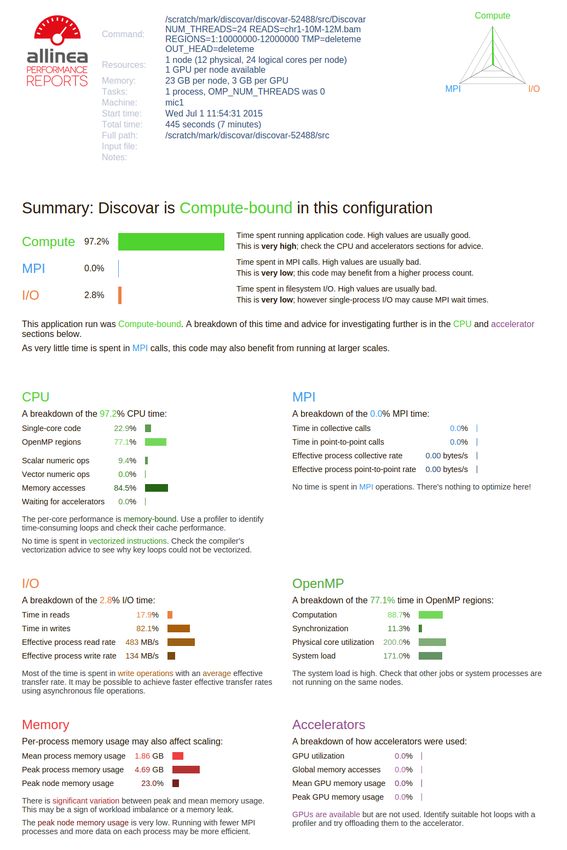
Weather forecasting workflow
                                            Deploy
                          Production                        Staging
                                                          environment
                                                                              Builds
    Scalability

                                    Performance

          Develop
            Fix                                      Regressions        CI Agents
          Optimize

        Commit            Version                     Continuous
                                                      integration       Start CI job
                          control
                          system
                                         Pull         framework

                         • 24 hour timeframe
6   © 2019 Arm Limited
                         • 2 to 3 test runs for 1 production run
Application efficiency

    Scientist                       Developer                    System admin                Decision maker
    • Efficient use of allocation   • Characterize application   • Maximize resource usage   • High-level view of system
      time                            behaviour                  • Diagnose performance        workload
    • Higher result throughput      • Gets hints on next           issues                    • Reporting figures and
                                      optimization steps                                       analysis to help decision
                                                                                               making

7      © 2019 Arm Limited
Arm Performance Reports
Characterize and understand the performance of HPC application runs
                             Gathers a rich set of data
                                •   Analyses metrics around CPU, memory, IO, hardware counters, etc.
    Commercially supported      •   Possibility for users to add their own metrics
          by Arm

                             Build a culture of application performance & efficiency awareness
                                •   Analyses data and reports the information that matters to users
      Accurate and astute       •   Provides simple guidance to help improve workloads’ efficiency
            insight

                             Adds value to typical users’ workflows
                                • Define application behaviour and performance expectations
                                • Integrate outputs to various systems for validation (e.g. continuous
       Relevant advice
       to avoid pitfalls
                                  integration)
8     © 2019 Arm Limited
                                • Can be automated completely (no user intervention)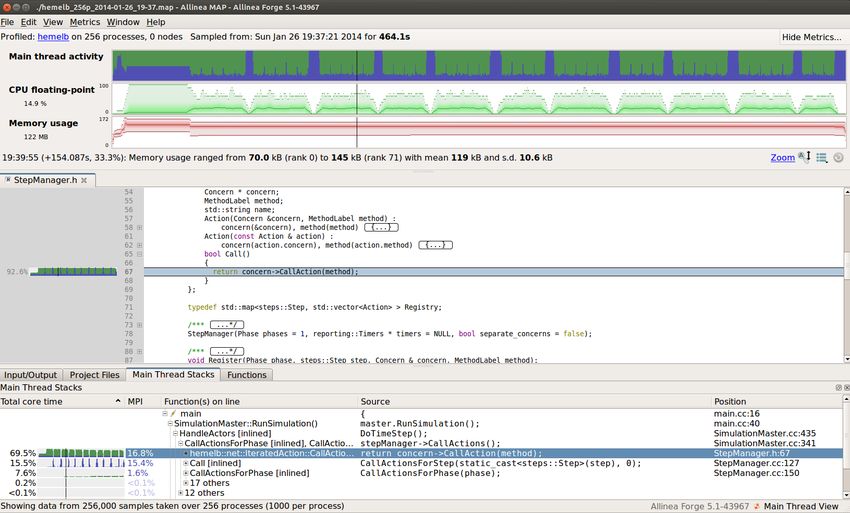
Analyze application behavior easily

                            Simple start-up

                              No source code needed

                               Scalable, low overhead

                              Powerful metrics and analysis

                            Human and machine-readable results

9   © 2019 Arm Limited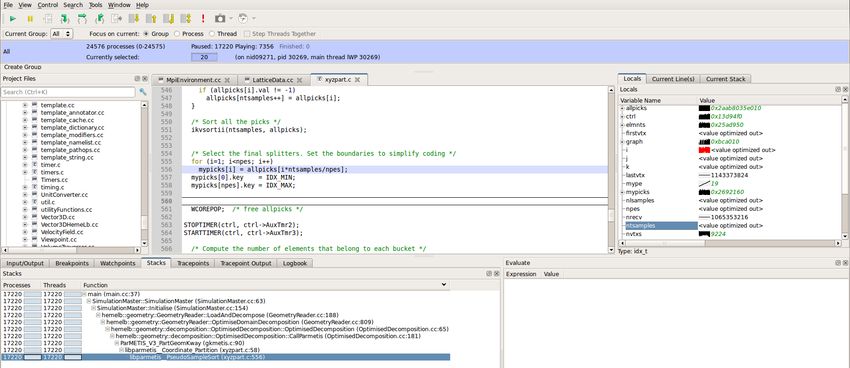
Forge: an integrated solution
                                          Deploy          Staging
                          Production
                             + PR                       environment
                                                            + PR            Builds
     Scalability
                              Optimize
                                Performance
                                                   Debug
           Develop                                                    CI Agents
             Fix                                   Regressions           + PR
           Optimize
                                Profile             Fix
         Commit           Version                   Continuous
                                                    integration       Start CI job
                          control
                          system
                                       Pull         framework

10   © 2019 Arm Limited
Arm Forge
An interoperable toolkit for debugging and profiling
The de-facto standard for HPC development
• Available on the vast majority of the Top500 machines in the world
Commercially supported • Fully supported by Arm on x86, IBM Power, Nvidia GPUs, etc.
by Arm
State-of-the art debugging and profiling capabilities
• Powerful and in-depth error detection mechanisms (including memory
debugging)
Fully Scalable
• Sampling-based profiler to identify and understand bottlenecks
• Available at any scale (from serial to petaflopic applications)
Easy to use by everyone
Very user-friendly
• Unique capabilities to simplify remote interactive sessions
• Innovative approach to present quintessential information to users
11 © 2019 Arm LimitedWhy profile?
Type of profile Optimization
Profiling: a form of dynamic program analysis used to time
optimize an application.
Hotspot
How to optimize an application?
• Select representative test cases
• Profile
• Tracing Spike
• Instrumenting
• Sampling
• Optimize
• Profile and iterate until your speedup goal has been reached Flat
12 © 2019 Arm LimitedMulti-node low-overhead profiling with Arm MAP
No instrumentation
Low overhead
Scalable
JSON export
C/C++, F90, Python profiling
13 © 2019 Arm LimitedBasic debugging
• The first debugger: print statements
• Each process prints a message or value at
defined locations
• Diagnose the problem from evidence and
intuition
f(x)
• A long slow process
• Analogous to bisection root finding x
• Broken at modest scale
• Too much output – too many log files
14 © 2019 Arm LimitedProfessional debugging with Arm DDT
C/C++, Fortran
Scalable parallel debugger
Interactive and non-interactive
Intuitive
Remote client available
15 © 2019 Arm LimitedProfessional debugging with Arm DDT
Switch
between
OpenMP
threads C/C++, Fortran
Scalable parallel debugger
Offline
memory Interactive and non-interactive
debugging
Intuitive
Visualise data
Message structures Remote client available
queue
debugging
16 © 2019 Arm LimitedHands-on
Set up your environment
•    Copy NPB in your workspace:
$    cd $SCRATCH/$USER
$    cp -r /p/scratch/share/VI-HPS/examples/NPB3.3-MZ-MPI.tar.gz .
$    tar xf NPB3.3-MZ-MPI.tar.gz
$    cd NPB3.3-MZ-MPI/

•    Load the MPI, Forge and Performance Reports modules
$    module load Intel IntelMPI
$    module use /p/scratch/share/VI-HPS/JURECA/mf/
$    module load Arm-forge Arm-reports

18    © 2019 Arm Limited
Run Arm Performance Report
•    Compile your application as usual – no requirements
$ make bt-mz CLASS=C NPROCS=8

•    Edit the job script and submit
$ cd bin/
$ cp ../jobscript/jureca/reference.sbatch job.sub
Modify the following line to add:
perf-report srun -n $PROCS $EXE
$ sbatch -A  job.sub

•    View the results
$ firefox bt-mz_C_8p_2n_6t_YYYY-MM-DD_HH-MM.html
$ cat bt-mz_C_8p_2n_6t_YYYY-MM-DD_HH-MM.html

19    © 2019 Arm Limited
Run Arm MAP
•    Edit the makefile and compile
FFLAGS          = -O3 -g -fno-omit-frame-pointer -no-ip -no-ipo $(OPENMP)
      •   The debugging option (-g) is a requirement for all applications profiled with MAP
      •   With Intel compilers, aggressive optimizations can interfere with MAP. To prevent this use the following flags:
          -fno-omit-frame-pointer -no-ip -no-ipo
$ make bt-mz CLASS=C NPROCS=8

•    Edit the job script job.sub and submit
map --profile srun -n $PROCS $EXE
      •   --profile enables to run the profiler in non-interactive mode
$ sbatch -A  job.sub

•    View the results
$ map bt-mz_C_8p_2n_6t_YYYY-MM-DD_HH-MM.map

20    © 2019 Arm Limited
MPI_Init_thread limitations • BT-MZ uses MPI_Init_thread() rather than MPI_Init() • MAP provides limited support for MPI_THREAD_SERIALIZED or MPI_THREAD_MULTIPLE • A warning message will be displayed if that’s the case • MPI activity on non-main threads won’t contribute to the MPI metric graphs. • Additional profiling overhead may appear • Pthread view is recommended to view the profiling results • MPI_THREAD_SINGLE or MPI_THREAD_FUNNELED are fully supported 21 © 2019 Arm Limited
Run Arm DDT
•    Edit the makefile and compile
FFLAGS          = -O0 -g $(OPENMP)
      •   The debugging option (-g) is a requirement for all applications debugged with DDT
      •   Disabling compiler optimizations -O0 is recommended
$ make bt-mz CLASS=C NPROCS=8

•    Launch the debugger from the login node
$ ddt
• Edit the job script job.sub and submit
ddt --connect srun -n $PROCS $EXE
$ sbatch -A  job.sub

•    Accept the incoming connection, click on Run and debug interactively

22    © 2019 Arm Limited
Arm Remote Client
• To avoid using X forwarding when using Forge, a client is available for Linux, MacOS and
Windows
• Install the Arm Remote Client
https://developer.arm.com/products/software-development-tools/hpc/downloads/download-arm-forge
• Connect to the cluster with the remote client
• Open your Remote Client
• Create a new connection: Remote Launch ➔ Configure ➔ Add
– Hostname: @jureca.fz-juelich.de
– Remote installation directory:
/p/scratch/share/VI-HPS/JURECA/packages/arm-forge-19.1/
• Connect!
23 © 2019 Arm LimitedProfile
multithreaded
codesGenomics use case: DISCOVAR
Myth: genomic applications are I/O intensive
• Identifying DNA sequence variants helps
understanding the genetic basis of many diseases
(e.g. cancer) in order to develop:
• New diagnosis
• New therapies
• DISCOVAR
• Variant caller and small genome assembler
• Input: DNA sequencing files of sub-mammalian sized
genomes
• Newer DISCOVAR de novo for larger genomes
• C++ and OpenMP
• Developed by Broad Institute at MIT
25 © 2019 Arm LimitedA first look On real hardware • It’s not I/O intensive • Good quantity of OpenMP time • No vectorization 26 © 2019 Arm Limited
OpenMP in detail

• Physical cores are 200% loaded
     •    Hyper-threading is on

• 17% of parallel region time is
  synchronization

27       © 2019 Arm Limited
DISCOVAR – Investigating the OpenMP synchronization
• Horizontal time axis: colour
coded
• Dark green – single core
• Light green – OpenMP work
• Light blue – Pthread sync
• Grey – idle
• Vertical axis
• #cores doing something
• Something’s very wrong
towards the end…
28 © 2019 Arm LimitedZoom in on the region
• Arm MAP lets you zoom
• Stacks, code, regions, time all
focused on zoom area
• Key observation:
• OpenMP “critical” region
29 © 2019 Arm LimitedFixing
• #pragma omp critical
• Execute exactly one thread at
a time to ensure safety
• is costing too much
• Passing “token” from thread to
thread to do small pieces of
work.
• Run whole section on one
thread instead
• Has same semantics
30 © 2019 Arm LimitedImpact of change • Runtime down by 7% 31 © 2019 Arm Limited
As a performance report

• Improvements in
     •    Runtime
     •    Synchronization overhead

32       © 2019 Arm Limited
Optimize Python-based applications
Python in HPC

• Essential modules:
     • NumPy: support of large multi-dimensional
       arrays and matrices
     • SciPy: support for linear algebra, integration,
       interpolation, FFT, …
     • MPI4Py: provides bindings of the MPI standard

• Rely on highly-optimized libraries
     •    Written in lower-level languages:
            –   C, FORTRAN, …
     •    BLAS, LAPACK, FFTW, …

• Can easily be interfaced with other
  languages
34       © 2019 Arm Limited
Use Arm MAP on Python applications
Laplace1.py
• Launch command
• $ python ./laplace1.py slow 100 100
[…]
• Profiling command err = 0.0
for i in range(1, nx-1):
• $ map --profile python ./laplace1.py slow 100 for j in range(1, ny-1):
100 tmp = u[i,j]
• --profile: non-interactive mode u[i,j] = ((u[i-1, j] + u[i+1, j])*dy2 +
• --output: name of output file (u[i, j-1] + u[i, j+1])*dx2)*dnr_inv
diff = u[i,j] - tmp
err += diff*diff
• Display profiling results return numpy.sqrt(err)
[…]
• $ map laplace1.map
35 © 2019 Arm LimitedNaïve Python loop 36 © 2019 Arm Limited
Optimizing computation on NumPy arrays

Naïve Python loop                             NumPy loop

err = 0.0
for i in range(1, nx-1):
  for j in range(1, ny-1):                    u[1:-1, 1:-1] =
    tmp = u[i,j]                                  ((u[0:-2, 1:-1] + u[2:, 1:-1])*dy2 +
    u[i,j] = ((u[i-1, j] + u[i+1, j])*dy2 +        (u[1:-1,0:-2] + u[1:-1, 2:])*dx2)*dnr_inv
    (u[i, j-1] + u[i, j+1])*dx2)*dnr_inv
    diff = u[i,j] - tmp                       return g.computeError()
    err += diff*diff
return numpy.sqrt(err)

37   © 2019 Arm Limited
NumPy array notation 38 © 2019 Arm Limited
Use FORTRAN in Python applications
• F2PY: FORTRAN to Python interface generator

• Part of NumPy

• Compile with debugging flag for profiling
     • $ f2py --debug -c flaplace90_arrays.f90 -m flaplace90_arrays
     • Relies on underlying compiler: GCC, IFORT, PGI
     • Generates a *.so library imported in the Python script:
               import flaplace90_arrays
     •   --debug: enables debug information

39   © 2019 Arm Limited
Use FORTRAN in Python applications
FORTRAN loop Python script
import flaplace90_arrays
subroutine timestep(u,n,m,dx,dy,error)
[…]
!f2py intent(in) :: dx,dy […]
!f2py intent(in,out) :: u
!f2py intent(out) :: error
!f2py intent(hide) :: n,m
[…]
def fortran90TimeStep(self, dt=0.0):
g = self.grid
u(1:n-2, 1:m-2)=((u(0:n-3, 1:m-2) + u(2:n-1, 1:m-2))*dy2 + &
(u(1:n-2,0:m-3) + u(1:n-2, 2:m-1))*dx2)*dnr_inv g.u,err =
error=sqrt(sum((u-diff)**2)) flaplace90_arrays.timestep(g.u, g.dx, g.dy)
end subroutine
return err
[…]
40 © 2019 Arm LimitedFORTRAN code 41 © 2019 Arm Limited
FORTRAN code

                          Recompile module with:
                              $ f2py --debug --opt="-O3 -ffast-math“ …

42   © 2019 Arm Limited
FORTRAN code fast-math 43 © 2019 Arm Limited
Multi-processing in Python

                                                      MPI4Py example
•    MPI4Py
     • Provides Python bindings of the MPI standard
                                                      from mpi4py import MPI
     • MPI: Message Passing Interface                 import numpy

                                                      comm = MPI.COMM_WORLD
•    Rely on existing MPI infrastructure              rank = comm.Get_rank()
      • MPICC must be in path when installing
        module                                        if rank == 0:
                                                          data = {'a': 7, 'b': 3.14}
      • MPIRUN enables to launch the application
                                                          comm.send(data, dest=1)
                                                      elif rank == 1:
•    Profiling command                                    data = comm.recv(source=0)
                                                          print('On process 1, data is ',data)
      • $ map --profile mpirun -n 8 python
        ./mmprod.py
44    © 2019 Arm Limited
MPI-parallel matrix multiplication 45 © 2019 Arm Limited
MPI-parallel matrix multiplication

                                     max
                                     avg
                                     min

46   © 2019 Arm Limited
MPI-parallel matrix multiplication 47 © 2019 Arm Limited
MPI-parallel matrix multiplication: OpenBLAS

                                     Recompile NumPy module to use Intel MKL

48   © 2019 Arm Limited
MPI-parallel matrix multiplication: MKL 49 © 2019 Arm Limited
Multi-node matrix multiplication: MKL

                                        Enable multi-threading with
                                          MKL_NUM_THREADS=8
50   © 2019 Arm Limited
Hybrid OMP/MPI matrix multiplication
Multithreaded/OpenMP MKL
51 © 2019 Arm LimitedVisualize code
regions with
CaliperRegion profiling with Caliper by LLNL
Retrieve contextual information as part of your performance profiles
Caliper in brief Instrument with Caliper API
Provider: LLNL
CALI_MARK_LOOP_BEGIN(riemann_slice_id); Get contextual information
What: General purpose #compute pressure, density, velocity for each slice
Application Introspection for(s=0; sPerformance Analysis with MAP, part of Forge
By default, provides the “computer science” view of an application performance
MAP in brief
Provider: Arm
What: Lightweight, highly
scalable profiler for HPC
applications on any hardware
For who: Developers of all level
looking to improve the
performance of their C/C++
and Fortran codes
Why: Extract the last drop of
performance by identifying &
diagnosing a wide range of
bottlenecks (e.g. network, CPU,
IO, etc.)
54 © 2019 Arm LimitedCaliper regions support in MAP
Combining contextual information with data collection in a slick GUI
MAP and Caliper
What: Collecting & presenting
Caliper’s data into MAP’s GUI
- Correlates regions with
performance metrics &
data
- Associates regions with the
timeline
- Ability to sort and filter by
regions
Benefit: Makes it easy for users
to understand what scientific
phenomenon or stage in a
workflow is slow and why
55 © 2019 Arm LimitedCaliper regions support in MAP
Combining contextual information with data collection in a slick GUI
MAP and Caliper
What: Collecting & presenting
Caliper’s data into MAP’s GUI
- Correlates regions with
performance metrics &
data
- Associates regions with the
timeline
- Ability to sort and filter by
regions
Benefit: Makes it easy for users
to understand what scientific
phenomenon or stage in a
workflow is slow and why
56 © 2019 Arm LimitedSummary: Arm provides...
Active Rapid
Leadership in
development innovation
HPC software
and and user
tools
investment focus
• The only scalable • Innovative, • Providing what
cross-platform tool extremely scalable science needs, first.
suite for HPC tools with unique
visual insight
57 © 2019 Arm LimitedThank You
Danke
Merci
谢谢
ありがとう
Gracias
Kiitos
감사합니다
धन्यवाद
شكرا
ً
תודה
© 2019 Arm LimitedThe Arm trademarks featured in this presentation are registered
trademarks or trademarks of Arm Limited (or its subsidiaries) in
the US and/or elsewhere. All rights reserved. All other marks
featured may be trademarks of their respective owners.
www.arm.com/company/policies/trademarksYou can also read