Texas Public Education Outcomes - TEXAS COMMISSION ON PUBLIC SCHOOL FINANCE JANUARY 23, 2018 - Texas Education Agency
←
→
Page content transcription
If your browser does not render page correctly, please read the page content below
Texas Public Education Outcomes
TEXAS COMMISSION ON PUBLIC SCHOOL FINANCE
JANUARY 23, 2018
What do we want our education
                  system to produce?
A split focus on Inputs vs Outcomes:
TEC §4.001: “The mission of the public education system of this state is to ensure that all
Texas children have access to a quality education that enables them to achieve their
potential and fully participate now and in the future in the social, economic, and educational
opportunities of our state and nation.”
Of 11 statutory objectives, the following reference outcomes:
 ◦ OBJECTIVE 2: Students will be encouraged and challenged to meet their full educational potential.
 ◦ OBJECTIVE 3: Through enhanced dropout prevention efforts, all students will remain in school until
   they obtain a high school diploma.
 ◦ OBJECTIVE 5: Educators will prepare students to be thoughtful, active citizens who have an
   appreciation for the basic values of our state and national heritage and who can understand and
   productively function in a free enterprise society.
 ◦ OBJECTIVE 7: The state's students will demonstrate exemplary performance in comparison to
   national and international standards.

1/23/2018                                                                                               2
What do we want our education
                 system to produce?
TEC §4.002. PUBLIC EDUCATION ACADEMIC GOALS:
 ◦ GOAL 1: The students in the public education system will demonstrate
   exemplary performance in the reading and writing of the English language.
 ◦ GOAL 2: The students in the public education system will demonstrate
   exemplary performance in the understanding of mathematics.
 ◦ GOAL 3: The students in the public education system will demonstrate
   exemplary performance in the understanding of science.
 ◦ GOAL 4: The students in the public education system will demonstrate
   exemplary performance in the understanding of social studies.

1/23/2018                                                                      3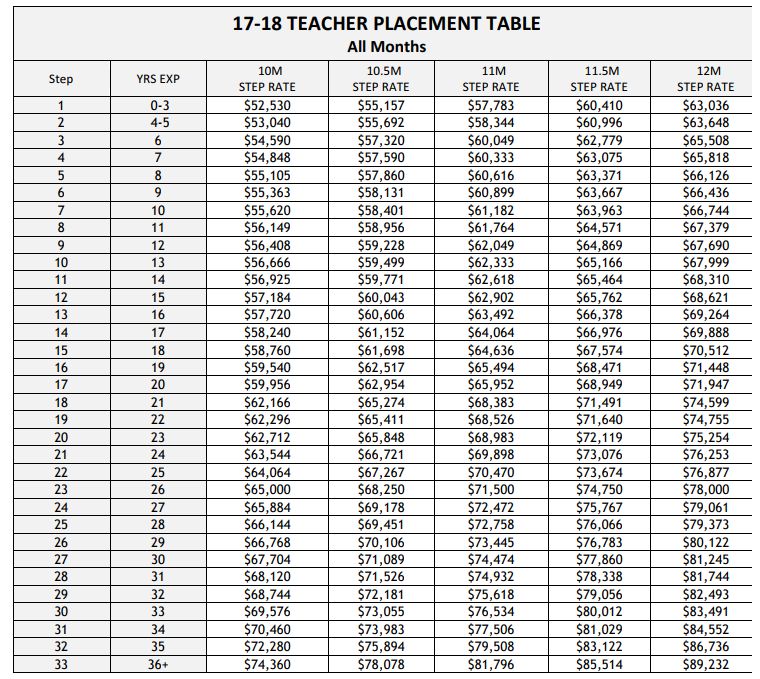
What do we want our education
                 system to produce?
Summary:
 ◦ We want graduates
 ◦ Who are prepared to be engaged citizens
 ◦ Who are prepared to be productive

1/23/2018                                    4
How can we evaluate whether our
                 system is doing this?
We have to find measurements that are proxies for these concepts.
For the outcomes of the K-12 system, we focus on:
 ◦ High School graduation
 ◦ College, Career, or Military Readiness (CCM-R) of those graduates
 ◦ And ultimately:
   ◦ College (2-year, 4-year) completion
   ◦ Employment

For “all Texas children”
Near term goal: 60x30TX
1/23/2018                                                              5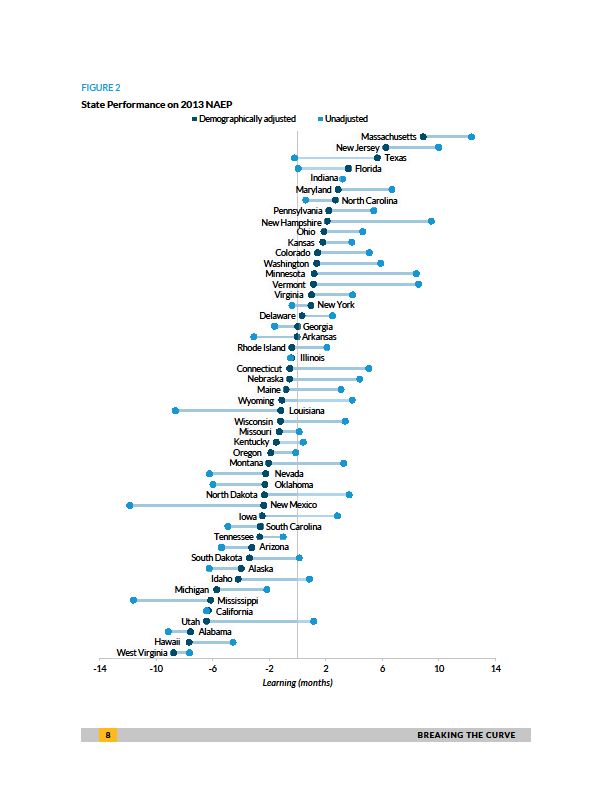
How do we measure CCM-Readiness? HB22 provides the path

  College Ready                                   Career Ready
  • Meet criteria on AP/IB exams                  • Earn industry certification
  • Meet TSI criteria (SAT/ACT/TSIA) in reading   • Be admitted to post-secondary industry
    and mathematics                                 certification program
  • Complete a college prep course offered
    by a partnership between a district and       Military Ready
    higher education institution as required
    from HB5                                      Enlist in the United States Armed Forces
  • Complete a course for dual credit
  • Complete an OnRamps course
  • Earn an associate’s degree
  • Meet standards on a composite of
    indicators indicating college readiness

 1/23/2018                                                                                   6
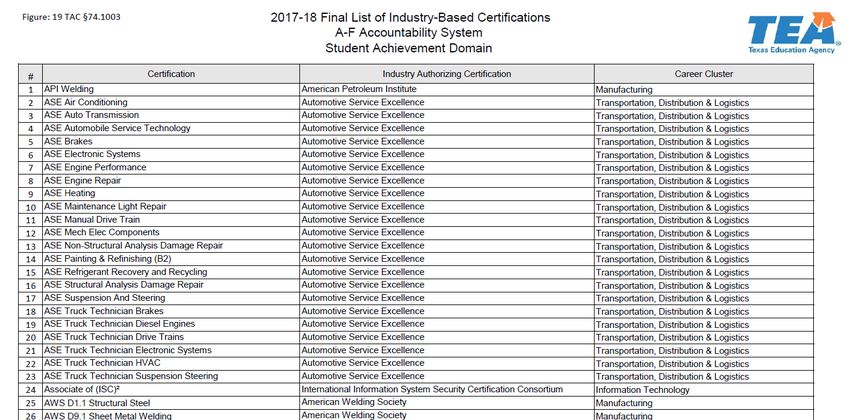
Certain Details: 74 Industry Certifications

 1/23/2018                                    7
Why do we think College, Career, and Military
   Readiness (CCM-R) measures are valid?
 • There is a relationship between the performance of students on
   these measures and what they ultimately go on to do, in terms
   of longer term life outcomes (including employment and college
   completion)
 • Specifically: The college readiness benchmarks on SAT (1110 or
   higher on Reading/Math) and ACT (24 or higher composite) have
   been shown to correlate with roughly a 75% chance of passing
   freshman level college courses

1/23/2018                                                           8
How do we evaluate the whole system?
 • We want graduates who are prepared to be productive citizens, and
   we have a method to approximate how well we are doing that.
 • But K-12 is 13 years of public schooling, starting with 5 year-olds.
 • We don’t think of 6 year-olds as prepared for college, career, or the
   military. So how do we evaluate outcomes before graduation?
 • Texas has developed a set of standard expectations, describing what
   students should know and be able to do by grade level for English,
   math, science, and social studies: the Texas Essential Knowledge &
   Skills (TEKS)
 • Each successive grade level is more advanced, leading to ultimate HS
   graduation standards that are intended to ensure all students are
   CCM-R
1/23/2018                                                              9
What is an Example of a Standard?
 • Third Grade Math, Standard 4.F                        3 x 7 = 21

 • Strand: Number and operations.
 • Knowledge & Skill: The student applies mathematical process
   standards to develop and use strategies and methods for whole
   number computations in order to solve problems with efficiency
   and accuracy.
 • The student is expected to:
       •    (F) recall facts to multiply up to 10 by 10 with automaticity and recall the
            corresponding division facts

1/23/2018                                                                                  10
Standards are Vertically aligned:
• For each set of standards, there is an issue of scope
and depth – for students of varying age levels, what
breadth of skills should be known, and how well should
they be known – building up to CCM-R for all students
at graduation.
• Teaching these standards is extremely technical
work, and teachers have a job that requires
tremendous skill and expertise.
1/23/2018 11The State of Texas Assessments of Academic Readiness (STAAR) are designed to tell us how well our students know grade level knowledge & how well they can demonstrate grade level skills. 1/23/2018 12
STAAR Performance Levels
Masters Grade Level
 ◦ Performance in this category indicates that students are expected to succeed in the next grade or course with little or no
   academic intervention. Students in this category demonstrate the ability to think critically and apply the assessed knowledge
   and skills in varied contexts, both familiar and unfamiliar.
 ◦ For students at the end of high school, this is associated with a 75% chance of passing freshman level college courses.

Meets Grade Level
 ◦ Performance in this category indicates that students have a high likelihood of success in the next grade or course but may still
   need some short-term, targeted academic intervention. Students in this category generally demonstrate the ability to think
   critically and apply the assessed knowledge and skills in familiar contexts.
 ◦ For students at the end of high school, this is associated with a 60% chance of passing freshman level college courses.

Approaches Grade Level
 ◦ Performance in this category indicates that students are likely to succeed in the next grade or course with targeted academic
   intervention. Students in this category generally demonstrate the ability to apply the assessed knowledge and skills in familiar
   contexts.
 ◦ This is the passing standard applied by the state to students who take the EOCs, and for students on the 5th and 8th grade in
   reading & math STAAR.

  1/23/2018                                                                                                                   13
STAAR ALGEBRA II
2009 NAEP 12th grade
math Proficient or
High school course higher
grade B or better
College:
College: 60%
60% prob.
prob. of
of
C or
C or better
better College: 75%
75% prob.
prob. of
of
TAKS grade
grade 11
11 College:
TAKS C or
or better
better
math C
math HERC
HERC
Le
evel II Level III
78% 64% 47% 32% 26%25% 21% 2%
94% 63% 55% 47% 27% 25% 9%
100% Meeting Standard 0% Meeting Standard
THEA
THEA math
math TSI
TSI cut ACT
cut ACT math
math CR
CR benchmark
benchmark
SAT: 75%
SAT: 75% probability
probability of
of C
oror
C better
better
SAT: 60% probability of
ACCUPLACER
ACCUPLACER
C or better
Algebra TSI
Algebra TSI cut
cut
40% STAAR test 60%
60% STAAR
STAAR test
test
questions correct questions
questions correct
correct
Abbreviations
High school
CR = College Readiness course grade A
TSI = Texas Success Initiative
1/23/2018 14Student Achievement and Attainment Summary
Spring 2017 - “Meets” Standard
100
90
80 89
70
60
50 60 56
45 48 49
44
40
30
24
20
10
16
0
Kindergarten 3rd Grade 3rd Grade 8th Grade 8th Grade SAT/ACT High School College Postsecondary
Readiness- Reading Math Reading Math Passing Completion Enrollment Completion
STAAR “Meets” STAAR “Meets” 2016 Cohort 2015 Cohort Enrolled 2009 Cohort 2-or-4-year
Reading STAAR “Meets” STAAR “Meets”
Attaining College
2016 Cohort
Grade Level Grade Level Grade Level Grade Level graduating within within 1-yr at TX Postsecondary
Based on local
or Above or Above or Above or Above Ready Score 4 years a Texas IHE Completion within 6 years
district assessments
15* The Approaches Grade Level
standard was raised (made
more difficult) in 2016
1/23/2018 16* The Approaches Grade Level
standard was raised (made
more difficult) in 2016
** These 8th Grade Math
numbers include only 8th
graders taking 8th grade math.
The percentages do not
include those students taking
Algebra I in 8th grade, whose
performance tends to be
higher. Including those
students, 8th grade students
Meeting Grade Level is closer
to 50%. That consolidated
data will begin being
published Fall 2018.
1/23/2018 171/23/2018 18
Four-Year Graduation Rates, by Race/Ethnicity,
             Texas Public Schools

                                     National Comparison
                                      2014-15 Graduation Rates

                                      Rank       State    Rate
                                       1     Iowa          90.8%
                                       2     New Jersey    89.7%
                                       3     Alabama       89.3%
                                       4     Texas         89.0%
                                       5     Nebraska      88.9%

 1/23/2018                                                         19
1996-2016: SAT/ACT Performance By Socioeconomic Status
% Above "Passing" on SAT/ACT
30.0%
Non Economically
Disadvantaged
25.0%
6.1 point rise
31% increase
20.0%
All Students
15.0% In Texas
10.0%
Economically
5.0% Disadvantaged
1.8 point rise
45% increase
0.0%
1996 1997 1998 1999 2000 2001 2002 2003 2004 2005 2006 2007 2008 2009 2010 2011 2012 2013 2014 2015 2016
Economically disadvantaged Not economically disadvantaged All
1/23/2018 201996-2017: Rise In Student Poverty Rates in Texas
1996 Econ Dis. %
1/23/2018 10SAT/ACT Performance Among
Certain Student-Populations
1996 - 2016
% Above "Passing" on SAT/ACT
35.0%
30.0%
White Students
25.0%
20.0%
All Students
15.0% In Texas
10.0%
Hispanic Students
5.0% African American
Students
0.0%
1996 1997 1998 1999 2000 2001 2002 2003 2004 2005 2006 2007 2008 2009 2010 2011 2012 2013 2014 2015 2016
All White Hispanic African American
1/23/2018 22College Enrollment Rates 1/23/2018 23
How Does Texas Compare to Other
States?

1/23/2018                         24
4th Grade Math NAEP                                                                       2000       2003        2005        2007          2009        2011          2013          2015

      •    Texas rank vs other states (right)                            Texas-White-Rank*             3           5           2           4             7           7             6             4

      •    Average of all students over time (below)                     Texas-Hispanic-Rank*          2           7           2           3             8          11            13             3
                                                                         Texas-Black-Rank*             1           1           2           3             3           4             4             1
      •    Texas student-groups over time (below right)
                                                                         Texas-Overall-Rank*           7          17          11          20            27          24            26            10

      * Rank of states only, excludes DC, Dept of Def, and territories

                            Math Grade 4 - Average Score                                                                              Math Grade 4 - Average Score
255                                                                                                260

250
                                                                                                   250
245                                                                                                                                                                                                  Texas-White

240                                                                                                240                                                                                               US-White
                                                                                US
                                                                                California                                                                                                           Texas-Hispanic
235
                                                                                Florida            230
                                                                                                                                                                                                     US-Hispanic
230                                                                             Massachusetts
                                                                                New York
                                                                                                                                                                                                     Texas-Black
225                                                                             Texas              220
                                                                                                                                                                                                     US-Black
220
                                                                                                   210
215

210                                                                                                200
          2000   2003    2005    2007    2009    2011    2013    2015                                       2000       2003    2005       2007     2009      2011        2013     2015

                  1/23/2018                                                                                                                                                                                 25
8th Grade Math NAEP 2000 2003 2005 2007 2009 2011 2013 2015
Texas-White-Rank* 7 10 4 3 4 4 5 4
• Texas rank vs other states (right)
Texas-Hispanic-Rank* 4 3 2 1 4 2 3 3
• Average of all students over time (below) 9 7 4 4 1 2 3 5
Texas-Black-Rank*
• Texas student-groups over time (below right) Texas-Overall-Rank* 20 33 21 15 18 10 15 22
Math Grade 8 - Average Score Math Grade 8 - Average Score
310 310
300
300
Texas-White
290
290 US-White
US
California 280 Texas-Hispanic
280 Florida
US-Hispanic
Massachusetts
270
New York
Texas-Black
270 Texas
260 US-Black
260 250
250 240
2000 2003 2005 2007 2009 2011 2013 2015 2000 2003 2005 2007 2009 2011 2013 2015
1/23/2018 264th Grade Reading NAEP Texas-White-Rank*
1998
3
2002
7
2003
16
2005
11
2007
11
2009
11
2011
11
2013
11
2015
11
• Texas rank vs other states (right) Texas-Hispanic-Rank* 9 5 18 11 11 18 14 34 22
• Average of all students over time (below) Texas-Black-Rank* 21 16 13 9 13 5 7 13 22
• Texas student-groups over time (below right) Texas-Overall-Rank* 22 29 36 29 31 33 36 40 39
Reading Grade 4 - Average Score Reading Grade 4 - Average Score
235
240 230
225
Texas-White
230
220
US-White
US
215
California Texas-Hispanic
220
Florida 210
US-Hispanic
Massachusetts
New York 205
210 Texas-Black
Texas
200
US-Black
195
200
190
190 185
1998 2002 2003 2005 2007 2009 2011 2013 2015 1998 2002 2003 2005 2007 2009 2011 2013 2015
1/23/2018 278th Grade Reading NAEP 1998 2000/02 2003 2005 2007 2009 2011 2013 2015
Texas-White-Rank* 9 4 13 21 5 10 14 8 20
• Texas rank vs other states (right)
Texas-Hispanic-Rank* 7 9 15 15 12 19 23 28 34
• Average of all students over time (below) Texas-Black-Rank* 10 9 13 10 10 17 10 13 8
• Texas student-groups over time (below right) Texas-Overall-Rank* 21 26 36 36 31 34 36 37 38
Reading Grade 8 - Average Score Reading Grade 8 - Average Score
280 280
275
275
270 Texas-White
270
US-White
265
265 US
California Texas-Hispanic
260
260 Florida
US-Hispanic
Massachusetts
New York 255
255 Texas-Black
Texas
250 US-Black
250
245
245
240
240 1998 2003 2007 2011 2015
1998 2002 2003 2005 2007 2009 2011 2013 2015
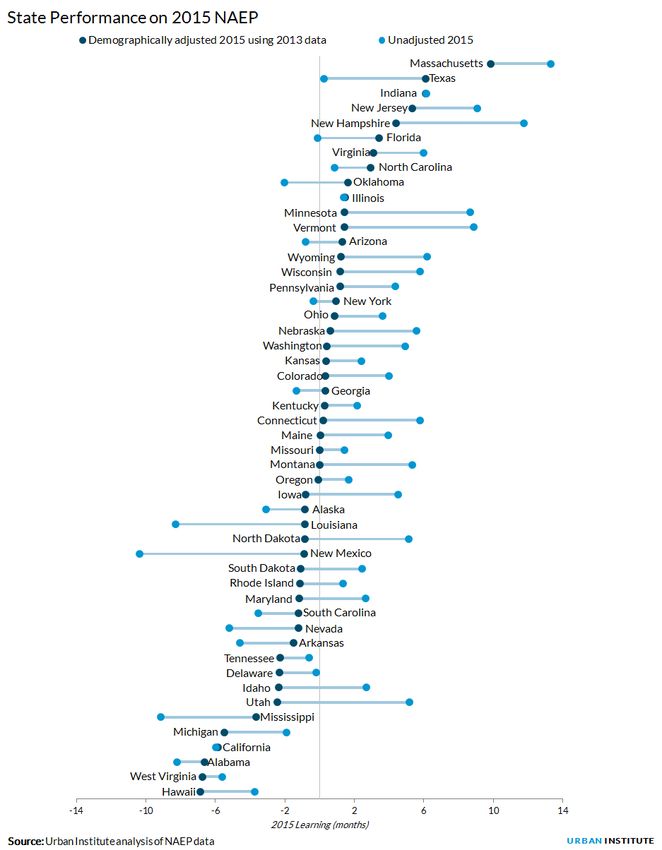
1/23/2018 28NAEP State Rankings - 2015
Absolute vs Demographically Adjusted
See:
http://educationnext.org/how-do-states-really-stack-up-on-the-2015-naep/
1/23/2018 29NAEP State Rankings - 2013
Absolute vs Demographically Adjusted
See:
http://www.urban.org/research/publication/breaking-curve-promises-and-
pitfalls-using-naep-data-assess-state-role-student-
achievement/view/full_report
2013 Per Pupil Spending
Per US Census
United States $ 10,700
California $ 9,220
Florida $ 8,433
Massachusets $ 14,515
New York $ 19,818
Texas $ 8,299
1/23/2018 30How do we differentiate
performance within Texas?
• HB22 will allow for clear differentiation, but won’t be initially
available for campuses until August 2018
• In the meantime, it is possible to analyze Student Achievement
relative to Poverty to see performance outliers
1/23/2018 31Elementary Campus “Performance”
% of Students Meeting Grade Level on the STAAR
% of Students Eligible for Free/Reduce Lunch 2015-2016 School Year
1/23/2018 32District “Performance”
% of Students Meeting Grade Level on the STAAR
% of Students Eligible for Free/Reduce Lunch 2015-2016 School Year
1/23/2018 33The relationship between funding and
performance: limitations
• Campus level funding information is imprecise in Texas because
of different approaches to time & effort allocations in
managerial accounting.
• Example to Consider: IT Services
• District level financial information is highly accurate, and allows
for comparisons.
1/23/2018 34District "Performance" Relative to Per Student Funding for
Below Average Taxation Districts & Above Average Student Poverty Districts*
40
“What If" Domain III Score: STAAR Achievement Relative to Student Poverty 2015-2016
30
20
Academic Performance for only
10 those districts and charters with:
1) maintenance and operations
(M&O) local property tax rates
at or below the state average
of $1.0812 per $100 of
taxable property valuation
0
(which includes all charters,
funded at that average), and
2) population of economically
disadvantaged students
higher than state average of
-10 59%
382 districts & charters featured
-20
-30
$0 $5,000 $10,000 $15,000 $20,000 $25,000 $30,000 $35,000 $40,000
State, Local and Federal Revenue per Student (All Funds) for the 2015-2016 School Year
1/23/2018 35What do district budgets tell us? Texas financial accounting system tracks spending by functional area. Examples: ◦ Instruction ◦ Curriculum/Staff Development ◦ School Administration ◦ General Administration ◦ Plant Maintenance/Operations ◦ Data Processing Services Despite much study, no clear relationship seems to exist between total dollars spent in these functional budget categories and student outcomes 1/23/2018 36
What do district budgets tell us?
It’s not as simple as total dollars in a budget functional area.
Instead, it’s programmatic choices & execution quality of that
spending that matter the most
 ◦ It appears that the programmatic choices made by districts and the
   quality of execution of those choices at the campus level – with a
   special focus on quality instruction – drive outcomes far more than
   macro-level budgetary decisions.
 ◦ Consider: The difference between total spent on staff development
   vs the content & approach of the staff development pursued.

1/23/2018                                                                37
What are some promising practices
                    worth exploring?
 • Comprehensive Teacher Quality & Placement Initiatives
 • Focused Instructional Leadership Initiatives
 • Quality Early Learning Programs
 • Certain Integrated, Coherent Instructional Materials (Blended &
   Traditional)
 • Increased Summer Learning Opportunities
 • School Systems transforming into Systems of Great Schools:
   • Certain School Models (Primarily High School)
   • Intentional School Launch Practices
   • Proven Operator Replications

1/23/2018                                                            38
Teacher Quality
• Teachers are the most important in-school factor impacting student
outcomes. Teachers are also the biggest budget driver in Texas.
• Teaching represents $28B per year of spending in Texas, roughly 48% of all
K12 spending.
• Increases in funding that are applied to teaching can do some combination
of:
• Increase the number of teachers
• Increase pay for all
• Increase pay for some
• Districts respond to funding changes differently given local context
• But those responses are built around certain default system behaviors. Can finance system
components change those behaviors?
1/23/2018 39District Funding Responses:
Teacher Quality
• Increasing the number of teachers:
class size reduction
• Consider effect-size research*: 0.21
• See: https://visible-learning.org/hattie-ranking-influences-effect-sizes-learning-achievement/
Note these effect sizes are not typically based on random control trials, and subject to some caution on interpretation
1/23/2018 40District Funding Responses: Teacher Quality
Sample District Salary Schedule:
• Increasing pay for all
• Consider the default salary
schedule:
1/23/2018 41District Funding Responses: Teacher Quality • Increasing pay for some • Connecting school funding changes to teacher quality would require compensation systems based on something beyond just years of experience 1/23/2018 42
Early Learning
• 90% of brain development occurs before age 5
• TEA data shows that of students eligible for Pre-K in Texas, those
  who participated in Pre-K in 1999 are persisting in college at 6.8%
  higher rates that those who were eligible and did not
• Districts respond to funding changes differently given local context
  • But those responses are built around certain default system behaviors.
  • Current funding formulas include a high school allotment on top of full ADA funding
    for high school students. By comparison, PreK has only a half ADA allocation, and
    no extra allotment.

1/23/2018                                                                           43
Coherent Curriculum
• Quality instructional materials & approaches are incredibly impactful
• Random control trial results: RCT Effect size
Curriculum comparisons
More effective math curricula 0.30 mathematics
Most effective preschool curricula 0.48 vocabulary
Most effective dropout preventions 1.00 progressing in school
Most effective early reading programs 0.80 alphabetics
• Districts are provided IMA for materials, but the content/quality of those
materials is unlinked to any systemic incentives.
• A new state law sets up an Instructional Materials Portal, to list materials and
information about their quality. It should go live in 2019.
1/23/2018 44Summer Learning
• Typical days of instruction in Texas is roughly 180.
Most Asian nations have 220+ days of instruction.
• Consider effect-size research: Summer Vacation -0.02
• State law recently changed instructional
requirements to be based upon minutes, but
funding is still based on daily attendance that is
effectively capped at that instructional minute
floor.
• Districts respond to funding changes differently
given local context
• But those responses are built around certain default system
behaviors
• Adding (or reducing) instructional days is not linked to any
differences in funding formulas, but those changes are linked
to differences in local costs.
1/23/2018 45A System of Great Schools
• Given the necessity to focus on execution quality as opposed to broad programs, it is very useful
to think of a “whole school approach” as the unit of change:
• An individual school (or network of like-schools) can control (among many other factors):
• Instructional Materials
• Instructional Leadership & Teacher Quality
• Summer Learning Opportunities
• and can influence other important factors -- like peer effects from students – through a comprehensive approach to school
culture
• Tiered accountability (A-F) is a precondition to identifying, and then replicating, high performers
• Districts could respond to funding incentives based around schools as the unit of change:
• Consider recently adopted
Distribution of
SB1882 that encourages
Hypothetical
Schools in a
whole school-level
Current
District
partnerships. Does this or
something similar create
finance system incentives to
Unit of Change
Schools as the
Future when
Hypothetical
replicate “A” campuses?
Focused on
1/23/2018 46You can also read