A CLOSER LOOK AT REAL ESTATE: 2018 TRENDS & HEADWINDS - BMO Private Bank
←
→
Page content transcription
If your browser does not render page correctly, please read the page content below

Jeffrey I. Rogers, Senior Equity Analyst, BMO Wealth Management - U.S.
                                                                      Michael P. Stritch, CFA, Chief Investment Officer, BMO Wealth Management - U.S.

Monday, April 16, 2018

A CLOSER LOOK AT REAL ESTATE: 2018 TRENDS & HEADWINDS
Over the last 12 months, the S&P 500 has increased over 10%,                    from 3.1 months in December (revised from 3.2). The low level of
unemployment has decreased to 4.1% from 4.4% while the labor                    inventory may help new home sales as prospective buyers have
force participation rate has stayed flat around 63%. The economy                difficulty finding existing properties for sale. Increased construction
is humming along and with tax rates decreasing, and we are                      would also help to reduce the undersupply, and high builder
actually seeing small signs of inflation. This economic backdrop                confidence should lead to an increase in output going forward.
should benefit the owners of real assets, but given where we
                                                                                Mortgage rates rising, but still low
are in the cycle, not all tiers of real estate are created equal.
                                                                                Mortgage rates have also spiked in 2018 (Exhibit #1), though remain at
Will the residential run continue?                                              low levels in a historical context. At 4.34%, rates have increased 0.49%
Single-family existing home sales decreased 3.8% sequentially in                from the beginning of the year but still below the 15-year average of
January to 4.76 million homes on a seasonally-adjusted annual basis,            4.78%. Going forward, we expect a gradual rise in mortgage levels
the second consecutive drop after the recent high of 5.05 million homes         as inflation and interest rates continue moving higher. It is important
annualized in November. The slowing sales make sense in light of the            to note that mortgages are not tied directly to the 10-yr Treasury,
lack of inventory, which started the year at the lowest level on record         although there is a correlation between rates. When borrowers take
in terms of the month’s supply of homes for sale. The lack of available         out mortgages, the lending institution typically sells those mortgages
inventory and increased competition meant that homes did not                    to Fannie Mae or Freddie Mac who then bundle the mortgages into
remain on the market long, averaging 42 days in January, consistent             bond-like securities for resale on the secondary market. It’s in the
with 40 days in December, and down from 50 days in January 2017.                secondary market where mortgage rates are established. As the
                                                                                economy heats up, mortgage investors demand higher yields. Those
Single-family prices increased 5.7% year-over-year, with increases
                                                                                higher yields fall onto the lenders who -in response- increase mortgage
of 9.0% in the Midwest, 8.2% in the West, 6.1% in the Northeast,
                                                                                rates. So, while the trajectory of the 10-year reflects overall sentiment
and 4.7% in the South. These higher prices are good for owners
                                                                                within the economy (hence the correlation to mortgage rates) it’s
and sellers, but hurt affordability, which we see becoming a more
                                                                                not the “baseline” rate from where mortgage rates are determined.
significant issue, especially in the West. The share of first-time
buyers slipped to 29% in January, down from 32% in December,                    What about tax law changes?
and 33% in January 2017. However, we do expect easing credit                    The state and local tax (SALT) deduction is most heavily used
conditions in 2018 alongside added activity from first-time buyers,             by taxpayers in a handful of high-tax states, and is one of the
but the lack of inventory is most acute at the entry level. The supply          largest deductions claimed by the top quintile of households by
of existing homes for sale increased to 3.4 months in January, up               income. It also costs the federal government about $100B per

For more insights and information, follow - BMO Wealth Management - U.S. LinkedIn

                                                                          -1-                                                       Please see disclosure on last page
Exhibit 1: Pending Home Sales and Mortgage Rates year. Loss of the SALT deduction could result in a tax increases for
the average itemizing taxpayer in many of those locations.
(%)
140 7
The question of “what happens to high-end real estate” in high-
Pending Home Sales Index (LHS)
130 30-Year Mortgage Rates (RHS) 6.5 tax states is a good one, and one that may not have the easiest
of answers. There are two ways to look at this question. The first
120 6
is straight forward and intuitive: Under the $10K deduction cap,
110 5.5 high-end properties in high tax states should go down in value
100 5 because the cost to carry the property has now increased. So that’s
the simple “real estate behaves like bonds” answer. There is a
90 4.5
second option, however, that takes the “tax cuts/SALT deductions”
80 4 as something that could offer a 2nd derivative catalyst for high-end
70 3.5
home prices, as the broader “tax cut” could further stimulate the
Source: National Association of REALTORS®, Bankrate.com, BMO Wealth Management economy. If it’s true that wealthy people grow wealth at a higher
60 3
rate than median income or low income people, then it stands to
reason that in a strong economy those with higher wealth could
shrug off the inconvenience of higher taxes in the area of a limited
SALT deduction as personal net wealth increases at a greater rate.
What about commercial real estate?
Commercial real estate generally falls into the following categories:
Office, Industrial, Self-Storage, Diversified, Lodging/Resorts, Retail,
Exhibit 2: Average Cap Rates by Property Type (%) Residential (or Multifamily), and Health Care. Categories can be further
divided into, for example, Class-A vs. Class-B buildings, regional
Retail Industrial/Warehouse Multi-Family Office
9 malls with national department store anchors, or neighborhood strip
centers with a national chain drugstore as the flagship tenant.
Trends suggest there continues to be strong interest in the commercial
8
real estate (CRE) space. Despite challenges among certain industries,
particularly anything that relates to retail, there is no shortage of
7
dry powder from institutional investors and banks as they look for
the next deal. Part of the problem facing commercial real estate,
is that Cap Rates as shown in Exhibit #2 (simply defined as Net
6 Operating Income (NOI) to property asset value) are compressing
as the demand elevates prices faster than lease/rent rates.
Source: Real Capital Analytics, Bloomberg, BMO Wealth Management
Chart #3037.1 The real estate Long-Term Growth Heat Map prepared by Maximus
5
Advisors (Exhibit #3) shows considerable strength in the Southwest
2002
2003
2004
2004
2005
2006
2006
2007
2008
2008
2009
2010
2010
2011
2012
2012
2013
2014
2014
2015
2016
2016
2017
and Southeast (save for the tepid mid-Atlantic sub-regions) of the
United States, implying low vacancies, rapidly rising rents, and
demand strongly outpacing new supply. While not as robust, the
West - which includes all of California, Las Vegas, Portland, and Seattle
-2- Please see disclosure on last page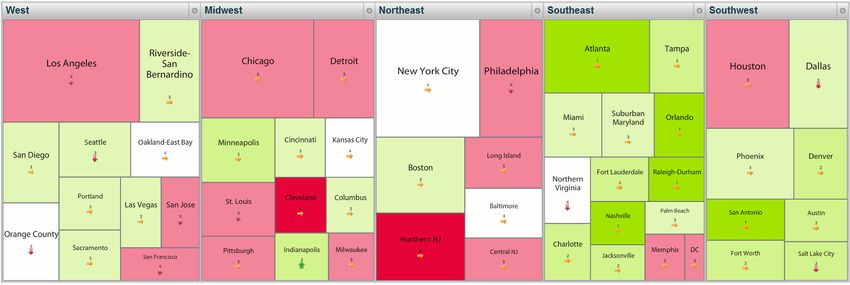
Exhibit 3: Commercial Real Estate Heat Map by Region

Source: BMO Financial Company Reports; Maximus Advisors 12/7/17

– is demonstrating a stable real estate environment with average              Conclusion
vacancies, moderate rent growth, and balanced supply and demand.              Strong U.S. economic growth is expected to continue for the
More challenged are the Midwest – particularly the rustbelt cities            remainder of 2018, which is supportive of housing pricing. Impacts
of Cleveland, Detroit, Chicago, and Milwaukee - and Northeast with            of the recent tax changes remain to be seen, however, as capping
high vacancies, considerable supply-side risk, and flat to declining          the SALT deduction may adversely impact the overall demand at
rent growth primarily on challenges from Office and Retail.                   the high-end of the single family residential market. That said,
                                                                              affordability still favors single family residential over renting.
Not surprisingly, the strongest regions continue to track from coast
to coast through the southern part of the United States. Also not             Within Commercial Real Estate (CRE), the continued overall health
surprisingly, Class A, B, and C industrial demand is getting a second         and stability of the various CRE markets is likely bolstered by
leg of drivers from e-commerce, cloud computing and legalized                 investor and lender discipline. This will help mitigate supply/
cannabis to supplement traditional industrial production which is             demand imbalances that occur in certain sub-market property
approaching cyclical highs. This suggests opportunity still exists            types. The recent change in tax policy has limited direct impact on
across the landscape, but a rising tide may no longer lift all boats.         the CRE space, but should serve as an economic tailwind driving
                                                                              employment and provide an additional leg to support price inflation.

                                                                        -3-                                                         Please see disclosure on last page
Disclosure
This report contains our opinion as of the date of the report. It is for general indicated, alternative investment performance data is shown as net of fund
information purposes only and is not intended to predict or guarantee the expenses, management fees, and incentive fees. Index performance data is
future performance of any investment, investment manager, market sector, shown as total return. You cannot invest directly in an index. Due to a system
or the markets generally. We will not update this report or advise you if there conversion, the ability to manipulate or restate client specific performance
is any change in this report or our opinion. The information, ratings, and data prior to December 31, 2007, may be limited.
opinions in this report are based on numerous sources believed to be reliable, Any discussions of specific securities, investment managers, or strategies are
such as investment managers, custodians, mutual fund companies, and third- for informational purposes only and should not be considered investment
party data and service providers. We do not represent or warrant that the advice. The report does not constitute an offer to sell or a solicitation to buy
report is accurate or complete. any security or investment product. Any offer to sell or solicitation to buy
To the extent this report contains information about specific companies or an interest in any private security, investment product or fund may only be
securities, including whether they are profitable or not, it is being provided made by receiving a confidential private offering memorandum, prospectus,
as a means of illustrating the investment manager’s investment thesis. The investment advisory agreement or similar documents from the investment
investment manager may or may not have invested in these securities at manager, which describes the material terms and various considerations and
the time this report was prepared or is accessed by the reader. References to risks relating to such security, investment product or fund.
specific companies or securities are not a complete list of securities selected Alternative investments, such as private equity and hedge funds, contain risks
and not all securities selected in the referenced timeframe were profitable. that are amplified when compared with other asset classes, such as illiquidity,
Other Bank of Montreal affiliates, and their agents and employees, may stock or sector concentration, financial leverage, difficulties in valuation,
provide oral or written market commentary or trading strategies to clients and short selling. Alternative investment vehicles have minimal regulatory
that reflect opinions that are contrary to the opinions expressed in this report. oversight and alternative managers have the latitude to employ numerous
These same persons and affiliates may make investment decisions that are investment strategies with varying degrees of risk.
inconsistent with the recommendations or views expressed in this report. We are not licensed or registered with any financial services regulatory
We and our affiliates, directors, officers, employees and members of their authority outside of the United States. Non-U.S. residents who maintain
households, will from time to time have long or short positions in, U.S.-based financial services accounts with us may not be afforded certain
act as principal in, and buy or sell, the securities referred to in this report. protections conferred by legislation and regulations in their country of
We and our affiliates, directors, officers, employees and members of their residence with respect to any investments, investment solicitations,
households, may have positions in the securities mentioned that are investment transactions or communications made with us.
inconsistent with the views expressed by this report. You may not copy this report or distribute or disclose the information
This report is not intended to be a client-specific suitability analysis contained in the report to any third party, except with our express written
or recommendation, an offer to participate in any investment, a consent or as required by law or any regulatory authority.
recommendation to buy, hold or sell securities, or a recommendation of any “BMO Wealth Management” is a brand name that refers to BMO Harris Bank,
investment manager or investment strategy. Do not use this report as the sole N.A., CTC myCFO, LLC, BMO Harris Financial Advisers, Inc., BMO Delaware Trust
basis for your investment decisions. Do not select an asset class, investment Company, and certain affiliates that provide certain investment, investment
product, or investment manager based on performance alone. Consider all advisory, trust, banking, securities, insurance and brokerage products and
relevant information, including your existing portfolio, investment objectives, services. “CTC | myCFO” is a brand name that refers to BMO Harris Bank,
risk tolerance, liquidity needs and investment time horizon. N.A., CTC myCFO, LLC, and BMO Delaware Trust Company. The CTC | myCFO
Any forward-looking statements in this report involve known and unknown brand provides family office, investment advisory, investment management,
risks, uncertainties and other factors that may cause the actual performance trust, banking, deposit and loan products and services. These entities are all
of future markets to differ materially from the projections depicted in the affiliates and owned by BMO Financial Corp., a wholly-owned subsidiary of the
report. Past performance is not indicative of future results and current Bank of Montreal. Capital Advisory Services are offered by a division of BMO
performance may be higher or lower than that shown in the report. There Harris Bank, N.A. Member FDIC.
can be no certainty as to the extent or depth of any market downturn, nor
any assurance regarding the nature, extent or timing of markets rebounding.
When evaluating the report, you are cautioned not to place undue reliance NMLS #401052
on these forward-looking statements, which reflect judgments only as of
the date of the report. Investment returns fluctuate, and investments when
redeemed, may be worth more or less than the original investment. Broker-dealer and investment advisory services and insurance products are
offered through BMO Harris Financial Advisors, Inc. Member FINRA/SIPC. SEC-
Standardized performance returns include reinvestment of dividends, other registered investment adviser.
income and capital gains, which depict performance without adjusting for
the effects of taxation or the timing of purchases and sales. Performance Not all products and services are available in every state or location or
data is presented without deducting the investment advisory fees and through all entities within BMO Wealth Management or CTC | myCFO.
other charges that may be applicable. The deduction of such fees and other Securities, investment, and insurance products offered are: NOT A
charges (and the compounding effect thereof over time) will reduce portfolio DEPOSIT – NOT INSURED BY THE FDIC OR ANY FEDERAL GOVERNMENT AGENCY –
return. Unless otherwise indicated, traditional investment performance data NOT GUARANTEED BY ANY BANK – MAY LOSE VALUE.
generally represents a composite or representative portfolio return and is
shown gross of the investment manager’s advisory fees. Unless otherwise
-4-You can also read