TECHNICAL AND ECONOMICAL EVALUATION OF USING LOW-ENTHALPY GEOTHERMAL ENERGY IN RADOMSKO, POLAND
←
→
Page content transcription
If your browser does not render page correctly, please read the page content below
GEOTHERMAL TRAINING PROGRAMME Reports 2001
Orkustofnun, Grensásvegur 9, Number 7
IS-108 Reykjavík, Iceland
TECHNICAL AND ECONOMICAL EVALUATION OF USING LOW-
ENTHALPY GEOTHERMAL ENERGY IN RADOMSKO, POLAND
Jaroslaw Kotyza
Drilling, Oil and Gas Faculty,
University of Mining and Metallurgy,
al. Mickiewicza 30,
30-059 Kraków,
POLAND
kotyza@uci.agh.edu.pl
ABSTRACT
Technical and basic economical analysis for different ways of exploitation of
geothermal energy in Radomsko, Poland are presented in this paper. The analysis
includes calculation for two-wells and one-well systems of exploitation as well as for
a borehole heat exchanger. Moreover the possibility of using an existing well for
exploitation is examined in this paper. The calculations are based on geological,
hydro-geological and economical data from the Radomsko district – localized at the
Polish Lowland. The economy of each of the alternative exploitation schemes has
been analysed on an annual basis over the lifetime of the project. Finally, the location
of the first geothermal plant and planning of geothermal wells in Radomsko are
proposed.
1. INTRODUCTION
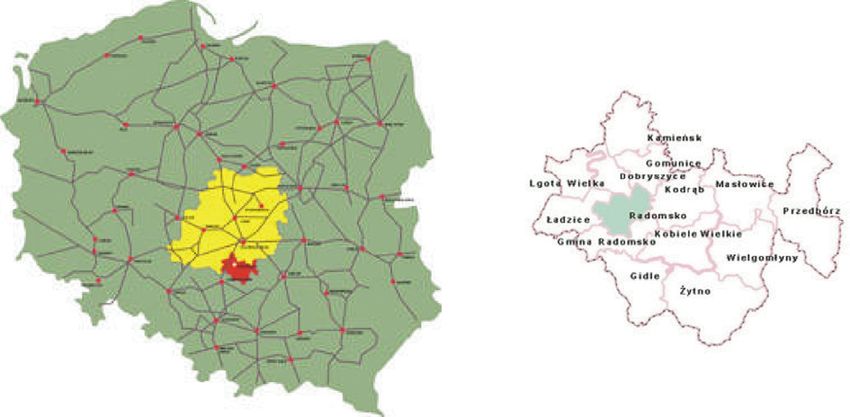
The Radomsko town is situated at the river Radomka in the central part of Poland, in the Lodz Region.
Radomsko is a city with a population of 52,000. A railway line between Katowice and Warsaw and a
highway, which will soon become a part of the motorway Cieszyn - Lodz - Gdansk, go through the town.
The highway is crossed with the other “A” road, Wroclaw - Kielce. Radomsko is just 190 km away from
Warsaw (capital of Poland), only 105 km from Katowice, 90 km from Lodz and 38 km from Czestochowa.
The location of the Radomsko district and town is shown in Figure 1. Radomsko is a developed city with
a modern technical infrastructure and advantageous location. Big attention is paid to protection of the
environment. In December 1998 the building of a sewage purification plant was finished. Biological and
mechanical sewage purification have been projected to neutralize liquid sewage in an average 24 hour
flow, estimated at about 28,000 m3. It means that it is possible to take sewage from 57 thousand citizens.
There are many parks in the city - places where children can play and places where everyone can go for
a walk and take some rest. The tophography of this region is not diversified; the height above sea level
is between 220 and 275 m.
143Kotyza 144 Report 7
FIGURE 1: Location of Radomsko district and town
2. GEOLOGICAL CONDITIONS
2.1 Geological stratigraphy
Radomsko district is located on the axis part of Miechow Basin adjacent to the Lodz Basin. This NW-SE
basin is about 50 km wide and is filled with sediments, the oldest dating from the Devon time, described
here below based on information from existing exploration wells:
a. At the top are sediments of Upper Cretaceous age covered by Tertiary and Quaternary surfaces. The
thickness of the Upper Cretaceous sediments is nearly 270 m. Main rocks of the Upper Cretaceous
age are light grey marls and white-grey limestones. The porosity of these sediments reaches about
22% in well Gidle-1.
b. The Lower Cretaceous sediments are made of green-grey siltstones with glauconite. The thickness
is from a few tens to a few hundred metres, porosity reaches about 35%, and permeability reaches
3250 mD, but is on average 1430 mD.
c. Upper Jurassic – Malm consists of dolomites, cavity limestones with silicates, ooliten limestones, and
dark grey marls (Gignoux, 1951). Reservoir properties of this container are improved, because the
roof of Malm is eroded. The thickness of these sediments is from 250 to 700 m, porosity is 4-17%.
d. Below Malm there are Middle Jurassic sediments – Dogger a good layer for a water reservoir. This
layer is built of Bajos sandstones, porosity is above 16%.
e. Lower Jurassic – Lias consists here of mudstones and siltstones with grey and green clays. Lias is
a very good containers layer, it is a common source of geothermal water in the Polish Lowland. The
thickness of these sediments is from 100 to 300 m. Porosity reaches about 20%.
f. Upper Triassic – Rhaetic sediments consist of brown red mud-sandstones. The thickness of these
sediments is from a few tens to a few hundred metres and the porosity is about 9%.
g. Upper Triassic – Keuper sediments are made of three layers - gypsum, sandstone and anhydrite-
dolomite. The best reservoir properties exist in the sandstone - reed sandstone. The thickness of all
these sediments is from 200 to 500 m and the porosity is 11-16%.
h. Middle Triasic – Muschelkalk consists of dark grey or pink limestones and brown-grey dolomites.
The porosity of these rocks is near 15%.
i. Lower Triassic – Upper Bunter sandstone consists of pink siltstones. The porosity of these sediments
is in the range 4-20%.Report 7 145 Kotyza
FIGURE 2: Geological cross-section across the Radomsko district
j. Below the Triassic sediments there are Permian sediments. These are represented by anhydrite and
dolomite, with good reservoir properties - 14% porosity and 17 mD permeability.
k. Below Permian there are Lower Carboni-ferous sediments made of greywacke sandstones, clay and
mudstones.
l. The oldest sediments penetrated by existing wells in this region are Devonian sediments (depth 3000-
3200 m). They are represented by mudstone - marles and organogenic limestones.
Figure 2 shows a geological cross-section through the area (Sokolowski, 1992).
2.2 Exploration well data and geophysical research
There exist 13 old exploration wells in this region. From them a lot of information has been gained about
the geology and the aquifers. About 30 seismic profiles have also been made here. The geological cross-
section in Figure 2 was made on the basis of information from the wells Gidle-1 and Gidle-5
(GEONAFTA, 1969a and b) and from the seismic profile 17-VII-81. The Gidle-5 well is located in the
Stobiecko Uniejskie in the west part of Radomsko town. The well was drilled in 1969 to a depth of 2765
m. It can probably be re-used as a geothermal well. More information about it is given in Figure 3, which
shows the geological profile of the well. The location of Gidle-5 and other wells is shown in Figure 4.
The figure also shows the temperature distribution in the area.
2.3 Reservoir properties of aquiferous layers and potential resources of geothermal energy
The main geographic, geological and reservoir parameters are presented in Tables 1 and 2 (Plewa, 1994).
TABLE 1: Geographic description of Radomsko region
Area Population Population density
(km2) (no.) (inhab/km2)
Lodz province 18,219 2,673,000 147
Radomsko district 1,443 125,000 87
Radomsko town 51 51,069 1,001Kotyza 146 Report 7
FIGURE 3: Geological and technical profile of Gidle-5 well
FIGURE 4: Temperature distribution at 3000 m depth and location of wellsReport 7 147 Kotyza
TABLE 2: Geothermal description of Radomsko region
(Sokolowski et al., 1999)
H h1 h2 N Tr E
Name of aquifer
(m) (m) (m) (%) (ºC) (109GJ)
Upper Cretaceous 200 270 50 15 15 -
Lower Cretaceous -70 50 30 22 20 -
Upper Jurassic -120 680 65 12 31 17
Middle Jurassic -800 200 40 15 44 27
Lower Jurassic -1000 150 60 15 49 48
Upper Triassic -1150 350 50 14 57 50
Middle Triasic -1500 350 90 15 67 125
Lower Triassic -1850 350 50 10 78 57
Zechstein -2200 300 70 12 88 105
Permian -2500 250 70 14 96 66
H - Depth of formation top; h1 - Average thickness of the sediment unit;
h2 - Average thickness of aquifers; N - Porosity;
Tr - Temperature of reservoir water; E - Heat energy;
3. DESCRIPTION OF DIFFERENT EXPLOITATION SYSTEMS
Geothermal energy development in the world has traditionally been related with natural heat anomalies
available at the surface or at shallow depths in particular regions. France has opened the way to a new
prospect for geothermal energy development, the use on a large industrial scale of geothermal energy in
normal gradient areas (BRGM, 1981). Not only was it shown that geothermal energy resources exist in
such areas, but also that it was technically possible and economically feasible to develop projects in such
conditions. In many resource maps and technical papers, zones suitable for geothermal development have
long corresponded with active plate boundaries. However, the geothermal resources are much more
widely distributed. In normal gradient regions, the heat flow is on average 60 kW/km2, and generally
varies from 40 to 100 kW/km2. Taking into account the thermal conductivity of rocks, this corresponds
to a gradient of 2-5/C per 100 m. Radomsko, like most Polish regions is similar to the Paris Basin. We
can use the French experience in Polish projects, and in Radomsko.
Three parameters play a distinct role in determining the amount of water which can be extracted from a
geothermal well of given characteristics:
• Fluid pressure in the reservoir, which determines whether the well is artesian, and the depth down to
which the water level is drawn during pumping;
• Permeability of the reservoir rock;
• Thickness of the reservoir.
The product of thickness and permeability is transmissivity. Transmissivity is the most important
parameter of geothermal reservoirs. Of course, water salinity, temperature and viscosity also play a role
in the production characteristics of the geothermal well. Permeabilities above 5 Darcy are considered
sufficient for geothermal production, but values of 20-50 Darcy are more suitable for average operations.
Values as high as 100 Darcy may be observed in very good geothermal reservoirs. This allows flow-rates
of 50-250 m3/h for wells of standard diameters.
The installed power of a geothermal system is expressed by the product of the flowrate and of the
temperature difference before and after using the water:
P = Q ρ c p (Tp − Ti ) / 3600 (1)Kotyza 148 Report 7
where P = Thermal power of the geothermal system [kWt];
Q = Flow-rate of the production well [m3/h];
D = Density of water [kg/m3];
cp = Heat capacity of water [kJ/kg K];
Tp = Temperature at the production well-head [/C];
Ti = Temperature of injection (after extraction of energy) [/C];
1/3600 = Conversion rate [h/s].
For a typical low-enthalpy field in
Poland with temperature differences
in the order of 30-50/C, the installed
power of a single geothermal system
varies from 1.20-10.75 MW.
Recognition of these parameters,
pressure and permeability is not
sufficient for Radomsko town, so we
can’t decide about exploitation
system without additional
information. A detailed analysis of
existing documentations from wells
and geophysical research is the first
step. After that we can make a
decision about the next step. There
are two ways, reconstruction of an
existing well, Gidle-5, or drilling a
new exploration well. Information
based on this will enable a decision
on the exploitation system. If
research gives good results about
aquifers, we can plan a one-well or
two-well exploitation system. If the
results are not positive we can use
the exploration well as a borehole
heat exchanger.
The location of this exploration well
is connected with potential
customers of geothermal energy.
The scheme in Figure 5 explains step
FIGURE 5: Proposal of exploration and work for by step the three alternative
geothermal development in Radomsko town proposals for Radomsko.
3.1 Use of existing oil and gas exploration well Gidle-5
Well Gidle-5, is located in the west part of Radomsko town. This well was drilled to search for gas and
oil and is 2765 m deep. The Gidle-5 well has the following casings:
20" 0-17.5 m, cemented to top;
13 d" 0-314.5 m, cemented to top;
9 e" 0-954.0 m, cemented to 530 m;
6 e" 0-2723.3 m, cemented to 2125 m.
After tests, cement plugs were made in the well at the depths 2670-2615 m, 2547-2460 m, 2105 m, 1150
m and 20-0 m (surface cement plug). Re-using this well requires the following work:Report 7 149 Kotyza
a. Reconstruction of Gidle-5 as a production and reinjection well.
Drilling out cement plugs;
Reinjection aquifer is limestones of Malm and/or sandstones of Bajocan, hence it is necessary to
perforate the well at the reinjection interval 950-1100 m;
Production aquifer is main dolomite and basic limestone of Permian, hence it is necessary to
perforate the well at the production interval 2500-2700 m.
b. Research of temperature mineralization and pressure of water, test of flowrate;
c. Running-in submersible pump to the well;
d. Running-in packer to the well between pipes 9e" and 4½";
e. Installing heat exchanger, pipelines and other surface equipment.
For this system, we can predict the following water parameters:
Temperature at the production wellhead: 80/C;
Temperature of injection: 20/C;
Flowrate: 60 m3/h.
The cost of drilling operations in Gidle-5 and related operations can be estimated as follows (in USD):
Well Gidle-5
Casing and packer 100,000 Wellhead 45,000
Preparatory job, rigging-up 130,000 Drilling out cement plugs 50,000
Testing 450,000 Rigging-down, reclamation 100,000
Total 875,000
Other operations
Submersible pump 30,000 Surface equipment 50,000
Total 80,000
Grand total 955,000 USD
3.2 Two-well exploitation system (doublet)
The scheme for a two-well exploitation system is shown in Figure 6. Realization of this system requires
the following jobs (Sokolowski, et al.,1999):
a. Drilling Radomsko-1, exploitation and injection well, with the following design:
Depth 2750 m;
Casing 20" 0-40 m;
13 d" 0-900 m;
9 e" 0-2300 m;
7" 2250-2750 m;
Reinjection aquifer is limestones of Malm and/or sandstones of Bajocan, hence perforating
reinjection interval is 950-1100 m;
Production aquife is Main dolomite and basic limestone of Permian, hence perforating production
interval is 2500-2700 m.
b. Research of temperature mineralization and pressure of water, test of flow-rate;
c. Drilling Radomsko-2 injection well
Depth 1350 m;
Casing 20" 0-40 m;
13 d" 0-600 m;
9 e" 0-1350 m;
d. Running submersible pump into the production well;
e. Installing heat exchanger, pipelines and other surface equipment.Kotyza 150 Report 7
FIGURE 6: Scheme of two-well exploitation system
In this system we can predict the following water parameters:
Temperature at the production wellhead 90/C;
Temperature of injection 20/C;
Flowrate 100 m3/h.
The cost of drilling and related operations can be estimated as follows (USD):
Well Radomsko-1
Casing 260,000 Wellhead 45,000
Preparatory job, rigging-up 130,000 Drilling and cementing 900,000
Testing 365,000 Rigging-down, reclamation 100,000
Total 1,800,000
Well Radomsko-2
Casing 130,000 Wellhead 45,000
Preparatory job, rigging-up 60,000 Drilling and cementing 500,000
Testing 282,000 Rigging-down, reclamation 75,000
Total 1,092,000
Other operations
Submersible pump 30,000 Surface equipment 70,000
Total 100,000
Grand total 2,992,000 USDReport 7 151 Kotyza
3.3 One-well exploitation system
A scheme of a one-well exploitation
system is shown in Figure 7.
Realization of this system requires
the following jobs:
a. D r i l l i n g Radomsko-1,
production and reinjection well
with the following design:
Depth 2750 m;.
Casing 20" 0-40 m;
13 d" 0-900 m;
9 e" 0-2300 m;
7" 2250-2750 m;
Reinjection aquifer is limestones
of Malm and/or sandstones of
Bajocan, hence perforating rein-
jection interval is 950-1100 m;
Production aquifer is Main
dolomite and basic limestone of
Permian, hence perforating pro-
duction interval is 2500-2700 m;
b. Exploration of temperature
mineralization and pressure of
water, test of flowrate;
c. Running-in submersible pump to
the well;
d. Running-in packer to the well
between pipes 9 e" and 4 ½";
e. Installing heat exchanger,
pipelines and other surface
equipment.
FIGURE 7: A scheme for a one-well exploitation system
In this system we can predict the following water parameters:
Temperature at the production wellhead 80/C;
Temperature of injection 20/C;
Flowrate 60 m3/h.
The cost of drilling and related operations can be estimated as follows (USD):
Well Radomsko-1
Casing and packer 290,000 Wellhead 45,000
Preparatory job, rigging-up 130,000 Drilling and cementing 900,000
Testing 450,000 Rigging-down, reclamation 100,000
Total 1,915,000
Other operations
Submersible pump 30,000 Surface equipment 50,000
Total 80,000
Grand total 1,995,000 USDKotyza 152 Report 7
3.4 Borehole heat exchanger
A scheme for a borehole heat
exchanger is shown in Figure 8.
Realization of this system requires
the following jobs:
a. Drilling Radomsko-1 for a
borehole heat exchanger with
the following design:
Depth 2750 m;
Casing 20" 0-40 m;
13 d" 0-900 m;
9 e" 0-2300 m;
7" 2250-2750 m.
2. Running production pipes 2 d"
into the well;
3. Running insulation pipes 4 ½"
into the well;
4. Running packer into the well
between the pipes of 4 ½" and
2 d";
5. Removing water from annular
space between the pipes 4 ½"
and 2 d";
6. Installing heat pump, heat
exchanger, pipelines and other
surface equipment.
FIGURE 8: A scheme of a borehole heat exchanger
In this system we can predict the following water parameters:
Temperature at the production wellhead 50/C;
Temperature of injection 5/C;
Flowrate 15 m3/h.
The cost of drilling and related operations can be estimated as follows (USD):
Well Radomsko-1
Casing 260,000 Production pipes 100,000
Preparatory job, rigging-up 130,000 Drilling and cementing 900,000
Testing 50,000 Rigging-down, reclamation 100,000
Total 1,540,000
Other operations
Heat pump 100,000 Surface equipment 70,000
Total 170,000
Grand total 1,710,000 USDReport 7 153 Kotyza
3.5 Comparison and selection of the best solution
On the basis of Equation 1, we can calculate the thermal power for individual solutions, as follows:
Two-well exploitation system (doublet):
m3 1 h kg kJ
P = 100 ⋅ ⋅ 997 3 ⋅ 4.2 ⋅ (90 °C − 20 °C ) ≈ 8,145 kWt
h 3600 s m kg °C
One-well exploitation sytem:
m3 1 h kg kJ
P = 60 ⋅ ⋅ 997 3 ⋅ 4.2 ⋅ (80 °C − 20 °C ) ≈ 4,184 kW t
h 3600 s m kg °C
Borehole heat exchanger:
m3 1 h kg kJ
P = 15 ⋅ ⋅ 997 3 ⋅ 4 .2 ⋅ (50 °C − 5 °C ) ≈ 773 kW t
h 3600 s m kg °C
Borehole heat exchanger with heat pump:
P = 773 kW ⋅ 1 .33 ≈ 1,028 kW t
Comparison of investment costs and thermal power for individual solutions is shown in Table 3. There,
six different cases are considered. Three of them are based on new wells only, while the other three are
based on the utilisation of the existing Gidle-5 well.
TABLE 3: Comparison of investment costs and thermal power for individual solutions
System with new wells System with existing Gidle-5 well
Exploitation system Cost Power Cost of 1 kWt Cost Power Cost of 1 kWt
(USD) (kWt) (USD/kWt) (USD) (kWt) (USD/kWt)
Two-wells 2,992,000 8,145 367 1,962,000 8,145 241
One-well 1,995,000 4,184 476 955,000 4,184 228
Borehole heat exchanger 1,710,000 773 2,212 600,000 773 776
This comparison shows us that for a system with new wells, the two-well exploitation system is the best
solution, thermal power is highest and the cost of 1 kWt is the smallest. For a system including the
existing Gidle-5 well, the total cost is reduced by about 1 million USD in every solution, and the cost of
1 kWt is similar for two-well and one-well systems.
3.6 Proposal for location of a geothermal plant
The geothermal plant should be situated in the west part of the city near the Gidle-5 well. Local
authorities are planning development of recreation and sport activities in this part of the city. Heat energy
from the geothermal plant can be used in a cascade system for house heating of this part of the town and
for heating a swimming pool situated in a planned recreational terrain. The location of the existing and
new wells, as well as the area for recreation and sport activities is shown in Figure 9.Kotyza 154 Report 7 FIGURE 9: Street map of Radomsko with existing district heating and planned geothermal system 4. ECONOMIC ANALYSIS OF A GEOTHERMAL PLANT The basic methods of analysis, which rely upon the discounting of payments to adjust for differences in timing are very simple. However, there are many different organizational contexts within which appraisals are carried out and these affect the way in which cost and earning streams are determined and, hence, their magnitudes. 4.1 Economical parameters Cash flow (CF). The financial profile of any project consists of a series of positive and negative payments over time. The basic problem of financial/economic appraisal is to adjust the cash flow to an equivalent basis in time so that they can be compared with each other or with those of other projects. There are a number of ways in which this is done and a variety of indices can be formulated which measure aspects of the economic/financial value of a project. Discount rate. The value of money does not depend only on its actual amount but also on the time at which the money is spent. The profits result from the ownership of the money in any form. Present value PV of the amount FV (future value) got after years j equals
Report 7                                              155                                            Kotyza

                                                             FV j
                                              PV j =                                                   (2)
                                                       (1 + r ) j

where r      = Discount rate;
      j      = Number of years.

Discounting of cash flows is of great importance for economical evaluation of an investment. Investment
costs and future profits are disclosed in different steps of execution of a venture. That is why discounting
of the value over a specific time (year) is a necessity. It makes possible the comparison of values of
spent/earned money in different years.

Discount rates can be specified in different ways. Equation 3 gives good estimates of real discount rates.
                                                       rc − i                                          (3)
                                                ra =
                                                       1+ i

where ra = Real discount rate;
      rc = Interest rate of bank credits.

A more careful approach is the following equation:
                                                       rk − rd
                                               ra =                                                    (4)
                                                        1+ i
where rd = Interest rate of bank deposits;
      i = Real inflation rate.

For estimating long-term investment ventures, which are important for a community, or for profits not
shown directly, calculations of a social discount rate are often applied (2-4%).

Net present value (NPV) calculation is the dynamic method which takes into consideration the change of
the money's value over time. The basis for calculation of net present value is the discounted values of
annual cash flows. The calculation of net present value is performed in three stages. The individual
payments are discounted by the appropriate amounts to determine their present values. The present value
of earnings E, in year j, PVE, is calculated by Equation 5, and the present value of costs Kj in year j, PVKj
by Equation 6. This reduces all costs and earnings to an equivalent basis in time.
                                                             Ej
                                           PVE j =                                                     (5)
                                                      (1 + r ) j

where Ej = Earnings in year j;

and
                                                               Kj
                                             PVK j =                                                   (6)
                                                         (1 + r ) j

where Kj = Costs in year j.

The total present values of earnings PVE, and of costs, PVK, are obtained by summation in the following
equations:
                                                      j =n
                                                                  Ej
                                            PVE = ∑                                                    (7)
                                                      j =1   (1 + r ) j
Kotyza 156 Report 7
and
j =n
Kj
PVK = ∑ (8)
j =1 (1 + r ) j
where n = Time [years].
The net present value, NPV, of the whole project is calculated by taking the difference between earnings
and costs and subtracting any initial investment I, as shown in Equation 9:
j =n
Ej − K j
NPV = PVE − PVK − I = ∑ −I (9)
j =1 (1 + r ) j
If the net present value is positive at this discount rate, the project is viable. If it is negative then the
project is non-viable. When comparing the net present value of two projects, it is rational to choose the
higher (Harrison et al., 1990).
Internal rate of return (IRR). This parameter shows the interest rate earned by investing in a particular
venture and receiving cash flows as a result of that investment without regard to any other investments
(Lund et al., 1998).
4.2 Investment costs of building a direct use geothermal plant and expected profit
The economic calculations shown below are made by the present value method, where all costs and
revenues are discounted back to the present value to arrive at a net present value for the project (Lund et
al., 1998). Table 3 includes the main economical information for the individual variants of exploitation.
Six different alternatives have been considered:
C Alternative I: Two-well system of exploitation with existing Gidle-5 well. This means that the
existing Gidle-5 well will be used for reinjection, and a new Radomsko-1 well used as a production
well.
C Alternative II: Two-well system of exploitation with a new Radomsko-1 well. This case needs two
new wells, the production well Radomsko-1 and reinjection well Radomsko-2.
C Alternative III: One-well system of production with the existing Gidle-5 well. This means that the
existing Gidle-5 well will be used for production and for reinjection at the same time.
C Alternative IV: One-well system of production with a new Radomsko-1 well. This means that a new
Radomsko-1 well will be used for production and for reinjection at the same time.
C Alternative V: Borehole heat exchanger in the existing Gidle-5 well. This means that a borehole heat
exchanger will be installed in the existing Gidle-5 well.
C Alternative VI: Borehole heat exchanger in a new Radomsko-1 well. This means that a borehole heat
exchanger will be installed in a new Radomsko-1 well.
Foregoing information enables calculation of some economical parameters such as cash flow (CF), net
present value (NPV) and internal rate of return (IRR). Results of these calculations for each individual
variant are shown in the charts in Figures 10-15.
Comparison of different variants enabled a choice of the best solution for Radomsko which is alternative
I. This variant has the best economical and technical properties. This case can give the technical and
economical parameters shown in Table 5.Report 7 157 Kotyza
TABLE 4: Economical analysis for individual systems of exploitation
Two-well system One-well system Boreh. heat exch.
Ex. well New well Ex. well New well Ex. well New well
Alternative I II III IV V VI
Investment cost
Drilling and related operations [USD] 1,962,000 2,992,000 955,000 1,995,000 600,000 1,710,000
District heating [USD] 2,880,000 2,880,000 1,800,000 1,800,000 360,000 360,000
price of 1 m pipeline [USD] 300 300 300 300 300 300
length of pipeline [m] 9,600 9,600 6,000 6,000 1,200 1,200
Thermal station building [USD] 100,000 100,000 100,000 100,000 100,000 100,000
Price of 1 m2 surface 2,000 [USD] 50 50 50 50 50 50
Design and management* [USD] 247,100 298,600 142,750 194,750 53,000 108,500
Total investment cost [USD] 5,189,100 6,270,600 2,997,750 4,089,750 1,113,000 2,278,500
Investment cost in individual years
2002 30% [USD] 1,556,730 1,881,180 899,325 1,226,925 333,900 683,550
2001 40% [USD] 2,075,640 2,508,240 1,199,100 1,635,900 445,200 911,400
2003 20% [USD] 1,037,820 1,254,120 599,550 817,950 222,600 455,700
2004 10% [USD] 518,910 627,060 299,775 408,975 111,300 227,850
Annual operating cost** [USD] 77,837 94,059 44,966 61,346 16,695 34,178
Own financial means [USD] 2,335,095 2,821,770 1,348,988 1,840,388 500,850 1,025,325
CREDIT***
Pay back 12 years
Scale 55% of investment
Beginning of repayment 2 years
Interest rate 8%
Value [USD] 2,854,005 3,448,830 1,648,763 2,249,363 612,150 1,253,175
YIELD
Operating time in year 300 days
Price of 1 GJ energy [USD] 8 8 8 9 10 20
Available thermal power [kW] 8,145 8,145 4,184 4,184 1,028 1,028
Heat consumption in year [GJ] 211,118 211,118 108,449 108,449 26,646 26,646
Annual yield [USD] 1,688,947 1,688,947 867,594 976,044 26,458 532,915
Year of investment beginning 2002
Exploitation time 5 years
Discount rate 10%
Income tax 22%
*
Design and management costs are 5% of the total investment cost;
**
Annual operating cost is 1.5% of the total investment cost;
***
Credit from bank was considered as a special type of credit connected with low interest rates
because of the pro-ecological character of the solution.
TABLE 5: Main technical and economical parameters for the best alternative, no. 1
Technical Economical
Temperature of exploited water 90/C Total investment cost 5,189,100 USD
Temperature of reinjected water 20/C Annual operating cost 77,837 USD
Flowrate 100 m3/h Accumulated cash flow 22,556,582 USD
Available thermal power 8,145 kW Net present value 3,065,797 USD
Internal rate of return 17%Kotyza 158 Report 7
3 0,0 00 ,00 0
20%
22,556,582 US D
IR R
2 5,0 00 ,00 0
15%
16%
2 0,0 00 ,00 0 10%
5%
1 5,0 00 ,00 0
0%
1 0,0 00 ,00 0
-5%
y ears 2003 2007 2011 2015 2019 2023 2027
5 ,0 00,00 0
3,065,797 US D
USD 0
-5 ,0 00,00 0
A cc um ulated cas h flow (CF)
Net pres ent value (NP V )
-10 ,0 00,00 0
yea rs 20 03 2 005 20 07 2 009 201 1 20 13 2 015 201 7 2 019 2 02 1 20 23 2 025 202 7 20 29
FIGURE 10: Economic analysis of a two-well system of
exploitation with the existing Gidle-5 well (Alternative I)
25,000 ,000
15% 20,393,647 US D
IR R
10%
20,000 ,000 12%
5%
15,000 ,000 0%
-5%
-10%
10,000 ,000
-15%
years 2004 2009 2014 2019 2024
5,000 ,000
1,645,063 US D
USD 0
-5,000 ,000
A c c um ulated c as h flow (CF)
Net pres ent value (NP V )
-10,000 ,000
yea rs 2003 20 05 2007 20 09 2011 201 3 2015 2 017 2019 2 021 2023 2025 2027 2029
FIGURE 11: Economic analysis of a two-well system of
exploitation with a new Radomsko-1 well (Alternative II)
1 4,0 0 0,0 0 0
20% 10,922,768 US D
IR R
15%
1 2,0 0 0,0 0 0
14%
10%
5%
1 0,0 0 0,0 0 0
0%
-5%
8,0 0 0,0 0 0
-10%
-15%
6,0 0 0,0 0 0
-20%
y ears 2003 2007 2011 2015 2019 2023 2027
4,0 0 0,0 0 0
2,0 0 0,0 0 0
1,138,513 US D
USD 0
-2 ,0 0 0,0 0 0
A c cum ulated c as h flow (CF)
Net pres ent value (NP V )
-4 ,0 0 0,0 0 0
ye a rs 2 00 3 2 0 05 2 00 7 20 0 9 2 01 1 2 01 3 20 15 2 0 17 20 1 9 2 0 21 2 02 3 20 2 5 2 0 27 2 02 9
FIGURE 12: Economic analysis of a one-well system of
exploitation in the existing Gidle-5 well (Alternative III)Report 7 159 Kotyza
1 4,00 0,00 0
15% 10,853,594 US D
1 2,00 0,00 0 IR R
10%
10%
1 0,00 0,00 0 5%
0%
8,00 0,00 0
-5%
6,00 0,00 0 -10%
-15%
4,00 0,00 0
yea rs 2 003 2007 20 11 2 015 201 9 2 023 2027
2,00 0,00 0
USD 0
388,030 US D
-2,00 0,00 0
A c c um ulated c as h flow (CF)
-4,00 0,00 0
Net pres ent value (NP V )
-6,00 0,00 0
yea rs 200 3 2 005 20 07 2009 20 11 201 3 2 015 201 7 2 019 20 21 2023 20 25 202 7 2 029
FIGURE 13: Economic analysis of a one-well system of
exploitation with a new Radomsko-1 well (Alternative IV)
4,000,000
15%
3,500,000 IR R
10% 3,164,805 US D
10%
3,000,000 5%
2,500,000 0%
-5%
2,000,000
-10%
1,500,000
-15%
1,000,000 y ears 2003 2007 2011 2015 2019 2023 2027
500,000
USD 0
110,522 US D
-500,000
A c c um ulated c as h flow (CF)
-1,000,000 Net present value (NP V )
-1,500,000
years 2003 2005 2007 2009 2011 2013 2015 2017 2019 2021 2023 2025 2027 2029
FIGURE 14: Economic analysis of a borehole heat exchanger
in the existing Gidle-5 well (Alternative V)
7 ,00 0,00 0
15% 6,613,014 US D
6 ,00 0,00 0 IR R
10%
11%
5 ,00 0,00 0 5%
0%
4 ,00 0,00 0
-5%
3 ,00 0,00 0
-10%
2 ,00 0,00 0 -15%
y ears 2003 2007 2011 2015 2019 2023 2027
1 ,00 0,00 0
USD 0
176,556 US D
-1 ,00 0,00 0
A c c um ulated c as h flow (CF)
-2 ,00 0,00 0
Net pres ent value (NP V )
-3 ,00 0,00 0
years 2003 20 05 2 007 200 9 20 11 2013 201 5 20 17 2019 202 1 2 023 2025 202 7 2 029
FIGURE 15: Economic analysis of a borehole heat exchanger
in a new Radomsko-1 well (Alternative VI)Kotyza 160 Report 7
4.3 Financing of geothermal projects
There are basic types of international financing available to the energy sector (Elíasson, 2001) which are
Grants;
Special purpose funds;
Loans.
It is possible to obtain partial financing of definitive, well-defined and feasible geothermal development
projects in the form of a grant from EU funds provided such a project unequivocally falls under an
appropriate key-action specification set by the European Commission. These partial (Report 7 161 Kotyza
C KBN - The State Committee for Scientific Research is a governmental body which was set up by the
Polish Parliament on 12th January 1991. The act has established the committee as the supreme
authority on state policy in the area of science and technology. According to the act, the committee
is the major central governmental source of funds for research. The committee became active during
the period of transition from a centrally-planned system to a market economy.
5. CONCLUSIONS
There are some aquifers in the Radomsko district, which can be used as a source of low-temperature
geothermal water. The best conditions are in Zechstein and Permian sediments. The depth of these is
from 2200 m to 2500 m and the reservoir temperature is between 88 and 96/C.
Water from aquifers can be exploited in three ways:
C Two-well exploitation system, with 8,145 kWt available thermal power;
C One-well exploitation system, with 4,184 kWt available thermal power;
C Borehole heat exchanger with 1,028 kWt available thermal power.
Total drilling costs and related operations are
C 2,992,000 USD for a two-well system;
C 1,995,000 USD for a one-well system; and
C 1,710,000 USD for a borehole heat exchanger.
The well Gidle-5 exists already in the Radomsko town. This well might be used for exploitation of
geothermal energy. If this is possible, the cost of the exploitation system can be reduced by 30%.
Technical and economical analysis show which exploitation system brings the best solution. It shows that
the best way of exploiting geothermal energy in Radomsko is a two-well system with the existing Gidle-5
well. The total investment cost for this variant amounts about 5,189,100 USD, and the net present value
is 3,065,797 USD. The internal rate of return is 17% for 25 years of exploitation.
Polish and international institutions can finance geothermal projects such as this. Such Polish institutions
are: EcoFund, The National Fund for Environmental Protection and Water Management and KBN - The
State Committee for Scientific Research. There are also some international grants available, such as
ALTENER, SAVE, CRAFT and others from Vth Framework Programme (5FP) and other independent EU
programmes.
Heat from the described system can be used in a cascaded system for house heating in the western part
of the town and for heating a swimming pool situated in a recreation area scheduled in the western part
of the town.
ACKNOWLEDGEMENTS
I am very appreciative to all persons who provided me with help, guidance and advice during the whole
period of study and formulation of the final report. I would especially like to thank Mr. Ingvar B.
Fridleifsson for giving me the chance to attend the UNU Geothermal Training Programme, Mr. Árni
Ragnarsson, my advisor, for his assistance during the data analysis, and preparation of this report and Mr.
Lúdvik S. Georgsson and Ms. Gudrún Bjarnadóttir for a lot of additional organisational work. I am very
grateful to all lecturers for comprehensive presentations. I also wish to extend my gratitude to the
Government of Iceland and the United Nations University for the Fellowship.Kotyza 162 Report 7
I would like to thank people from Poland, Prof. Jakub Siemek and Prof. Stanislaw Rychlicki from the
Drilling, Oil and Gas Faculty in the University of Mining and Metallurgy for giving me permission to
participate in this training. I would like also to thank Prof. Julian Sokolowski who gave me a lot of
practical knowledge about geothermal energy. Finally, thanks to Beata Kepinska for her advice and help.
REFERENCES
BRGM, 1981: Low enthalpy geothermal energy technical and economic feasibility, development in
France. Bureau de Recherches Geologiques et Minieres, Geothermal Department, Orleans Cedex, 9 pp.
Elíasson, E.T., 2001: Feasibility analyses and financing of geothermal projects. UNU G.T.P., Iceland,
unpublished lectures.
GEONAFTA, 1969a: Geological documentation of Gidle-1 well. Geological Bureau GEONAFTA,
Krakow, unpublished data report.
GEONAFTA, 1969b: Geological documentation of Gidle-5 well. Geological Bureau GEONAFTA,
Krakow, unpublished data report.
Gignoux M., 1951: Stratigraphic geology. W.H. Freeman and Co, San Francisco and London, 682 pp.
Harrison, R., Mortimer, N.D., and Smárason, Ó.B., 1990: Geothermal heating: A handbook of engineering
economics. Pergamon Press, Oxford, 558 pp.
Lund, J.W., Lienau, P.J., and Lunis, B.C., 1998: Geothermal direct- use engineering and design
guidebook. Geo-Heat Center, Oregon Institute of Technology, Or, USA, 454 pp.
Plewa S., 1994: Distribution of geothermal parameters on the territory of Poland (in Polish).
Wydawnictwo CPPGSMiE PAN, Krakow, 138 pp.
Sokolowski J., 1992: Geosynoptical atlas of Poland. Wydawnictwo CPPGSMiE PAN, Kraków, 52 maps.
Sokolowski, J., Kotyza, J., Florek, R., Ludwikowski, B., 1999: Estimate resources of geothermal energy
for Radomsko. POLGEOTERMIA Sp. z o.o., Krakow, unpublished project.You can also read