Climate Hazard Modelling: Impact of Floods on Credit Risk for the U.K. Mortgages - July 8, 2021
←
→
Page content transcription
If your browser does not render page correctly, please read the page content below

Climate Hazard Modelling:
Impact of Floods on Credit Risk for the U.K.
 Mortgages
 July 8, 2021
Moody's Analytics operates independently of the credit ratings activities of Moody's Investors
Service. We do not comment on credit ratings or potential rating changes, and no opinion or
analysis you hear during this presentation can be assumed to reflect those of the ratings agency.

 Climate Hazard Modelling 2
Today’s Speakers
 Predictive Analytics

Luca Magni Petr Zemcik, PhD Natalie Ambrosio Preudhomme Cecilia Bocchio
 Director Senior Director Director, Four Twenty Seven Assistant Director

 Climate Hazard Modelling 3
Moody’s Climate Solutions
 Forward-looking exposure metrics and risk analytics

Climate Risk Identification Climate Risk Quantification
Physical Risk Data Macroeconomic Scenarios
Forward-looking data capturing exposure Climate-adjusted macroeconomic
to climate hazards for: 5,000 listed forecasts with an 80-year horizon. Fully
companies (10,000 by end of 2021) with aligned with the Network for Greening
2.5m corporate facilities globally; 17m the Financial System’s (NGFS)
commercial real estate properties in the representative scenarios for physical
US; and global sovereigns. On-demand and transition risk.
scoring is available.
 Transition Risk Data
 Assessments of 5,000 companies Climate-Adjusted PDs
 (10,000 by end of 2021) to identify Climate-adjusted probability of default (PD)
 transition risk exposure from different for listed and unlisted companies powered
 fossil fuel resource types and power by Moody’s award-winning Expected
 generation technologies. On-demand Default Frequency (EDF™) model.
 scoring is available.
Climate Governance Climate Pathway Scenarios
Assessments of 5,000 companies’
 Tools that translate climate pathways into
climate risk disclosures and their ability
 financial risk variables to inform asset
to seize opportunities presented by
 allocation and liability models. Based on
climate change.
 Moody’s award-winning scenario
 generation software.

 Climate Hazard Modelling 4
Agenda
1. Climate change and credit risk quantification framework: The case of
 mortgages
2. Moody’s ESG Solutions’ location-specific physical climate risk scores for
 the U.K.: Floods, heat stress, hurricane and typhoons, sea level rise, water
 stress, and wildfires
3. Do flood events affect probability of default for mortgages?
4. Constructing score-adjusted climate change scenarios and climate-
 adjusted credit risk metrics
5. Climate Risk Adjustment

 Climate Hazard Modelling 5
Climate change and credit

1
 risk quantification
 framework: The case of
 mortgages
Polling Question
1. Have you already made a climate risk adjustment for a
 mortgage portfolio risk parameters (PD/LGD/Losses)?
 A. Yes, leveraging on CBES 2021 instructions.
 B. Yes, for a regulatory exercise other than CBES 2021.
 C. Yes, for internal purposes.
 D. No, not yet.

 Climate Hazard Modelling 7
Retail Credit Risk – Enhanced Framework

 CO2 INPUTS MODELS OUTPUTS
Pathway
 +
Carbon Forecasts, Account-level,
 Tax & Economic Data Default/Prepayment Staging & forward-looking,
 Other Impairment scenario-conditional
Climate (Scenarios)
 Calculations cash-flows
Policies
 LGD
 Scenario projections
 Loan Level Data Risk simulations, for risk metrics such
Location cash-flow as ECL, Loss
Specific (Portfolio snapshot) EAD calculations Distribution, Credit
Climate VaR
Hazards

 Climate Hazard Modelling 8
0.0
 5.0
 10.0
 15.0

 -15.0
 -10.0
 -5.0
 2020Q1
 2021Q1
 2022Q1
 2023Q1
 2024Q1

 HPI, % change yr ago
 2025Q1
 2026Q1
 2027Q1
 2028Q1
 2029Q1
 2030Q1
 2031Q1
 2032Q1

 NAPA
 2033Q1
 2034Q1
 2035Q1
 2036Q1
 2037Q1
 2038Q1
 2039Q1

 EPA
 2040Q1
 2041Q1
 2042Q1
 2043Q1
 2044Q1
 2045Q1
 2046Q1
 2047Q1 LPA
 2048Q1
 2049Q1
 2050Q1

 %
 3.0
 4.0
 5.0
 6.0
 7.0
 8.0
 9.0

 2020Q1
 2021Q1
 2022Q1
 2023Q1
 Projections for HPI and unemployment rate

 2024Q1
 2025Q1
 2026Q1
 Unemployment Rate, %

 2027Q1
 2028Q1
 Climate Change Scenarios for the UK

 2029Q1
 2030Q1
 NAPA

 2031Q1
 2032Q1
 2033Q1
 2034Q1
 2035Q1
 2036Q1
 100
 110
 120
 130
 140
 150
 160
 170

 90

 2037Q1
 EPA

 2038Q1 2020Q4
 2022Q4
 2039Q1
 2024Q4
 2040Q1 2026Q4
 2041Q1 2028Q4
 2042Q1 2030Q4
 2043Q1 2032Q4
 2044Q1 2034Q4
 LPA

 2045Q1 2036Q4
 2046Q1 2038Q4
 2040Q4
 2047Q1
 2042Q4
 2048Q1
Climate Hazard Modelling
 LPA

 2044Q4
 EPA
 Real GDP Index, 2020Q4 = 100

 NAPA

 2049Q1 2046Q4
 2050Q1 2048Q4
 2050Q4
9
Climate-Adjusted Credit Risk Approach
 Scenario
 Portfolio Standard Model Loss Distribution
 Climate Risk
 NO

 Frequency Climate
 of Climate Event
 Events Flag
 PDs, LGDs
 YES
 Severity of
 Climate PDs (S), LGDs (S)
 Events

 HPI(S), UR(S)

 Climate Hazard Modelling 10
Location-specific physical
 climate risk scores for the

2
 U.K.: Floods, heat stress,
 hurricane and typhoons,
 sea level rise, water stress,
 and wildfires
Polling Question
2. What does your firm use physical risk data for?
 A. We don’t use physical climate data
 B. To help comply with risk disclosure requirements
 C. Integrate climate risk into pre-acquisition/loan origination
 D. Integration into risk management processes/stress tests
 E. Multiple uses

 Climate Hazard Modelling 12
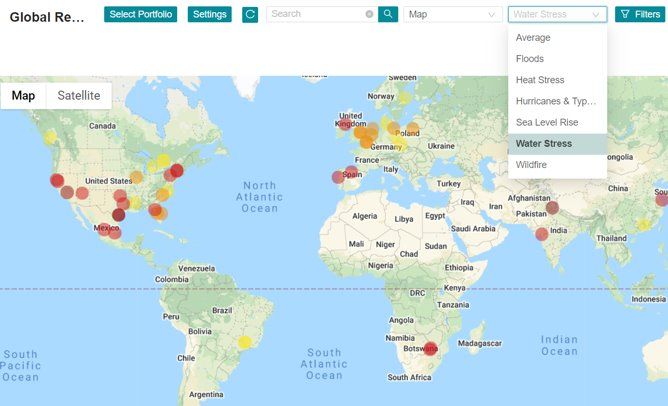
Physical Climate Risk for Mortgages
 » Based on global climate models & environmental datasets

 » Forward-looking scores for each climate hazard

 » Detailed underlying indicators

 Floods

 Heat Stress

 Hurricanes & Typhoons

 Sea Level Rise

 Water Stress

 Wildfires

 Source: Four Twenty Seven, part of Moody’s ESG Solutions

 Climate Hazard Modelling 13
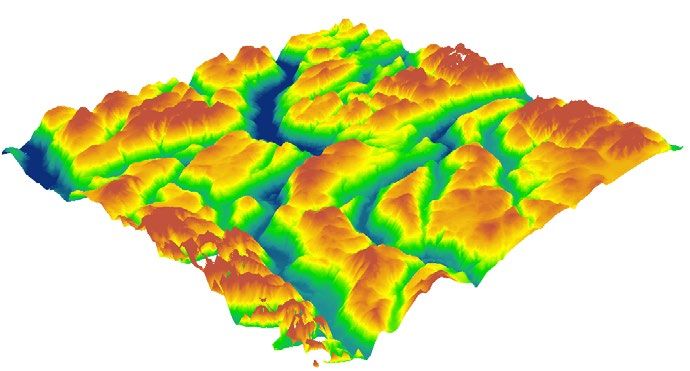
From Climate Data to Risk Scores
 Air, ocean, and ice
 (including cliff) dynamics

 Elevation data (SRTM)

 Historical sea levels and
 subsidence

 Tidal gauge data
 for storm surge Source: Four Twenty Seven

 Climate Hazard Modelling 14
Assessing Climate Risk for a Property

 Climate Hazard Modelling 15
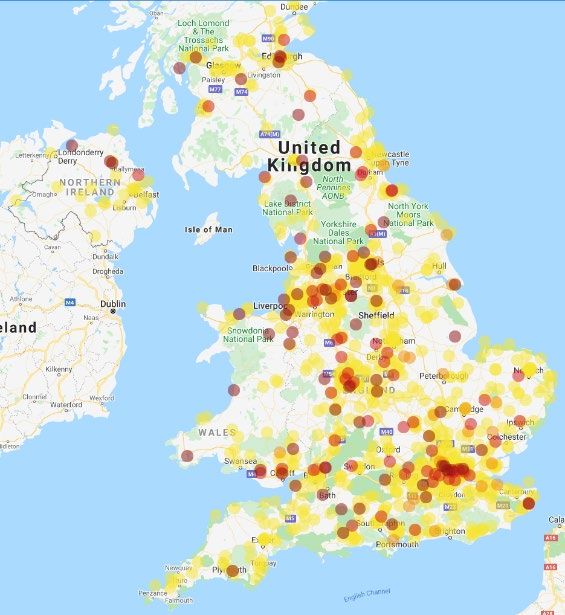
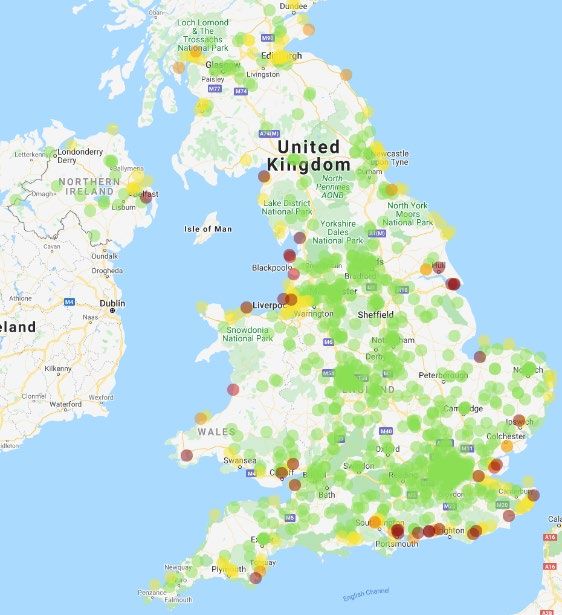
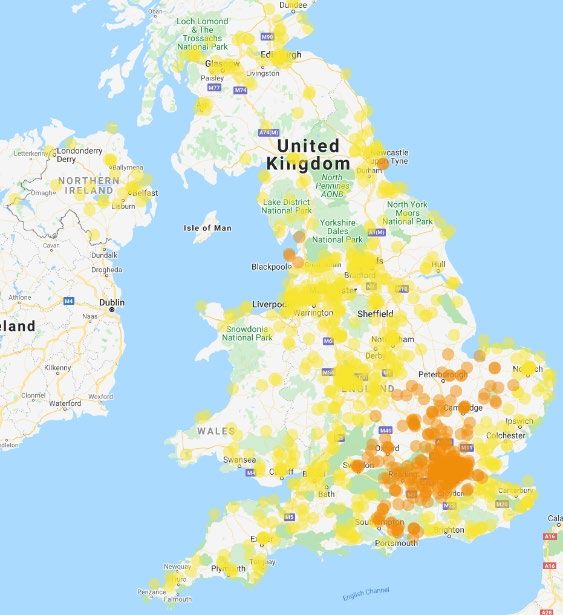
Physical Climate Risk Score
Moody’s ESG Solutions Data
» 1,000 random names of the portfolio and ran
 the physical risk climate scores within the Floods Score Sea Level Rise Score Water Stress Score
 on-demand scoring application

» Six climate hazards assessed at the
 facility-level: floods, sea level rise, water

 UK Sample (1000 facilities)
 stress, heat stress, wildfire, and hurricanes
 & typhons

» Majority of the portfolio is low risk but some
 material hotspots across specific climate
 hazards

» While few UK facilities may lead to Red
 Flags, UK Floods and Seal Level Risk
 scores can easily double or triple, amplifying
 damages for local economies and assets

» Flood risk followed by Water Stress appears
 to the be prominent climate hazards
 affecting the portfolio analysed

 Climate Hazard Modelling 16
3
 Do flood events affect
 probability of default for
 mortgages?
Polling Question
3. What is the expected impact of climate events such as floods
on PD for mortgages?
 A. The impact is statistically negligible.
 B. PD increases by less than 1%
 C. PD increases by more than 1%.

 Climate Hazard Modelling 18
Linking Probability of Flood Events to Credit Risk
 Return period of
 inundation
 Flood Frequency Score

 1-in-5 years When will the event occur?
 1-in-10 years
 1-in-20 years
 » Impact on macroeconomic drivers (e.g.,
 1-in-50 years Climate Event HPI).
 1-in-75 years Simulation
 1-in-100 years » Impact on credit risk metrics such as PDs &
 Engine
 1-in-200 years LGDs (idiosyncratic impact).
 1-in-250 years
 1-in-500 years Frequency scores
 1-in-1000 years are translated into How severe will the hazard be?
 None probability of events
 based on the
 property’s location.

 Climate Hazard Modelling 19
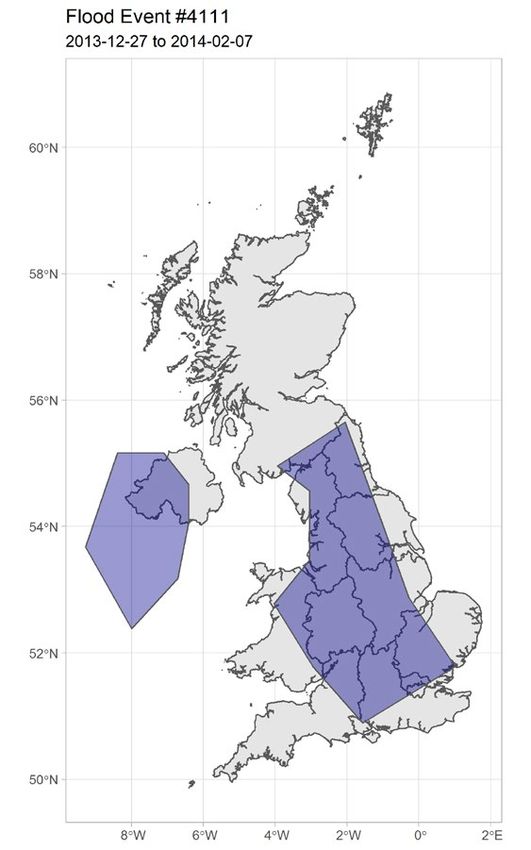
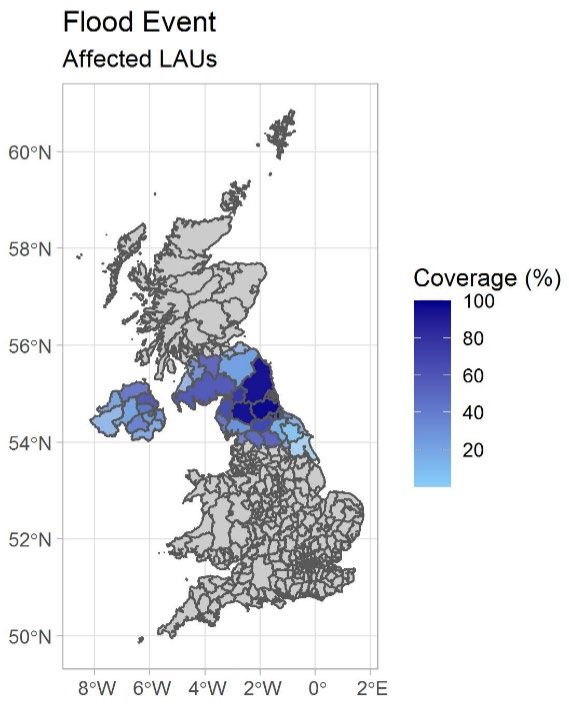
Climate Adjustment to the PD Model
 From standard PD metrics to climate-adjusted PDs
Standard PD model: Climate-Adjusted PD model:

 � �

ln = α + β + ε Estimated ln = ln + γ + μ
 1 − 1 − �
 1 −
 Uncaptured variability:
 Account-specific data, Could it be explained by 0
 macroeconomic drivers climate events? = �
 1

» Determine affected areas/regions: we analysed impact at NUTS1, NUTS2 and NUTS3 levels for the UK.

» Define flooded vs. partially flooded areas: we explored different levels of % of area flooded (>0%, >20%, >40%, >50%, >60%, >70%, >80%,
 >90%, 100%).

» Ensure event effect is captured (instead of seasonality effect).

» When is the effect in PD observed?: we analysed the impact 0 to 6 months after the flood event was observed.
 j: specific event
 �
 i: NUTS level
 p: proportion of area affected by the event
 For each event we compute: ln = ln + γ , , , + + μ
 1 − �
 1 − t: time of the event
 k: months after the event
 Climate Hazard Modelling 20
Flood Events Data
 Data related to
 74 flood events
 in the UK from
 1989
Floods data

Location

Start and End dates

Duration

Severity

Magnitude

Cause (heavy rain, tropical
cyclone, rain and snowmelt,
torrential rain, storm surge)
Number of casualties

Number of displaces

 Climate Hazard Modelling 21
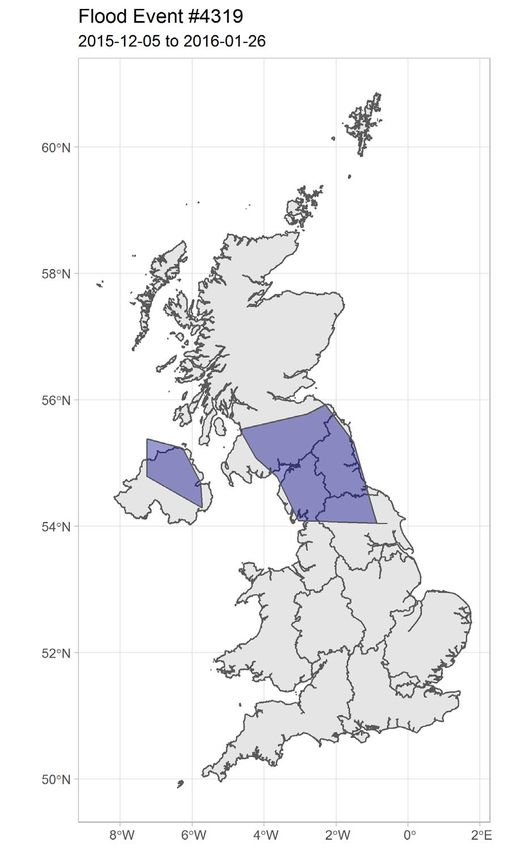
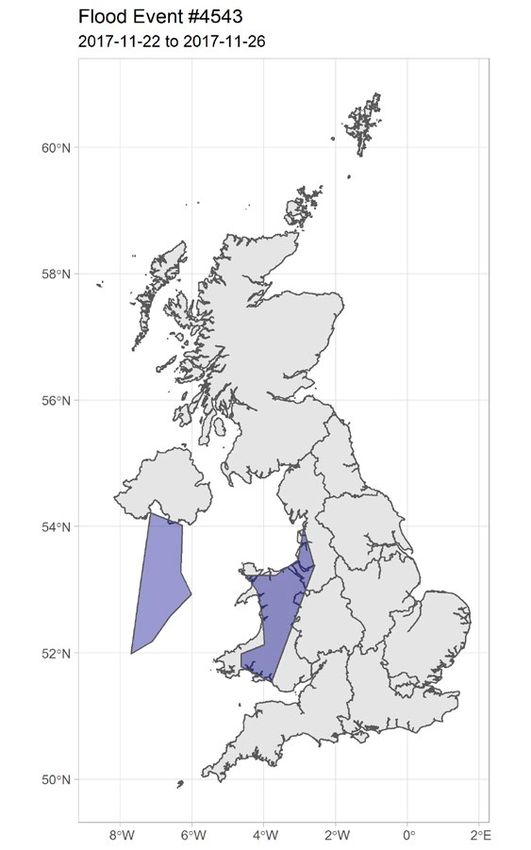
Defining Impacted Areas
Selected example

 Climate Hazard Modelling 22
Areas of significant flood events - NUTS3
 �

 ln = ln + γ + μ
 1 − �
 1 −

 γ = 0.253 γ = 0.238
 γ = 0.259

 γ = 0.635 γ = 0.697 γ = 0.664

 Climate Hazard Modelling 23
NUTS3 Estimated PD range
 NUTS3 affected by Event 4111:
 PD Min. 1st Qu. Median Mean 3rd Qu. Max.

 Standard 0.0004% 0.026% 0.046% 0.073% 0.081% 8.068%

 Climate 0.0005% 0.033% 0.058% 0.093% 0.102% 10.022%

 NUTS3 affected by Event 4319:
 PD Min. 1st Qu. Median Mean 3rd Qu. Max.

 Standard 0.0001% 0.0075% 0.0125% 0.0164% 0.0205% 0.6301%

 Climate 0.0002% 0.0150% 0.0252% 0.0329% 0.0412% 1.2572%

 NUTS3 affected by Event 4563:
 PD Min. 1st Qu. Median Mean 3rd Qu. Max.

 Standard 0.0003% 0.0145% 0.0253% 0.0314% 0.0414% 1.7183%

 Climate 0.0006% 0.0281% 0.0491% 0.0610% 0.0805% 3.2863%

 Climate Hazard Modelling 24
Areas of significant flood events – NUTS1
 �

 ln = ln + γ + μ
 1 − �
 1 −

 γ = 0.306 γ = 0.245 γ = 0.282 γ = 0.412

 γ = 0.427 γ = 0.365 γ = 0.249 γ = 0.249

 Climate Hazard Modelling 25
NUTS1 Estimated PD range

 NUTS3 affected by Event 4111:
 PD Min. 1st Qu. Median Mean 3rd Qu. Max.

 Standard 0.0004% 0.026% 0.046% 0.073% 0.081% 8.068%

 Climate 0.0005% 0.033% 0.058% 0.093% 0.103% 10.085%

 NUTS3 affected by Event 4319:
 PD Min. 1st Qu. Median Mean 3rd Qu. Max.

 Standard 0.0001% 0.0075% 0.0125% 0.0164% 0.0205% 0.6301%

 Climate 0.0005% 0.028% 0.048% 0.062% 0.078% 2.477%

 Climate Hazard Modelling 26
4
 Constructing score-
 adjusted climate change
 scenarios and climate-
 adjusted credit risk metrics
Polling Question
4. For a particular region – say, Greater London – what do you
think is the largest absolute difference between the smallest and
largest decline in HPI?
 A. Less or equal 10%
 B. Greater than 10% but less or equal 20%
 C. Greater than 20%

 Climate Hazard Modelling 28
Linking Severity of Climate Events to Credit Risk
Impact of flooding in HPI
1. Analyse 70+ flooding events in the UK.
2. Classify the events based on severity.
3. Analyse the impact on HPI after the event is observed by severity buckets.

 Fixed effect model
 = + + + +
 where
 : HPI for LAU i at time t,
 : Time effect (year−quarter dummy),
 : Region fixed effect,
 : Time-varying flood event effect,
 : flooded LAU (dummy)

 Climate Hazard Modelling 29
Impact of Flooding in Location-specific HPI
 HPI forecast before a flood event
 10.00%
 Baseline Early Policy
 8.00%
 6.00%
 4.00%

 YoY
 2.00%
 0.00%
 -2.00%
 -4.00%
 -6.00%

 2020Q1
 2020Q3
 2021Q1
 2021Q3
 2022Q1
 2022Q3
 2023Q1
 2023Q3
 2024Q1
 2024Q3
 2025Q1
 2025Q3
 2026Q1
 2026Q3
 2027Q1
 2027Q3
 2028Q1
 2028Q3
 2029Q1
 2029Q3
 2030Q1
 2030Q3
 2031Q1
 2031Q3
 2032Q1
 2032Q3
 2033Q1
 2033Q3
 If a flood event is
 predicted to occur in
 HPI forecast after the flood event, Baseline scenario 2021Q4 HPI forecast after the flood event, Early Policy scenario
 8.00%
 8.00%
 6.00%
 6.00%
 4.00%
 4.00%
 2.00%
 2.00%
 0.00%
 0.00%

 YoY
 -2.00%
YoY

 -2.00%
 -4.00%
 -4.00%
 -6.00%
 -6.00%
 -8.00%
 -8.00%
 -10.00%
 -10.00%
 -12.00%
 -12.00%
 0 1 2 3 4 5 6 7 8 9 10 11 12 13 14 15 16
 0 1 2 3 4 5 6 7 8 9 10 11 12 13 14 15 16
 Quarters after the event
 Quarters after the event
 Climate Hazard Modelling 30
Impact of Flooding Events in LGD
Location-specific LGD
 Climate-Adjusted LGD by Severity of Flood Event, peak value
 10.0

 Baseline Early Policy

 8.0

 6.0
%

 4.0

 2.0

 0.0
 Severity 1 Severity 2 Severity 3 Severity 4 Severity 5 Severity 6 Severity 7
 Less severe More severe
 Climate Hazard Modelling 31
5 Climate Risk Adjustment
Location-Specific Climate Risk
Modelling Methodology
 Climate Risk Scores
 Obtain climate risk scores at the facility level. Access to
 six climate event risk scores based on the geographic
 location provided.

 Climate Scenarios
 Build country-specific climate scenarios (e.g., NGFS
 Current Policy, NGFS Early Policy, NGFS Late
 Policy).

 Modelling Score-Adjusted Scenario
 Steps Compute climate event risk adjustments to the
 economy based on the climate risk scores and
 location such that riskier areas face more severe
 scenarios.

 Climate-Adjusted Credit Risk Metrics
 Forecast credit risk metrics (PDs, LGDs, EADs) based on score-adjusted
 climate scenarios.

 Climate Hazard Modelling 33
Q&A
Additional questions? Email us at help@economy.com

Additional Analysis, Whitepapers, Case Studies and Solution Information:
www.economy.com/products/consumer-credit-analytics/portfolio-analyzer

 Climate Hazard Modelling 34
moodys.com
This publication does not announce a credit rating action. For any credit ratings referenced in this publication, please see the ratings tab on the issuer/entity page on www.moodys.com for the most updated credit rating action information and rating history.

© 2021 Moody’s Corporation, Moody’s Investors Service, Inc., Moody’s Analytics, Inc. and/or their licensors and affiliates (collectively, “MOODY’S”). All To the extent permitted by law, MOODY’S and its directors, officers, employees, agents, representatives, licensors and suppliers disclaim liability for any
rights reserved. direct or compensatory losses or damages caused to any person or entity, including but not limited to by any negligence (but excluding fraud, willful
 misconduct or any other type of liability that, for the avoidance of doubt, by law cannot be excluded) on the part of, or any contingency within or beyond the
CREDIT RATINGS ISSUED BY MOODY'S CREDIT RATINGS AFFILIATES ARE THEIR CURRENT OPINIONS OF THE RELATIVE FUTURE CREDIT control of, MOODY’S or any of its directors, officers, employees, agents, representatives, licensors or suppliers, arising from or in connection with the
RISK OF ENTITIES, CREDIT COMMITMENTS, OR DEBT OR DEBT-LIKE SECURITIES, AND MATERIALS, PRODUCTS, SERVICES AND information contained herein or the use of or inability to use any such information.
INFORMATION PUBLISHED BY MOODY’S (COLLECTIVELY, “PUBLICATIONS”) MAY INCLUDE SUCH CURRENT OPINIONS. MOODY’S DEFINES
CREDIT RISK AS THE RISK THAT AN ENTITY MAY NOT MEET ITS CONTRACTUAL FINANCIAL OBLIGATIONS AS THEY COME DUE AND ANY NO WARRANTY, EXPRESS OR IMPLIED, AS TO THE ACCURACY, TIMELINESS, COMPLETENESS, MERCHANTABILITY OR FITNESS FOR ANY
ESTIMATED FINANCIAL LOSS IN THE EVENT OF DEFAULT OR IMPAIRMENT. SEE APPLICABLE MOODY’S RATING SYMBOLS AND PARTICULAR PURPOSE OF ANY CREDIT RATING, ASSESSMENT, OTHER OPINION OR INFORMATION IS GIVEN OR MADE BY MOODY’S IN ANY
DEFINITIONS PUBLICATION FOR INFORMATION ON THE TYPES OF CONTRACTUAL FINANCIAL OBLIGATIONS ADDRESSED BY MOODY’S FORM OR MANNER WHATSOEVER.
CREDIT RATINGS. CREDIT RATINGS DO NOT ADDRESS ANY OTHER RISK, INCLUDING BUT NOT LIMITED TO: LIQUIDITY RISK, MARKET
VALUE RISK, OR PRICE VOLATILITY. CREDIT RATINGS, NON-CREDIT ASSESSMENTS (“ASSESSMENTS”), AND OTHER OPINIONS INCLUDED IN Moody’s Investors Service, Inc., a wholly-owned credit rating agency subsidiary of Moody’s Corporation (“MCO”), hereby discloses that most issuers of debt
MOODY’S PUBLICATIONS ARE NOT STATEMENTS OF CURRENT OR HISTORICAL FACT. MOODY’S PUBLICATIONS MAY ALSO INCLUDE securities (including corporate and municipal bonds, debentures, notes and commercial paper) and preferred stock rated by Moody’s Investors Service, Inc.
QUANTITATIVE MODEL-BASED ESTIMATES OF CREDIT RISK AND RELATED OPINIONS OR COMMENTARY PUBLISHED BY MOODY’S have, prior to assignment of any credit rating, agreed to pay to Moody’s Investors Service, Inc. for credit ratings opinions and services rendered by it fees
ANALYTICS, INC. AND/OR ITS AFFILIATES. MOODY’S CREDIT RATINGS, ASSESSMENTS, OTHER OPINIONS AND PUBLICATIONS DO NOT ranging from $1,000 to approximately $5,000,000. MCO and Moody’s Investors Service also maintain policies and procedures to address the independence
CONSTITUTE OR PROVIDE INVESTMENT OR FINANCIAL ADVICE, AND MOODY’S CREDIT RATINGS, ASSESSMENTS, OTHER OPINIONS AND of Moody’s Investors Service credit ratings and credit rating processes. Information regarding certain affiliations that may exist between directors of MCO
PUBLICATIONS ARE NOT AND DO NOT PROVIDE RECOMMENDATIONS TO PURCHASE, SELL, OR HOLD PARTICULAR SECURITIES. MOODY’S and rated entities, and between entities who hold credit ratings from Moody’s Investors Service and have also publicly reported to the SEC an ownership
CREDIT RATINGS, ASSESSMENTS, OTHER OPINIONS AND PUBLICATIONS DO NOT COMMENT ON THE SUITABILITY OF AN INVESTMENT FOR interest in MCO of more than 5%, is posted annually at www.moodys.com under the heading “Investor Relations — Corporate Governance — Director and
ANY PARTICULAR INVESTOR. MOODY’S ISSUES ITS CREDIT RATINGS, ASSESSMENTS AND OTHER OPINIONS AND PUBLISHES ITS Shareholder Affiliation Policy.”
PUBLICATIONS WITH THE EXPECTATION AND UNDERSTANDING THAT EACH INVESTOR WILL, WITH DUE CARE, MAKE ITS OWN STUDY AND
EVALUATION OF EACH SECURITY THAT IS UNDER CONSIDERATION FOR PURCHASE, HOLDING, OR SALE. Additional terms for Australia only: Any publication into Australia of this document is pursuant to the Australian Financial Services License of MOODY’S
 affiliate, Moody’s Investors Service Pty Limited ABN 61 003 399 657AFSL 336969 and/or Moody’s Analytics Australia Pty Ltd ABN 94 105 136 972 AFSL
MOODY’S CREDIT RATINGS, ASSESSMENTS, OTHER OPINIONS, AND PUBLICATIONS ARE NOT INTENDED FOR USE BY RETAIL INVESTORS 383569 (as applicable). This document is intended to be provided only to “wholesale clients” within the meaning of section 761G of the Corporations Act
AND IT WOULD BE RECKLESS AND INAPPROPRIATE FOR RETAIL INVESTORS TO USE MOODY’S CREDIT RATINGS, ASSESSMENTS, OTHER 2001. By continuing to access this document from within Australia, you represent to MOODY’S that you are, or are accessing the document as a
OPINIONS OR PUBLICATIONS WHEN MAKING AN INVESTMENT DECISION. IF IN DOUBT YOU SHOULD CONTACT YOUR FINANCIAL OR OTHER representative of, a “wholesale client” and that neither you nor the entity you represent will directly or indirectly disseminate this document or its contents to
PROFESSIONAL ADVISER. “retail clients” within the meaning of section 761G of the Corporations Act 2001. MOODY’S credit rating is an opinion as to the creditworthiness of a debt
 obligation of the issuer, not on the equity securities of the issuer or any form of security that is available to retail investors.
ALL INFORMATION CONTAINED HEREIN IS PROTECTED BY LAW, INCLUDING BUT NOT LIMITED TO, COPYRIGHT LAW, AND NONE OF SUCH
INFORMATION MAY BE COPIED OR OTHERWISE REPRODUCED, REPACKAGED, FURTHER TRANSMITTED, TRANSFERRED, DISSEMINATED, Additional terms for Japan only: Moody's Japan K.K. (“MJKK”) is a wholly-owned credit rating agency subsidiary of Moody's Group Japan G.K., which is
REDISTRIBUTED OR RESOLD, OR STORED FOR SUBSEQUENT USE FOR ANY SUCH PURPOSE, IN WHOLE OR IN PART, IN ANY FORM OR wholly-owned by Moody’s Overseas Holdings Inc., a wholly-owned subsidiary of MCO. Moody’s SF Japan K.K. (“MSFJ”) is a wholly-owned credit rating
MANNER OR BY ANY MEANS WHATSOEVER, BY ANY PERSON WITHOUT MOODY’S PRIOR WRITTEN CONSENT. agency subsidiary of MJKK. MSFJ is not a Nationally Recognized Statistical Rating Organization (“NRSRO”). Therefore, credit ratings assigned by MSFJ
 are Non-NRSRO Credit Ratings. Non-NRSRO Credit Ratings are assigned by an entity that is not a NRSRO and, consequently, the rated obligation will not
MOODY’S CREDIT RATINGS, ASSESSMENTS, OTHER OPINIONS AND PUBLICATIONS ARE NOT INTENDED FOR USE BY ANY PERSON AS A qualify for certain types of treatment under U.S. laws. MJKK and MSFJ are credit rating agencies registered with the Japan Financial Services Agency and
BENCHMARK AS THAT TERM IS DEFINED FOR REGULATORY PURPOSES AND MUST NOT BE USED IN ANY WAY THAT COULD RESULT IN THEM their registration numbers are FSA Commissioner (Ratings) No. 2 and 3 respectively.
BEING CONSIDERED A BENCHMARK.
 MJKK or MSFJ (as applicable) hereby disclose that most issuers of debt securities (including corporate and municipal bonds, debentures, notes and
All information contained herein is obtained by MOODY’S from sources believed by it to be accurate and reliable. Because of the possibility of human or commercial paper) and preferred stock rated by MJKK or MSFJ (as applicable) have, prior to assignment of any credit rating, agreed to pay to MJKK or
mechanical error as well as other factors, however, all information contained herein is provided “AS IS” without warranty of any kind. MOODY'S adopts all MSFJ (as applicable) for credit ratings opinions and services rendered by it fees ranging from JPY125,000 to approximately JPY550,000,000.
necessary measures so that the information it uses in assigning a credit rating is of sufficient quality and from sources MOODY'S considers to be reliable
including, when appropriate, independent third-party sources. However, MOODY’S is not an auditor and cannot in every instance independently verify or MJKK and MSFJ also maintain policies and procedures to address Japanese regulatory requirements.
validate information received in the rating process or in preparing its Publications.

To the extent permitted by law, MOODY’S and its directors, officers, employees, agents, representatives, licensors and suppliers disclaim liability to any
person or entity for any indirect, special, consequential, or incidental losses or damages whatsoever arising from or in connection with the information
contained herein or the use of or inability to use any such information, even if MOODY’S or any of its directors, officers, employees, agents, representatives,
licensors or suppliers is advised in advance of the possibility of such losses or damages, including but not limited to: (a) any loss of present or prospective
profits or (b) any loss or damage arising where the relevant financial instrument is not the subject of a particular credit rating assigned by MOODY’S.

 Climate Hazard Modelling 36
You can also read