Assessment of the impact of media coverage in coronavirus-related Google Trends: Infodemiology study - PRBB
←
→
Page content transcription
If your browser does not render page correctly, please read the page content below
JMIR Preprints                                                                                                  Sousa-Pinto et al

              Assessment of the impact of media coverage in
             coronavirus-related Google Trends: Infodemiology
                                   study

                Bernardo Sousa-Pinto, Aram Anto, Wienia Czarlewski, Josep M Anto, João
                                  Almeida Fonseca, Jean Bousquet

                                  Submitted to: Journal of Medical Internet Research
                                                  on: April 24, 2020

        Disclaimer: © The authors. All rights reserved. This is a privileged document currently under peer-review/community
        review. Authors have provided JMIR Publications with an exclusive license to publish this preprint on it's website for
        review purposes only. While the final peer-reviewed paper may be licensed under a CC BY license on publication, at this
        stage authors and publisher expressively prohibit redistribution of this draft paper other than for review purposes.

https://preprints.jmir.org/preprint/19611                                                 [unpublished, non-peer-reviewed preprint]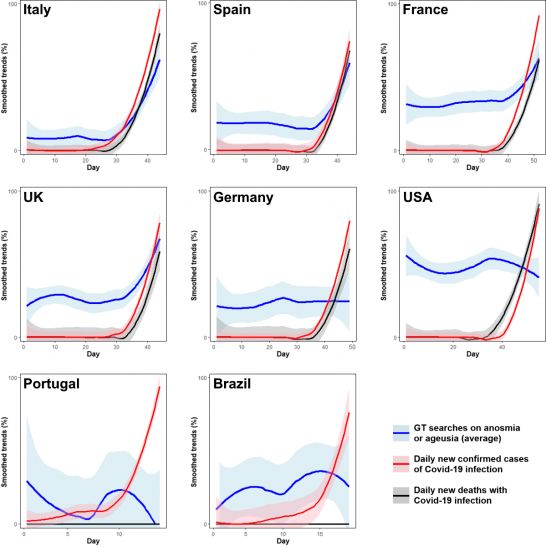
JMIR Preprints                                                                                                                                                                 Sousa-Pinto et al

Table of Contents

Original Manuscript....................................................................................................................................................................... 4
Supplementary Files..................................................................................................................................................................... 14
  Figures ......................................................................................................................................................................................... 15
     Figure 1...................................................................................................................................................................................... 16
     Figure 2...................................................................................................................................................................................... 17
     Figure 3...................................................................................................................................................................................... 18
     Figure 4...................................................................................................................................................................................... 19

https://preprints.jmir.org/preprint/19611                                                                                                     [unpublished, non-peer-reviewed preprint]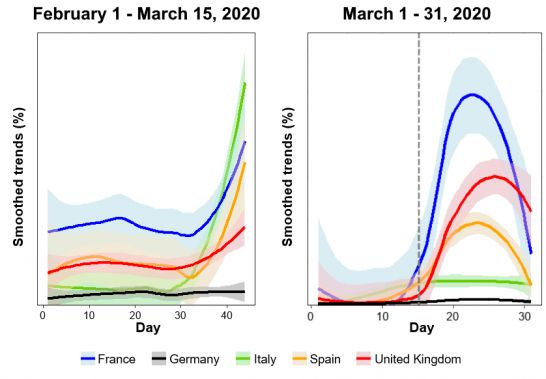
JMIR Preprints                                                                                                        Sousa-Pinto et al

Assessment of the impact of media coverage in coronavirus-related Google
Trends: Infodemiology study

Bernardo Sousa-PintoMD, PhD, ; Aram Anto; Wienia Czarlewski; Josep M Anto; João Almeida Fonseca; Jean
Bousquet

Corresponding Author:
Bernardo Sousa-PintoMD, PhD,
Phone: +351912362153
Email: bernardosousapinto@protonmail.com

Abstract

Background: The influence of media coverage in online searches may hamper the role of Google Trends (GT) for Covid-19
monitoring.
Objective: To assess whether Covid-19-related GT – particularly on ageusia and anosmia – were primarily related to media
coverage or with epidemic trends.
Methods: We retrieved GT data for searches on “coronavirus”, “cough”, “anosmia” and “ageusia”, plotting them for a period of
5 years. In addition, we analysed the trends of those queries for 17 countries throughout the year of 2020, particularly concerning
rises and peaks of searches. For anosmia and ageusia, we assessed whether the respective GT correlated with Covid-19 infections
and deaths both throughout 2020 and specifically before March 16, 2020 (i.e., the date when the media started reporting that
those symptoms could be associated with Covid-19).
Results: Over the last five years, peaks of “coronavirus” GT were only observed during the Winter of 2020. Rises and peaks in
“coronavirus” searches were similar in time in the 17 different assessed countries, irrespectively of their epidemic situation. In
15 of these countries, rises in “anosmia” and “ageusia” GT occurred in the same week or one week after they were identified in
the media as symptoms of Covid-19. Analysing data prior to March 16, 2020, anosmia/ageusia GT were found to have variable
correlation with Covid-19 infections and deaths in the different countries.
Conclusions: Covid-19-related GT is more related to media coverage than with epidemic trends.
(JMIR Preprints 24/04/2020:19611)
DOI: https://doi.org/10.2196/preprints.19611

Preprint Settings
1) Would you like to publish your submitted manuscript as preprint?
    Please make my preprint PDF available to anyone at any time (recommended).
    Please make my preprint PDF available only to logged-in users; I understand that my title and abstract will remain visible to all users.
    Only make the preprint title and abstract visible.
    No, I do not wish to publish my submitted manuscript as a preprint.
2) If accepted for publication in a JMIR journal, would you like the PDF to be visible to the public?
    Yes, please make my accepted manuscript PDF available to anyone at any time (Recommended).
    Yes, but please make my accepted manuscript PDF available only to logged-in users; I understand that the title and abstract will remain v
    Yes, but only make the title and abstract visible (see Important note, above). I understand that if I later pay to participate in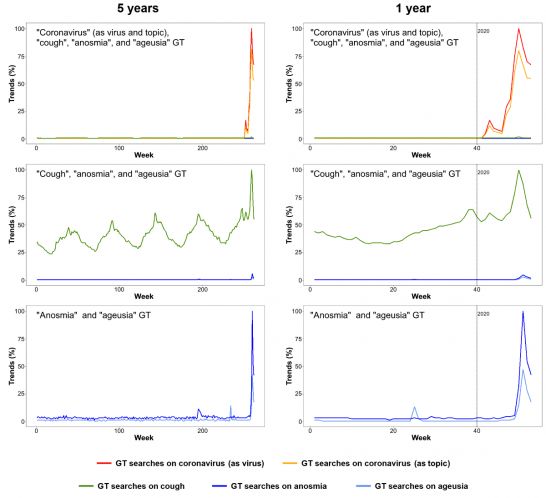
JMIR Preprints                                                                          Sousa-Pinto et al

                                            Original Manuscript

https://preprints.jmir.org/preprint/19611                         [unpublished, non-peer-reviewed preprint]
JMIR Preprints Sousa-Pinto et al
Assessment of the impact of media coverage in coronavirus-
related Google Trends: Infodemiology study
Bernardo Sousa-Pinto1,2, Aram Anto3, Wienia Czarlewski3,4, Josep M Anto5-7, Joao Almeida
Fonseca1,2, Jean Bousquet8,9
1
MEDCIDS – Department of Community Medicine, Information and Health Decision Sciences,
Faculty of Medicine, University of Porto, Porto, Portugal
2
CINTESIS – Center for Health Technology and Services Research, University of Porto, Porto,
Portugal
3
MASK-air, Montpellier France.
4
Medical Consulting Czarlewski, Levallois
5
ISGlobAL, Centre for Research in Environmental Epidemiology (CREAL), Barcelona, Spain.
6
Universitat Pompeu Fabra (UPF), Barcelona, Spain.
7
CIBER Epidemiología y Salud Pública (CIBERESP), Barcelona, Spain.
8
Charité. Charité, Universitätsmedizin Berlin, Humboldt-Universität zu Berlin, and Berlin
Institute of Health, Comprehensive Allergy Center, Department of Dermatology and Allergy,
Berlin, Germany.
9
MACVIA-France, Montpellier, France.
Abstract
Background: The influence of media coverage in online searches may hamper the role of Google
Trends (GT) for Covid-19 monitoring.
Objective: To assess whether Covid-19-related GT – particularly on ageusia and anosmia – were
primarily related to media coverage or with epidemic trends.
Methods: We retrieved GT data for searches on “coronavirus”, “cough”, “anosmia” and “ageusia”,
plotting them for a period of 5 years. In addition, we analysed the trends of those queries for 17
countries throughout the year of 2020, particularly concerning rises and peaks of searches. For
anosmia and ageusia, we assessed whether the respective GT correlated with Covid-19 cases and
deaths both throughout 2020 and specifically before March 16, 2020 (i.e., the date when the media
started reporting that those symptoms could be associated with Covid-19).
Results: Over the last five years, peaks of “coronavirus” GT were only observed during the Winter
of 2020. Rises and peaks in “coronavirus” searches were similar in time in the 17 different assessed
countries, irrespectively of their epidemic situation. In 15 of these countries, rises in “anosmia” and
“ageusia” GT occurred in the same week or one week after they were identified in the media as
symptoms of Covid-19. Analysing data prior to March 16, 2020, anosmia/ageusia GT were found to
have variable correlation with Covid-19 cases and deaths in the different countries.
Conclusions: Covid-19-related GT is more related to media coverage than with epidemic trends.
Keywords: Covid-19; Google Trends; Media coverage
Introduction
Infodemiology is defined as “the science of distribution and determinants of information in an
electronic medium, specifically the Internet, or in a population, with the ultimate aim to inform
public health and public policy” [1,2]. Such field comprises both “supply-based” and “demand-
based” infodemiology, with the latter assessing individuals’ health seeking behaviour (e.g., through
online searches) [2]. Over the years, infodemiological studies have become increasingly popular,
https://preprints.jmir.org/preprint/19611 [unpublished, non-peer-reviewed preprint]JMIR Preprints Sousa-Pinto et al
focusing on such different fields as chronic diseases, risk behaviours, and infectious diseases [3,4].
Regarding the latter, the use of search query data to predict or monitor infectious outbreaks can be
traced to back to the 2002 Severe Acute Respiratory Syndrome epidemic [5]. Subsequent studies
have been conducted on influenza and other infectious diseases, with Google Trends (GTs) being one
of the most use data sources albeit with mixed results. In fact, despite the initial optimism of GT for
flu prediction [6] and despite their strong correlation with influenza-related emergency department
visits [7], the unsatisfactory performance of Google Flu Trends has led to its discontinuation [8].
In the context of the Covid-19 pandemic, there has been interest on GTs (or other data on online
activity), particularly concerning their potential role for defining the proper timing and location for
practicing appropriate risk communication strategies to the affected populations [9]. In Europe,
significant correlations were observed between Covid-19 cases and deaths and online interest on this
topic [10]. In addition, GTs were found to predict Covid-19 incidence in Iran [11]. By contrast, as the
number of Covid-19 cases increased, US population interest in telehealth and telemedicine did not
correlate with the proportion of hospitals providing telehealth services [12].
Two difficulties in using GTs for SARS-CoV-2 infection concern (i) an information demand that may
be disproportionate to the country epidemiologic situation on account of media coverage (as
described in other contexts [5]), and (ii) the low specificity of Covid-19 main symptoms. However,
regarding the latter, while, cough, fever and dyspnea can also occur in several other diseases, some
more specific manifestations have also been described. Two symptoms that appear to be more
specific include anosmia and ageusia [13]. Such was not widely known to the general public before
an interview of Hendrik Streeck to the Frankfurter Allgemeine Zeitung (FAZ) dated of March 16
[14], which was then cited by the media throughout the world. The identification of these more
specific symptoms raised interest on whether GTs for these manifestations could better correlate with
Covid-19 incidence/deaths than GT for less specific symptoms. While strong correlations between
searches for smell-related information and the number of Covid-19 cases and deaths have been
described in several countries [15], the role of media coverage in motivating smell-related searches
cannot be discarded.
Therefore, we aimed to assess whether “anosmia” and “ageusia” searches were primarily related to
media release or with Covid-19 epidemic trends.
Methods
This is a GT-based infodemiology study, complying with the methodological framework by
Mavragani and Ochoa [16].
Keyword selection
In this study, we retrieved GT data on the keywords “coronavirus” (as virus and search term),
“cough” (as topic), “anosmia” (as disease) and “ageusia” (as topic).
With the exception of “coronavirus”, no other non-topic/non-disease search terms were used. In fact,
we tested the search terms “loss of smell”, “hyposmia”, “olfaction”, “dysgeusia” and “loss of taste”
[8] using the translations of the terms in native languages (with double quotes used when searching
for more than one-word keyword) but these queries did not retrieve consistent or quality-sufficient
data.
Region and period selection
We always obtained country-level GT data (except for a worldwide analysis of the last five years).
We retrieved GT data for the following different time periods:
A time frame of the last five years (up to the week of April 5-11, 2020): This time frame
https://preprints.jmir.org/preprint/19611 [unpublished, non-peer-reviewed preprint]JMIR Preprints Sousa-Pinto et al
allowed us to assess worldwide search spikes on selected keywords on a long-term period.
A time frame comprising the year of 2020 (i.e., period ranging from the week of January 5-11
to the week of April 5-11, 2020): This time frame allowed us to identify the search trends on
selected keywords throughout the year of 2020, in 17 Western countries (those where
searches for “anosmia” were sufficient to perform an analysis). Such GT data was plotted
(without performing formal correlations) alongside data on Covid-19 cases in different
countries. Of note, for this time frame, we retrieved data starting in January 5 (and not on the
date that the first Covid-19 case was registered in each country), not only to allow between-
country comparison, but also because (i) in the Western world, news coverage on SARS-
CoV-2 infection started before the first confirmed cases were identified, and (ii) it is possible
that there have been Covid-19 cases in the West prior to the first identified cases (and that
could have reflected on symptom web searches).
A time frame ranging from the date of the first confirmed Covid-19 case in each country until
March 15: This time frame allowed a closer analysis of search trends before the media started
reporting that anosmia and ageusia could be symptoms of Covid-19. To assess the impact of
such media coverage, we analyzed eight different countries, and correlated web searches with
the respective data on Covid-19 cases for that period. Correlations with the daily number of
deaths were also performed (in this case, using a time frame ranging from the date of the first
death in each country until March 15).
Search categories
Categories and subcategories were not selected when searching for keywords.
Data analysis
After plotting worldwide GT data on selected keywords for the last 5 years, we retrieved GT for the
year of 2020, assessing the trends of those queries in 17 countries where searches for anosmia were
sufficient to perform an analysis.
To further assess the impact of media coverage on Covid-19-related GT, and in order to assess
whether GT correlated with Covid-19 cases, we focused on eight countries in different stages of
Covid-19 pandemic – France, Germany, Italy, Portugal, Spain, United Kingdom (UK), Brazil, and
United States of America (USA). For each country, we plotted the weekly GT data on selected
keywords, together with weekly data on new Covid-19 cases (numbers retrieved from official
sources).
Subsequently, we performed an analysis restricted to the time period prior to March 16, the date that
the media started reporting that anosmia/ageusia could be symptoms of Covid-19. In fact, from that
date onwards, GT data could largely reflect interest in media coverage, rather than searches for
symptoms that patients have. Therefore, for each country, and between the date of the first confirmed
Covid-19 case and March 15, we assessed the correlation (by means of Pearson correlation
coefficients – r) between the daily average of GT on “anosmia” and “ageusia” (herein, reported as
“anosmia”/“ageusia”), and daily data on new Covid-19 cases. Similar analyses were performed for
new Covid-19 deaths (with the time frame being that between the date of the first Covid-19 death
and March 15).
In order to facilitate plot reading, we plotted normalized weekly data on Covid-19 cases and deaths.
That is, we plotted the total number of new Covid-19 cases and deaths as percentages of the
respective maximum weekly values observed during the defined time period.
Results
On a worldwide scale, GTs of different countries were similar in time, with peaks for “coronavirus”
being higher than for other searches (Figure 1). Throughout five years, such peaks were only found
in the winter of 2020. Queries for “coronavirus” as a virus and as a search term peaked at the same
https://preprints.jmir.org/preprint/19611 [unpublished, non-peer-reviewed preprint]JMIR Preprints Sousa-Pinto et al
time. The second highest peaks were for “cough” with two peaks coinciding with those of
“coronavirus”. “Anosmia” and “ageusia” had a slightly delayed identical peak that was not identified
when “cough” or “coronavirus” terms were searched.
We analysed search trends in 17 countries where the “anosmia” peak was clearly identifiable (in two
of these countries, “ageusia” did not show any peak, and in other two no peak was observed for
“cough”). In particular, we started by observing the week when searches for each topic started to rise
(Table 1). The first rise in “coronavirus” searches started by late January, 2020, while the second
peak of “coronavirus” started February 16-22 in one country (Italy), and by February 23-29 in the
remaining countries. “Cough” queries started in the same week in 3 countries, one week later in 4,
two weeks later in 2, and later in 6 countries.
Table 1. Week of onset Google Trends (GT) peaks in 17 countries
Country GT on “coronavirus” (as GT on GT on GT on
virus) “anosmia” “ageusia” “cough”
Peak 1a Peak 2a (as disease) (as topic) (as topic)
Argentina 19-25 Jan 23-29 Feb 22-28 Marb 8-14- Mar
Australia 19-25 Jan 23-29 Feb 22-28 Marc 15-21 Marc 16-22 Feb
Belgium 19-25 Jan 23-29 Feb 15-21 Marc 15-21 Marc 16-22 Feb
Brazil 19-25 Jan 23-29 Feb 15-21 Marc 15-21 Marc 16-22 Feb
c
Canada 19-25 Jan 23-29 Feb 15-21 Mar 22-28 Marc 8-14 Mar
Chile 19-25 Jan 23-29 Feb 22-28 Marb 22-28 Marb 23-29 Feb
France 19-25 Jan 23-29 Feb 15-21 Marc 15-21 Marc 1-7 Mar
c
Germany 19-25 Jan 23-29 Feb 15-21 Mar 15-21 Marc 23-29 Feb
Italy 19-25 Jan 16-22 Feb 1-7 Marc 8-14 Marc 23-29 Feb
c c
Portugal 19-25 Jan 23-29 Feb 15-21 Mar 15-21 Mar 8-14 Mar
c
Russia 19-25 Jan 23-29 Feb 22-28 Mar
Spain 19-25 Jan 23-29 Feb 15-21 Marc 8-14 Marc 8-14 Mar
c c
Sweden 19-25 Jan 23-29 Feb 15-21 Mar 22-28 Mar
c
Switzerland 19-25 Jan 23-29 Feb 8-14 Mar 15-21 Marc 1-7 Mar
c
The Netherlands 19-25 Jan 23-29 Feb 15-21 Mar 22-28 Marc 23-29 Feb
UK 19-25 Jan 23-29 Feb 15-21 Marc 15-21 Marc 8-14 Mar
USA 19-25 Jan 23-29 Feb 22-28 Marc 15-21 Marc 8-14 Mar
Jan: January 2020; Feb: February 2020; Mar: March 2020; Apr: April 2020; UK: United Kingdom;
USA: United States of America.
a
There were consistently two GT peaks on “coronavirus” – “peak 1” was a minor peak by late
January, and “peak 2” was the largest GT peak.
b
GT peak at the week of 5-11 April. c GT peak at the week of 15-21 March.
We observed that the onset of “anosmia” queries occurred in March 15-21 in 10 countries
(corresponding to the week of Hendrik Streeck interview to the FAZ), and in March 22-28 in 5 other
countries (only in Italy and Switzerland they started before March 15-21). The weeks of onset for
“ageusia” and “anosmia” queries were the same in 7 of 15 countries. Regarding the GT peaks for
“anosmia” and “ageusia”, they were observed in March 22-28, 2020 for all countries except
Argentina and Chile (one week after the interview).
Subsequently, we analysed eight countries plotting the average GT on “anosmia” and “ageusia”
https://preprints.jmir.org/preprint/19611 [unpublished, non-peer-reviewed preprint]JMIR Preprints Sousa-Pinto et al
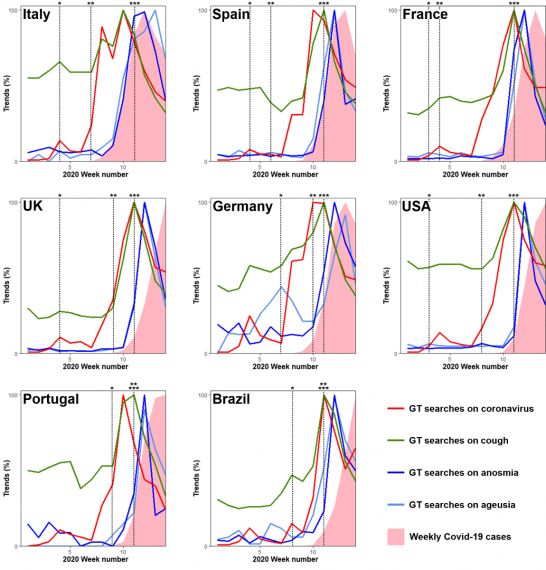
along with Covid-19 cases. We observed that the GT peak coincided with the maximum weekly
number of new Covid-19 cases in Italy, but not in the remaining countries (Figure 2). For all
countries (except Italy and Germany), GT peaks were followed by sharp decreases.
Analysing data between the first confirmed case of Covid-19 until March 16, we observed that, in
countries with higher Covid-19 infection or death rates, there were moderate-good correlations
between GT on “anosmia”/“ageusia” and Covid-19 new cases or deaths (Table 2 and Figure 3). By
contrast, poor correlations were observed in countries with lower Covid-19 rates by March 15. The
only exception was the United Kingdom, in which we observed strong correlations between GT
searches on anosmia/ageusia and new Covid-19 cases (r=0.739) and deaths (r=0.668), despite the
low Covid-19 infection and death rate (0.3 deaths per million inhabitants).
Table 2. Correlation coefficients between Google Trends (GT) on “anosmia”/“ageusia” and
frequency of Covid-19 new Covid-19 cases and deaths.
Country Covid-19 Covid-19 Correlations with Correlations with Correlations with
cases per deaths per average GT on GT on “anosmia” GT on “ageusia”
million million “anosmia” (as (as disease) (as topic)
inhabitants inhabitants disease) and
(March 15) (March 15) ageusia” (as topic)
Covid- Covid-19 Covid- Covid- Covid- Covid-
19 deaths 19 19 19 19
cases cases deaths cases deaths
Italy 411.1 30.0b 0.796a 0.776b 0.810a 0.855b 0.646a 0.621b
Spain 169.6 6.24 0.568a 0.755b 0.460a 0.531b 0.506a 0.632b
a b a b a
France 80.8 1.89 0.552 0.761 0.434 0.575 0.438 0.647b
UK 20.9 0.32 0.739a 0.668b 0.663a 0.745b 0.457a 0.500b
Germany 58.2 0.14 -0.005a - 0.104a - -0.099a -
a b a b
USA 10.6 0.19 -0.081 -0.141 0.015 -0.545 -0.115a 0.331b
Portugal 23.8 0 -0.312a - -0.229a - -0.182a -
Brazil 0.95 0 -0.014a - -0.031a - 0.003a -
UK: United Kingdom; USA: United States of America.
a
Analysis time frame: From the date of the first confirmed Covid-19 case in the respective country
and March 15. b Analysis time frame: From the date of the first confirmed Covid-19 death in the
respective country and March 15.
These results are supported by between-countries comparisons (Figure 4) – while prior to March 16,
Italy was the country with the largest volume of searches on “anosmia”/“ageusia”, it was surpassed
by France, the United Kingdom and Spain following extensive media coverage on those symptoms.
Discussion
Principal findings
The results of the present study suggest that Covid-19-related GT queries do not necessarily follow
the evolution of the epidemic and, in particular for anosmia and ageusia, are rather more closely
related to media coverage.
We carried out a stepwise approach and, based on the 1 and 5-year perspectives, and showed that
search peaks for “coronavirus”, but also for “anosmia”/“ageusia” are just found in 2020, and there
may be a relationship between the two peaks. This is different from “cough” whose searches are
detected for all years but with a peak coincident with the “coronavirus” peak.
https://preprints.jmir.org/preprint/19611 [unpublished, non-peer-reviewed preprint]JMIR Preprints Sousa-Pinto et al
We then assessed countries with an identifiable “anosmia” peak in 2020 in the Northern and
Southern Hemispheres. Surprisingly, in all places, peaks for “coronavirus”, “cough” or
“anosmia/ageusia” all occurred simultaneously, irrespectively of the pandemic stage. The simple
interpretation is that this is unlikely to be associated to Covid-19 incidence. However, the time of
onset differed for “coronavirus” or “cough” versus “anosmia” or “ageusia”, with the latter coinciding
with the timing that media news covered the information on these symptoms (Table 3).
Table 3. Media coverage on the identification of “anosmia” and “ageusia” as Covid-19 symptoms
Language Date Title of index Source URL
media news
German
(first
article)
16/03/2020 Virologe Hendrik Frankfurt https://www.faz.net/aktuell/
Streeck : "Wir Allgemein gesellschaft/gesundheit/
haben neue e Zeitung coronavirus/neue-corona-
Symptome symptome-entdeckt-virologe-
entdeckt" hendrik-streeck-zum-virus-
16681450.html
Italian
17/03/2020 Coronavirus, tra i Corriere https://www.corriere.it/salute/
sintomi frequenti de la Serra malattie_infettive/20_marzo_17/
la perdita totale di coronavirus-sintomi-frequenti-
gusto e olfatto perdita-gusto-olfatto-6d3b0932-
6836-11ea-9725-
c592292e4a85.shtml
English
17/03/2020 Coronavirus Daily https://www.express.co.uk/news/
symptoms shock: Express world/1256433/coronavirus-
Scientists discover (UK) symptoms-latest-uk-covid-19-
NEW symptoms coronavirus-taste-smell
including lack of
taste
17/03/2020 Coronavirus is Science https://www.express.co.uk/news/
most contagious News world/1256433/coronavirus-
before and during (USA) symptoms-latest-uk-covid-19-
the first week of coronavirus-taste-smell
symptoms
French
17/03/2020 Coronavirus : toux, Le https://www.sciencenews.org/
fièvre, fatigue... Parisien article/coronavirus-most-
quels sont les contagious-before-during-first-
symptômes du week-symptoms
Covid-19 ?
Spanish
18/03/2020 El coronavirus ABC https://www.abc.es/sociedad/abci-
neutraliza los coronavirus-neutraliza-sentidos-
sentidos del olfato olfato-y-gusto-
https://preprints.jmir.org/preprint/19611 [unpublished, non-peer-reviewed preprint]JMIR Preprints Sousa-Pinto et al
y el gusto 202003180214_noticia.html
Portuguese
18/03/2020 Virologista alemão Sputinik https://br.sputniknews.com/
revela novos news ciencia_tecnologia/
sintomas do (Brazil) 2020031815343670-virologista-
coronavírus alemao-revela-novos-sintomas-
do-coronavirus/
We subsequently studied the peaks for “coronavirus”, “cough” or “anosmia”/“ageusia”. The peak of
“anosmia”/“ageusia” is delayed when compared to “cough”, a major symptom of Covid-19. It was
usually short (one week) confirming that most of the queries were driven by media coverage. Prior
studies have also pointed out that GTs are highly influenced by media [17, 18] – due to some media
coverage, aberrant ragweed pollen peaks were observed during the grass pollen season [19]. In fact,
one important limitation of demand-based infodemiological studies concerns the difficulty of
distinguishing the effects of a true biological epidemic from what generates interest or apprehension
in Internet users [2,5]. In that sense, complementing search data with click data has been suggested
as a possible solution to partly overcome this limitation [2].
The correlation between “anosmia”/“ageusia” and deaths or new cases of Covid-19 varied
substantially among countries. Depending on the country, there was a high correlation or no
correlation at all. Prior to March 16, in countries with higher Covid-19 infection or death rates, there
were moderate-good correlations between queries on “anosmia”/“ageusia” and Covid-19 new cases
or deaths. This suggests that, in the absence of substantial changes in media coverage, and in the
presence of a sufficiently high Covid-19 incidence, GT might mostly reflect searches for symptoms
patients have. Thus, the strong correlations found by Walker et al [15] may reflect the facts that (i)
they analysed GT on anosmia/ageusia only up until March 25, 2020 (i.e., until the week before
searches on anosmia/ageusia started to decrease); (ii) their analyses on the associations between
Covid-19 cases/deaths and pre-mediatic coverage of anosmia GT were restricted to three countries
(UK, Spain and Italy); and that (iii) such pre-mediatic coverage was considered by the authors to
have occurred until March 20, 2020 (i.e., searches between March 16-19 were misclassified as they
had already occurred under potential influence of media coverage).
Limitations
Our study has some potentially relevant limitations. We used data at national levels, which may have
not captured within-countries heterogeneity on Covid-19 incidence or GT – different results could
have obtained if data were assessed at a more granulated level. Another relevant limitation concerns
the fact that, by March 16, the incidence of Covid-19 was still low in most Western countries – with
the exception of Italy and Spain, the remaining Western countries had less than 100 confirmed
Covid-19 cases per million inhabitants. The possibility of assessing a larger number of countries with
higher number of Covid-19 cases would have allowed us to more confidently assess “anosmia” and
“ageusia” search patterns (and their association with Covid-19 epidemiology) before and after media
coverage on those symptoms.
Another important GT limitation concerns the representativeness of Internet users [20] – Internet use
is lowest among the elderly, who constitute the age group with the highest Covid-19 morbidity.
Finally, GT is provided in relative rather than absolute numbers, which may limit across-countries
comparisons. However, as expected, similar correlation coefficients are obtained when comparing
GT with relative or absolute numbers of Covid-19 cases/deaths.
Conclusions
In conclusion, at least in the initial stages of SARS-CoV-2 pandemic, Covid-19-related web searches
https://preprints.jmir.org/preprint/19611 [unpublished, non-peer-reviewed preprint]JMIR Preprints Sousa-Pinto et al
may more closely reflect media coverage (and subsequent users’ interest or apprehension) than
epidemiological trends. The use of GTs has increased dramatically in the last decade, and, whereas in
the past the focus had been on surveillance and monitoring, the focus of research has now shifted to
forecasting changes [21]. It seems important to link GTs with other source of data to overcome the
limitations of using only search information.
Conflicts of Interest
None declared
Abbreviations
FAZ: Frankfurter Allgemeine Zeitung; GT: Google Trends
References
1. Eysenbach G. Infodemiology: the epidemiology of (mis)information. Am J Med;
2002;13(9):763-765.
2. Eysenbach G. Infodemiology and infoveillance: framework for an emerging set of public
health informatics methods to analyze search, communication and publication behavior on
the Internet. J Med Internet Res; 2009;11(1):e11.
3. Bernardo TM, Rajic A, Young I, Robiadek K, Pham MT, Funk JA. Scoping Review on
Search Queries and Social Media for Disease Surveillance: A Chronology of Innovation. J
Med Internet Res; 2013;15(7):e147.
4. Mavragani A. Infodemiology and Infoveillance: Scoping Review. J Med Internet Res;
2020;22(4):e16206.
5. Eysenbach G. SARS and Population Health Technology. J Med Internet Res; 2003; 5(2):e14.
6. Ginsberg J, Mohebbi MH, Patel RS, Brammer L, Smolinski MS, Brilliant L. Detecting
influenza epidemics using search engine query data. J Med Internet Res; 2009;457:1012-
1014.
7. Klembczyk JJ, Jalalpour M, Levin S, Washington RE, Pines JM, Rothman RE, et al. Google
Flu Trends Spatial Variability Validated Against Emergency Department Influenza-Related
Visits. J Med Internet Res; 2016;18(6):e175.
8. Butler D. When Google got flu wrong. Nature; 2013;494(7436):155-6.
9. Husnayain A, Fuad A, Su EC. Applications of google search trends for risk communication in
infectious disease management: A case study of Covid-19 outbreak in Taiwan. Int J Infect
Dis; 2020.
10. Mavragani A. Tracking Covid-19 in Europe: An Infodemiology Study. JMIR Public Health
Surveill; 2020.
11. Ayyoubzadeh SM, Ayyoubzadeh SM, Zahedi H, Ahmadi M, S RNK. Predicting Covid-19
incidence using Google Trends and data mining techniques: A pilot study in Iran. JMIR
Public Health Surveill; 2020.
12. Hong YR, Lawrence J, Williams D, Jr., Mainous Iii A. Population-Level Interest and
Telehealth Capacity of US Hospitals in Response to Covid-19: Cross-Sectional Analysis of
Google Search and National Hospital Survey Data. JMIR Public Health Surveill;
2020;6(2):e18961.
13. Lechien JR, Chiesa-Estomba CM, De Siati DR, Horoi M, Le Bon SD, Rodriguez A, et al.
Olfactory and gustatory dysfunctions as a clinical presentation of mild-to-moderate forms of
the coronavirus disease (Covid-19): a multicenter European study. Eur Arch
Otorhinolaryngol; 2020.
14. Schmitt P-P. „Wir haben neue Symptome entdeckt“. Frankfurter Allgemeine Zeitung. 2020
March 16, 2020.
https://preprints.jmir.org/preprint/19611 [unpublished, non-peer-reviewed preprint]JMIR Preprints Sousa-Pinto et al
15. Walker A, Hopkins C, Surda P. The use of google trends to investigate the loss of smell
related searches during Covid-19 outbreak. Int Forum Allergy Rhinol; 2020.
16. Mavragani A, Ochoa G. Google Trends in Infodemiology and Infoveillance: Methodology
Framework. JMIR Public Health Surveill; 2019;29(5):e13439.
17. Hamaoui-Laguel L, vautard R, Liu L, Solmon F, Viory N, Khvorostyanov D, et al. Effects of
climate change and seed dispersal on airborne ragweed pollen loads in Europe. Nat Clim
Change; 2015;5:766-71.
18. Pandey A, Abdullah K, Drazner MH. Impact of Vice President Cheney on public interest in
left ventricular assist devices and heart transplantation. Am J Cardiol; 2014;113(9):1529-31
19. Bousquet J, Agache I, Berger U, Bergmann KC, Besancenot JP, Bousquet PJ, et al.
Differences in Reporting the Ragweed Pollen Season Using Google Trends across 15
Countries. Int Arch Allergy Immunol; 2018;176(3-4):181-8.
20. Eysenbach G. Infodemiology and Infoveillance Tracking Online Health Information and
Cyberbehavior for Public Health. Am J Prev Med. 2011;40(5 S2):S154-158.
21. Jun S, Yoo H, Choi S. Ten years of research change using Google Trends: From the
perspective of big data utilizations and applications. Technol Forecast Social Change.
2018;130:69-87.
https://preprints.jmir.org/preprint/19611 [unpublished, non-peer-reviewed preprint]JMIR Preprints Sousa-Pinto et al
Supplementary Files
https://preprints.jmir.org/preprint/19611 [unpublished, non-peer-reviewed preprint]JMIR Preprints Sousa-Pinto et al
Figures
https://preprints.jmir.org/preprint/19611 [unpublished, non-peer-reviewed preprint]JMIR Preprints Sousa-Pinto et al Global Google Trends (GT) on "coronavirus", "cough", "anosmia", and "ageusia". Data are presented as a percentage of the maximum value and on a weekly basis, for a period of 5 years and 1 year up to the week of April 5-11, 2020. https://preprints.jmir.org/preprint/19611 [unpublished, non-peer-reviewed preprint]
JMIR Preprints                                                                                                 Sousa-Pinto et al

 Google Trends (GT) on "coronavirus", "cough", "anosmia" and "ageusia", and relative frequency of new Covid-19 infections.
 Data are presented as a percentage of the maximum value and on a weekly basis, from the week of January 5-11 to the week of
 April 5-11, 2020. * First confirmed case of Covid-19 case. ** First confirmed death due to Covid-19. *** Hendrik Streeck
 interview to the Frankfurter Allgemeine Zeitung, reporting that anosmia and ageusia could be Covid-19 symptoms.

https://preprints.jmir.org/preprint/19611                                                [unpublished, non-peer-reviewed preprint]
JMIR Preprints                                                                                                Sousa-Pinto et al

 Average of Google Trends (GT) on "anosmia" and "ageusia", and relative frequency of new Covid-19 infections and deaths.
 Data are presented as Loess-smoothed percentages of the maximum value (smoothed trends) and on a daily basis, from
 February 1 to March 15, 2020 (before the media publicized that anosmia and ageusia could be symptoms of Covid-19). Lines
 were smoothed to display trends more clearly.

https://preprints.jmir.org/preprint/19611                                               [unpublished, non-peer-reviewed preprint]
JMIR Preprints                                                                                                Sousa-Pinto et al

                                    Average of Google Trends (GT) on "anosmia" and "ageusia" before the media publicized that those could be symptoms of
                                    Covid-19 (February 1-March 15, 2020), and in the two weeks before and after such media release (marked with a grey dashed
                                    line) (March 1-31, 2020). Data are presented on a daily basis, as Loess-smoothed percentage of the maximum value and
                                    adjusted for the population.

                                   https://preprints.jmir.org/preprint/19611                                               [unpublished, non-peer-reviewed preprint]

Powered by TCPDF (www.tcpdf.org)
You can also read