A Study on Herd Behavior Using Sentiment Analysis in Online Social Network
←
→
Page content transcription
If your browser does not render page correctly, please read the page content below
A Study on Herd Behavior Using Sentiment
 Analysis in Online Social Network
 Suchandra Dutta1, Dhrubasish Sarkar2, Sohom Roy3, Dipak K. Kole4, Premananda Jana5
 1,2
 Amity Institute of Information Technology, Amity University Kolkata, India
 3
 IBM India Private Limited, Kolkata, India
 4
 Dept of CSE, Jalpaiguri Government Engineering College, Jalpaiguri, India
 5
 Netaji Subhas Open University, Kalyani, India
 Email: duttasuchandra214@gmail.com, 2dhrubasish@inbox.com, 3Sohom.1988@gmail.com,
 1

 4
 dipak.kole@cse.jgec.ac.in, 5prema_jana@yahoo.com

Abstract— Social media platforms are thriving nowadays, so a for political activities. The study of sentiment analysis
huge volume of data is produced. As it includes brief and clear is a subset of a process which is Natural Language
statements, millions of people post their thoughts on
 Processing (NLP) that focuses on determining the
microblogging sites every day. This paper represents and
analyze the capacity of diverse strategies to volumetric, delicate, polarity and subjectivity of textual data. Subjectivity
and social networks to predict critical opinions from online analysis of the textual data, which will allow to evaluate
social networking sites. In the exploration of certain searching the platform's efficacy in plotting tweet subjectivity for
for relevant, the thoughts of people play a crucial role. Social visualization on a chart. Analysis of position data
media becomes a good outlet since the last decades to share the polarity, measurement of site precision in plotting
opinions globally. Sentiment analysis as well as opinion mining
 mood, and views of Twitter users on a map. It is known
is a tool that is used to extract the opinions or thoughts of the
common public. An occurrence in one place, be it economic, that there are almost a million sites for microblogging.
political, or social, may trigger large-scale chain public reaction Microblogging websites are simply social media
across many other sites in an increasingly interconnected world. networks whereby users share short, frequent updates.
This study demonstrates the evaluation of sentiment analysis Users could read and write 148-character tweets on
techniques using social media contents and creating the Twitter, which is very popular microblogging
association between subjectivity with herd behavior and
clustering coefficient as well as tries to predict the election result
 platforms. Messages from Twitter are often referred to
(2021 election in West Bengal). This is an implementation of as Tweets. These tweets will be used as raw data.
sentiment analysis targeted at estimating the results of an
 Polarity and Subjectivity analysis:
upcoming election by assessing the public's opinion across social
media. This paper also has a short discussion section on the Subjectivity analysis of the text is part of the analysis of
usefulness of the idea in other fields. emotion, where analysts use Natural Language
 Processing (NLP) to classify a text as either self-centred
 Keywords— Sentiment Analysis, Herd behavior, Subjectivity, or not self-centred. Indicators of a subjective view are
Polarity, Social Network Analysis, Clustering Coefficient the inclusion of such words, such as adjectives, adverbs,
 and certain classes of verbs and nouns [2]. Therefore,
 I. INTRODUCTION
 subjectivity research categorizes sentences as either
In the current era, social networking sites are regularly personal beliefs or objective facts and then use
used to share perspectives or opinions on any product, subjectivity analysis to differentiate sentences that are
issue, case, or any breaking news from anywhere at any contextual and those that are objective for a group of
moment. Analysis of sentiment or opinion mining is an messaging in a survey [3]. Word characteristics are used
area that primarily revolves around the assessment of as a measure of a statement's subjectivity, such as the
certain views. use of adjectives and nouns [4]. For Natural Language
Online Social Network (OSN) represent a formed Processing (NLP), Python TextBlob has been used to
surrounding where users share emotions and opinions conduct a subjectivity analysis of the database. Python
daily. They have therefore become an important TextBlob is a popular open source NLP library for
requirement of sentiment/opinion-related Big Data. The evaluating text subjectivity. The subjectivity of each
purpose of Sentiment Analysis (SA) is to extract tweet was calculated using the TextBlob library, which
feelings or opinions from texts readily accessible by has a built-in model for calculating subjectivity. The
various data sources, such as OSNs [1]. A substantial subjectivity range runs from 0 to 1. A value close to 0
number of people have expanded the use of Twitter. In means that the value is an Objective text implies a
an extraordinary advancement in the production of user strongly biased text with a meaning like 1. Then the
derived content. In different fields of study, including decision was taken whether an expression is perceived
 by subjectivity analysis. Also proceeding with polarity
consumer opinion and behaviour analysis during
 analysis on the document to see whether it represents a
general elections, this data is now being studied.
 positive or pessimistic viewpoint. The aim of polarity
Researchers are now very much interested to get them analysis is to find the text author's emotional attitude
involved in the use of different social networking sites

978-1-6654-0295-8/21/$31.00 ©2021 IEEE
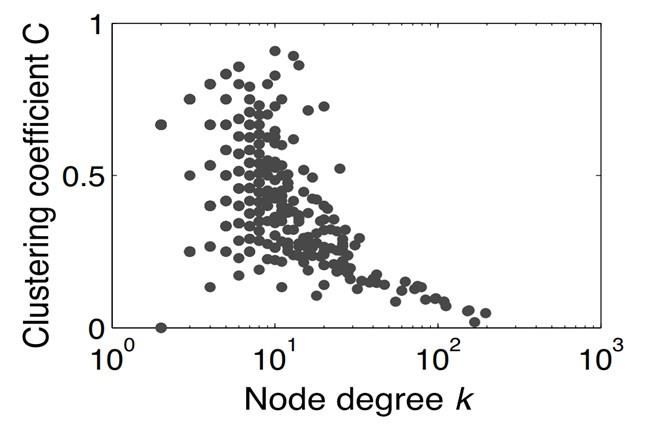
toward the topic at hand [3]. Twitter is becoming more coefficient, i.e., highly linked vertices selectively link
popular as a networking tool, there have also been to vertices that are not mutually linked, suggesting a
improved requirements in evaluating its data to assess
public sentiment or opinion on a subject or a prominent
individual[5]. Analysis of polarity helps to quantify
text sentiment, to obtain that perspective, the
requirement appears to identify the text as negative,
positive, or neutral. Several instruments are perfect for
small text sentiment analysis [6]. In the following work
to study the polarity on collected data, Python
TextBlob has been used for subjectivity/polarity
analysis. Inspection of polarity using Python TextBlob,
Dictionary terms for the negative and positive polarity,
ratings are assigned. These polarity ratings differ from
-1 to 1, where -1 is an incredibly negative sentiment,
and 1 is an incredibly positive sentiment. A 0-polarity
score shows a neutral sentiment.
 II. CLUSTERING COEFFICIENT
Clustering is essentially a clustering coefficient that
calculates the degree to which nodes appear to cluster
or join accurately. A cluster is a group of nodes that are
more connected to nodes in same group than to any
other nodes, and for multiple reasons, clusters may be
 Figure 1: Graph of clustering coefficient vs node degree
very important, because, for example, different clusters
can be a bottleneck for knowledge or a diffusion hierarchical structure. The clustering coefficient of
mechanism. A cluster (Eq. 1) will hold stuff in or keep each vertex versus degree (Fig-1). Does the out-
stuff out. degrees align the vertices with the in-degrees in
Mainly cluster is globally speaking is the proportion of
 of their neighbors? -The degrees should also be
the closed triads (i.e., A, B and C are interconnected
 substituted by their weighted equivalents in the case of
with each other) and summation of total closed triads weighted networks [7].
and open triads.
 III. HERD BEHAVIOUR
 ( )
Cluster = (
 )+( )
 ----------- (1) An occurrence in one place, be it economic, political,
 or social, will trigger largescale chain responses over
 many other locations in an increasingly interconnected
So, a network with high clustering has a higher
 world. Herd behavior is the behavior of people without
proportion of closed triads to all triads. The degree is
 overarching direction in a group working together.
the number of connections that any node has a degree
 Until relatively recent times, without much reciprocal
distribution refers to that distribution. Lowly linked
 contact, such massive phenomena were investigated
means the degree of a node is decreasing and highly
 quite sporadically in separate social science disciplines
linked determines the degree of a node is increasing.
 [8]. Yet, these mass anomalies have turned out to be a
The fundamental measure which accounts for a
 topic of significant multidisciplinary concerns with
network's inner structure is clustering coefficient. The
 developments in technologies and emerging scientific
clustering coefficient refers to a network's local
 contexts.
consistency and tests the possibility that two vertices
 Herding refers to an equilibrium of individuals'
are related to a mutual neighbor. In the case of
 thoughts or actions in a group. Most notably, such
undirected networks, there are: [ = ( −1)]/2]
 fusion mostly occurs from local connections between
potential edges between neighbors given the vertex individuals instead of by any deliberate arrangement by
with neighbors [8]. a central power or a leading community person. The
The clustering coefficient (Eq. 2) of the vertex is concepts of herd behavior and collective behavior in
then defined as the ratio between the neighbors of the their projected work for defining the behavior adoption
actual number of edges to the maximum number as on online social networks. Many researchers apply
 , transfer learning to the field of the sentiment analysis.
 =2Ei / ki(ki-1) ------------------ (2) The study of sufficient settings for click-and view-
 through desires offers a complex viewpoint on social
The coefficient of clustering is not a function of the media consumer activity and social impact, evaluating
vertex itself, but its neighbors. The mean cluster social relation power in a herd behavior context [9].
coefficient of all vertices is the global or mean
clustering coefficient =< > of the network [5].
Highly linked vertices show a low clustering
IV. RELATED WORK application of Natural Language Processing. From the
Sentiment analysis from user data is becoming like a processed data subjectivity and polarity has been
hot cake nowadays, as this information have several calculated. And finally, clustering coefficient applied
 to predict the result which will conclude the analysis.
implications in modern world [10]. Researchers already
 All the codes have been implemented using Python
started to analyze data from different community sites
 language and different Python libraries such as tweepy,
and Twitter is one of the areas where the researchers pandas, preprocessor, nltk etc have been used.
are showing more interests [11]. Product review is one The main focus of this paper is as follows: the
of the important aspects for sentiment analysis and this subjectivity lies between 0 to 1 and the polarity lies
will help the companies to make future marketing between -1 to +1, i.e. the more numbers (tends to 1) of
strategies [12]. As a subset of mining process which can subjectivity refers that mostly the tweets in public
be considered as opinion mining is the arear of interest opinion and the less number (tends to 0) of subjectivity
for the present day’s researchers [13]. Researchers are refers that the tweets are factual information similarly
processing Twitter data as part of Big data processing when the polarity tends to -1 that means the polarity is
[14]. Researchers also investigate and analyze the negative and when the polarity tends to 1 is meant to
effect of share price based on Twitter tweets as part of be the polarity is positive and if the polarity of tweets
Big data analysis [15]. is 0 that meant to be the polarity is neutral.
In this current paper, Twitter data will be used to So, if the clustering coefficient of a high number of
analyze and predict people’s view towards different subjectivities is high that means the most tweets are in
 the public opinion, most of the people following this
political groups, and it can predict the election result.
 and most of the public accompanied the tweets as well
And the analysis has been carried out based on current
 as the particular information, as because of the most of
political scenarios. This work will add a new the people are following and agree with the particular
proposition in the universe of sentiment analysis. information so in reference to the herd behavior, it
 conveys to an equilibrium of individuals' thoughts or
 V. PROPOSED MODEL
 actions in a group. Most notably, such fusion mostly
This paper explores how sentiment analysis methods occurs from local connections between individuals
were used to forecast the outcome of the West Bengal instead of by any deliberate arrangement by a central
election using social media content (Twitter). The power or a leading community person. So, it can be
searching hashtags are #BengalElection2021 and said that the tweets which have the high number of
#WestBengal. With the help python programming clustering coefficient of the high number of
language, Subjectivity and Polarity of the tweets can be subjectivities is followed the herd behavior. That
calculated, which can help this paper to conclude. means if the opinion, as well as the thoughts of a
The process and its components of the model can be greater number of people or group of people, is almost
explained using the below flow (Fig- 2). same then most of the people follow that opinion.
 Result for #BengalElection2021
 Data Extraction from Twitter based on
 hashtag or user

 Data pre-processing and transformations

 Find subjectivity and polarity from the
 processed data

 Apply clustering coefficient to predict
 results
 Figure 3- Subjectivity of tweets of #BengalElection2021

 Figure 2 - Process flow After fetching the tweets (134 number of tweets have
 been fetched) for #BengalElection2021 in the python
The process starts with the extraction of data from program, getting a 17.91 % of negative tweets and
Twitter and then collected records have been pre- 36.56% of positive tweets, and 45.52% of neutral
processed and transformed. This process is the direct tweets, and also detected that the subjectivity (Fig-3) of
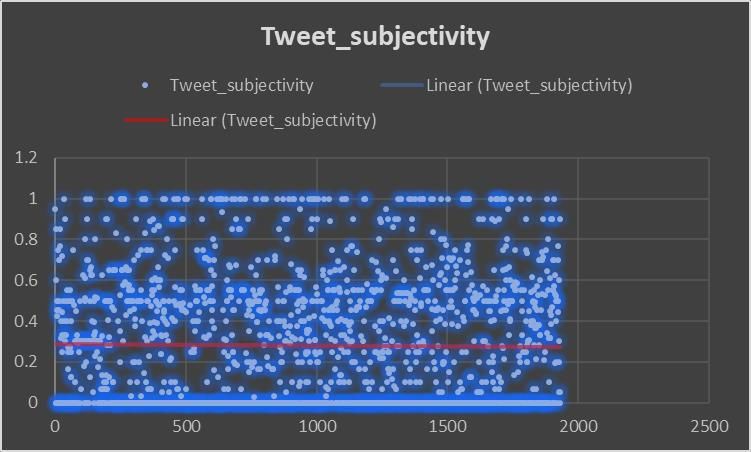
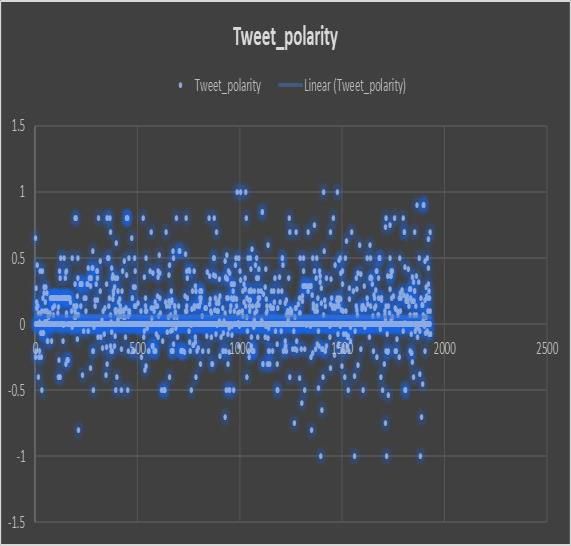
most of the tweets are having values between 0.5-0.8,
which indicate the tweets in people’s choice and not a
piece of factual statistics and the polarity (Fig-4) of the
most tweets having values between 0-1, that indicates
the most of the tweets are neutral and positive. As
because the clustering coefficient of the higher value of
subjectivity is more, so most of the people give the
similar kind of opinion and according to the herd
behaviour majority of the people follow that opinion.

 Figure 6: Subjectivity of tweets of #WestBengal

 Figure 4 - Polarity of tweets of tweets of #BengalElection2021

Result of #WestBengal
After fetching the thousands (fetched 1933 number of
tweets) of tweets for #WestBengal with the help of the
python program, getting a 13.53 % of negative tweets
 Figure 7 - Subjectivity and polarity both shown in one graph
and 38.18% of positive tweets, and 48.14% of neutral
 (#WestBengal)
tweets, and the polarity (Fig-5) of the most of tweets
range between 0-1 that indicates the most of neutral and A comparison between subjectivity and polarity (Fig-
positive tweets and observed that the subjectivity (Fig- 7), can be shown where subjectivity and Polarity both
6) of most of the tweets range between 0.5-0.8, which
 for the hashtag of west Bengal (#WestBengal) and they
indicate the tweets in public opinion and not factual
 are related to the 2500 tweets which have been
information. As because the clustering coefficient of a
higher value of subjectivity is more so most of the considered, depending on the extracted datasets.

 VI. RESULT ANALYSIS
 This survey represents the outcomes of analysing
 sentiments as well as the herd behaviour and clustering
 coefficient to predict election results of West Bengal
 (2021) through social media content (Twitter).
 Therefore, the sentiment of most of the tweets are
 neutral and positive and the less number of the tweets
 are negative, as well as some of the tweets have more
 number subjectivity which refers that mostly it in
 people’s choice and not a piece of factual information.
 So, the larger number of neutral tweets cannot conclude
 or predict any solution that which political party can win
 the 2021 election in West Bengal. Also, here the
 prediction can be done that the winning probability of
 party X is a bit higher than Y (Actual party names are
 kept hidden here and they are represented as X & Y).
 Since the higher value of subjectivity has a higher
 Figure 5: Polarity of the tweets of #WestBengal
 clustering coefficient, more people or users will follow
people give the similar kind of opinion and in term of this opinion according to the herd behaviour principle.
the herd behaviour, majority of the people follow that
opinion.
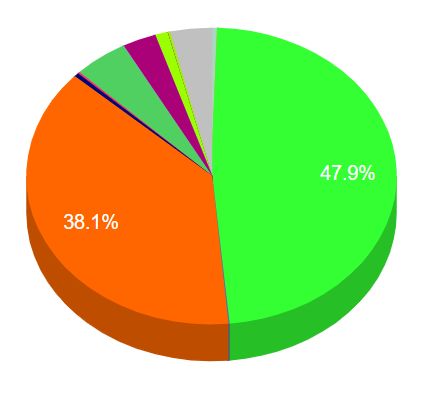
the current scenario it can be shown that wining party
 was able to go with the pulse of the people of West
 Bengal and they are able to understand the emotion of
 the people in West Bengal and the same has been
 reflected in different tweets. Not only this, there are few
 contents in multiple tweets which could influence the
 other people and they started to change their mind.
 These kinds of tweets created too many followers and
 resulted the herd behaviours where there are certain
 timestamps till when people follow or supported the
 tweets and when the followers would be publishing/post
 any tweets they would be highly influenced by the
 previously published tweets.. In different timestamps,
 herd behaviours can be adopted over the Social
 Networks [17]. So, the model is useful and can show a
 new way where online platforms especially social
 media will take a crucial role to analyse and predict
 election result.
Figure 8: Published Result of West Bengal Assembly Election 2021 Also, the major problem is the consistency of the
 election predicting model. The primary purpose of any
Now the actual result of West Bengal Assembly prediction method is a prediction with a high degree of
Election 2021 (Fig- 8) shows that party X has got 47.9% precision. Because the records collected in RAW format
of the total vote share and party Y has got the 38.1% of from multiple sources include errors that may lead to
the total vote share. And the model predicted the same erroneous predictions. More research is required to
where it claims that the probability of wining for party overcome the shortcomings of basic sentiment analysis
X is a bit higher than party Y [16]. The analysis has been systems, such as machine learning techniques.
carried out based on two different trending hashtags and
tweets have been extracted during first week of VII. USAGE IN OTHER SECTORS
February 2021. There are different phases of the The proposed model can be used in other sectors also;
experiment and all phases are essential to reach the herd behaviour analysis using Facebook posts [17],
result. The process, finding out the result involves the crime data analysis from victims viewpoint [18], public
process of ETL (Extract, Transform, Load) in the first reaction towards controlling obesity, Rational
phase, and in the final phase analysis related to the conformity and information cascades and decision
clustering coefficient applied on the cleansed and making for any product marketing etc.
transformed data. The ETL process has been
implemented using Python and the records which has VIII. CONCLUSION
been extracted – are the complete tweets along with the Predicting election result is a little bit tricky concept,
username, hashtag used, tweet time, number of and it has been tried earlier also by researchers and
followers, retweets etc. In the next phase RAW tweets different technics have been used. Those prediction
have been pre-processed and transformed so that token process involved - from manual process to complex
can formed for the further analysis. This step also takes mathematical models. Many aspects around the society
care of the language or simply it can be referred as the have changed because of technical advances, and
implication of Natural Language Processing. These will people will now predict, analyse, and measure an
transform the data/tweets in the form of tokens and extensive variation of critical and significant events.
different stop words, punctuation has been removed Due to the vast volume of data accessible from various
along with the process of lemmatization. In the final sources, complicated actions in a minimal timeframe.
phase clustering coefficient applied to predict the Sentiment analysis of people's views from Online
outcome on the cleansed and transformed dataset and Social Networks like Twitter has resulted in many
the result of this analysis has been compared and research conveniences. In this research paper, the
evaluated with the actual result which is the result of prediction of West Bengal election 2021 is given with
West Bengal Assembly Election 2021. The model the help of sentiment analysis and clustering coefficient,
shows a promising output when it is compared with the and herd behaviour model.
actual result of West Bengal Assembly Election 2021.
There are too many predictions from other sources who REFERENCES
claimed the completely opposite result of this model. 1. C. Zucco, B. Calabrese,G. Agapito, P. H. Guzzi, M. Cannataro,
But from twitter sentiment analysis perspective it can “Sentiment analysis for mining texts and social networks data:
show the support or emotion was higher with the party Methods and tools,” Wiley Periodicals,
X. Though the records have been extracted during first https://doi.org/10.1002/widm.1333 , Vol 10(3),pp. 1-42August
week of February 2021 and the election process took 2019
place in April 2021, and there could be several possible 2. A. Tumasjan,T. O. Sprenger, P. J. Sandner, I. M. Welpe,
 “Predicting elections with twitter: What 140 characters reveal
factors or incidents might happen in 2-3 months which about political sentiment,” ICWSM 10, 1, pp. 178–185., 2010
could change the election result completely. But from
3. U. Yaqub,N. Sharma, A. Pabrej, S. A. Chun,V. Atluri, J. Vaidya,
 “Analysis and Visualization of Subjectivity and Polarity of 12. X. Fang ,J. Zhan, “Sentiment analysis using product review
 Twitter Location Data,” Proceedings of the 19th Annual data. Journal of Big Data,” Journal of Big Data 2, 5 (2015).
 International Conference on Digital Goverenment Reasearch: https://doi.org/10.1186/s40537-015-0015-2
 Goverenance in the Data , A67 , pp. 1-10, May 2018 13. K. Norambuena, B. Lettura, E. Villegas, Claudio. “Sentiment
4. V. A. Kharde, Prof S. Sonawane, “Sentiment analysis of Twitter analysis and opinion mining applied to scientific paper reviews.
 data: A survey of techniques,” International Journal of Computer Intelligent Data Analysis,”. 23. 191-214. 10.3233/IDA-173807,
 Applications 139(11): pp.- 5-15,arXiv preprint arXiv:1601.06971 2019
 ,2016 14. B. Cornelia, P. Juergen ,”Content analysis of Twitter: Big data,
5. N. Li, D. D. Wu, “Using text mining and sentiment analysis for big studies,” In S. A. Eldridge II & B. Franklin, B. (Eds.), The
 online forums hotspot detection and forecast. Decision support Routledge Handbook to Developments in Digital Journalism
 systems,” elsevier ,48, 2, pp. 354–368., 2010 Studies. Abingdon: Routledge, 2018
6. B. O’Connor, R. Balasubramanyan, B. R. Routledge, N. A. 15. Wlodarczak. Peter, “Exploring the value of big data analysis of
 Smith, “From tweets to polls: Linking text sentiment to public Twitter tweets and share prices,” CSEIT1835125, 2018.
 opinion time series,” ICWSM 11, pp. 122-129 , 1–2.(2010) 16. https://results.eci.gov.in/Result2021/partywiseresult-
7. B. H. Junker, F. Schreiber, “Analysis of Biological Networks, ” S25.htm?st=S25 (Accessed on 05/04/2021 02:15 PM IST)
 (ISBN 978-0-470-04144-4) pp xv + 346. Hoboken: John Wiley 17. D.Sarkar, S. Roy, C. Giri, D. K. Kole, “A Statistical Model to
 & Sons, pp. 39, Inc. 2008. Determine the Behavior Adoption in Different Timestamps on
8. T. Kameda, K. Inukai,T. Wisdom,W. Toyokawa, “The Concept Online Social Network. International Journal of Knowledge and
 of Herd Behaviour: Its Psychological and Neural Systems,” IJKSS, 10(4), 1-17. doi:10.4018/IJKSS.2019100101
 Underpinnings,” IOSR, pp. 61-71, December 2014. ,2019
9. J. Mattke, C. Maier,L. Reis, T. Weitzel, “Herd behavior in social 18. S. Roy, S. Kundu, D. Sarkar, C. Giri., P. Jana: “Community
 media: The role of Facebook likes, strength of ties, and Detection and Design of Recommendation System Based on
 expertise,” European Journal of Information Systems, pp. 1-25 Criminal Incidents,” In Bhattacharjee D., Kole D.K., Dey N.,
 ,2020 Basu S., Plewczynski D. (eds) Proceedings of International
10. Alsaeedi, A. Khan, Mohammad, ”A Study on Sentiment Conference on Frontiers in Computing and Systems. Advances
 Analysis Techniques of Twitter Data. International Journal of in Intelligent Systems and Computing, vol 1255. 71 – 80.
 Advanced Computer Science and Applications,” 10. 361-374. Springer, Singapore. https://doi.org/10.1007/978-981-15-7834-
 10.14569/IJACSA.2019.0100248, 2019 2_7
11. P. Tyagi, R. C. Tripathi, “A Review towards the Sentiment
 Analysis Techniques for the Analysis of Twitter Data,”
 Proceedings of 2nd International Conference on Advanced
 Computing and Software Engineering (ICACSE) , Available
 SSRN: https://ssrn.com/abstract=3349569 or http://dx.doi.org/1
 0.2139/ssrn.3349569, February 8, 2019
You can also read