Land Use Detection & Identification using Geo-tagged Tweets - arXiv.org
←
→
Page content transcription
If your browser does not render page correctly, please read the page content below
Land Use Detection & Identification using
                                                                Geo-tagged Tweets
                                                                           Saeed Khan                                           Md Shahzamal
                                                                        School of ITEE                                    Department of Computing
                                                                    University of Queensland                                Macquarie University
                                                                      Brisbane, Australia                                    Sydney, Australia
                                                                       s.khan@uq.edu.au                                   md.shahzamal@mq.edu.au
arXiv:2101.03337v1 [math.NA] 9 Jan 2021

                                             Abstract—Geo-tagged tweets can potentially help with ‘sens-           As a result of using a large number of mobile devices,
                                          ing’ the interaction of people with their surrounding environ-        people leave behind digital footprints of their interaction with
                                          ment. Based on this hypothesis, this paper makes use of geo-          the environment. Availability of a vast number of mobile
                                          tagged tweets in order to ascertain various land uses with a
                                          broader goal to help with urban/city planning. The proposed           applications has turned the mobile devices into sensors of
                                          method utilises supervised learning to reveal spatial land use        human activity in space and time. This has led to the advent of
                                          within cities with the help of Twitter activity signatures. Specif-   new research areas such as smart cities and urban computing
                                          ically, the technique involves using tweets from three cities of      with a goal to understand the city dynamics through ubiquitous
                                          Australia namely Brisbane, Melbourne and Sydney. Analytical           data, and thus improving the quality of life. Data sources
                                          results are checked against the zoning data provided by respective
                                          city councils and a good match is observed between the predicted      such as GPS, Bluetooth, Wifi and cell phone records are
                                          land use and existing land zoning by the city councils. We show       becoming more and more useful for applications such as
                                          that geo-tagged tweets contain features that can be useful for        transport planning [2], traffic estimation [3] and social studies
                                          land use identification.                                              [4]. This paper suggests a method to use Twitter data to
                                                                                                                determine the type of land people tweet from by analysing
                                            Index Terms—land use, twitter, spatio-temporal, urban zoning
                                                                                                                the temporal patterns of their tweeting behaviour. The method
                                                                                                                is scalable and efficient compared to some other techniques
                                                                                                                in the literature and can utilise any number of data points in
                                                                 I. I NTRODUCTION                               order to capture the best possible spatial features.

                                             The goal of urban planning is to develop cities with the best                           II. R ELATED W ORK
                                          possible productive use of land, the ultimate purpose being              For urban planning, a number of different data sources
                                          improving peoples’ day to day life and better management              have been used by various researchers in their studies
                                          of resources. Generally, the urban planning characterises             to model and characterise land use. The data for these
                                          residential, commercial or recreational use of the land. The          studies comes from either a GPS device, cell phone, or
                                          land classification or zoning determines how each segment of          a Location Based Social Network service. A quick review
                                          the land is to be used. Zoning can be defined as the process          of work related to each of these technologies is provided here.
                                          of dividing land in a city council (municipality) into various
                                          segments based upon its intended use. Thus, it may enforce                 a) GPS:: This data source has limited availability,
                                          a variety of specific or conditional uses of land. It may also        is recorded every few seconds and is usually based on a
                                          indicate the size and dimensions of land area as well as the          small number of subjects. It is not very widely used for
                                          form and scale of constructions. One of the issues associated         land classification purposes. The data set is usually acquired
                                          with zoning is that it requires actual assessment with regards        through buses and taxis e.g. in [5], the authors conduct
                                          to the use of land as originally planned. This information            analysis of GPS tracks obtained from taxis to infer the
                                          needs to be collected on site, and is usually obtained through        mobility of individuals and detect areas of various activities
                                          survey or questionnaire to record how people interact with            using a pre-defined map of the places of interest.
                                          their land. This approach has restrictions in the sense that it
                                          is very much dependent upon the willingness of people to                   b) Cell Phone Data:: Usually known as Call Detail
                                          participate in such activity, involves costs, and, essentially is     Records (CDRs) contain information for a large number of
                                          just a snapshot in time. Technologies such as GIS [1] may             people, but is not easy to acquire because of privacy issues
                                          reveal some of the uses of land through image processing.             and with location precision at the level of mobile tower
                                          However, since images are not acquired very frequently, such          only when some activity is initiated. In [6], the authors use
                                          techniques may not be very productive.                                cell phone data to analyse the relationship between cellular
                                                                                                                activity and commercial land use to identify the prevailing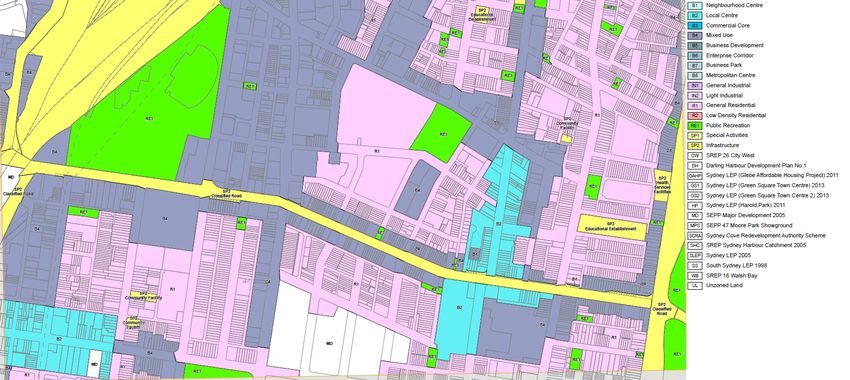
pattern in each area. They qualitatively presented their results             III. DATA S ET & E XPERIMENTAL S ETUP
and did not use any land use information. In another similar          The data set has been collected using Twitter Streaming
study [7], the authors analysed the cell phone activity to         API [13] covering Australia and spanning a period from
characterise and cluster similar locations.                        January 2015 till July 2016. It consists of 9462345 tweets
                                                                   from 245796 unique users. For Sydney we have 947964
     c) Location Based Social Networks:: These offer precise       geo-tagged tweets and 40281 unique users, for Melbourne
location information in the form of latitude and longitude         we have 854821 geo-tagged tweets and 35556 unique users
when users enable the geo-location feature. This data set          and for Brisbane we have 276394 geo-tagged tweets and
can be most up to date and is easy to acquire as a result          14555 unique users in the data set. The proposed method
of ubiquitous use of various mobile and social network             involves using the spatial location of tweets for above three
applications by people. [8] model activity patterns in New         cities of Australia. Brisbane is chosen as the baseline city,
York City and London by using the geo-located information          and Melbourne and Sydney are used as test cities on which
provided by a social networking platform. They characterise        the method is applied. For Brisbane, Central Business District
the activity patterns by using a set of pre-defined categories     (CBD) is chosen as the reference around which various land
which indicate the type of check-in locations. Due to this         use zones are identified based on its city council’s scheme.1
approach, their results provide a coarse idea of the land          Although the council divides land into numerous types, key
use. In another work, [9] present a method to explore land         zones consist of business, residential, education and recreation
use and user activities at a large scale with the help of          since these zones account for the highest twitter activity
Foursquare platform. They validate the results with personal       compared to other zones.
interviews to confirm the identified land uses. In [10], the
authors group twitter users by city zone and various times of         Starting from the Brisbane CBD, corresponding temporal
the day to study the daily dynamics of the city. For a zone,       signatures are extracted for each key zone. These signatures
they compare daytime activity with night time to determine         are later used as a template. The hypothesis is that areas
zones showing increased activity. Using multiple regression,       in different cities can be classified by their similarity to
they determine how various land uses influence different time      these temporal signatures. To detect land use in our test
of the day via changing coefficients. They observed that user      cities, CBDs are selected again and various activity clusters
activity seemed to decrease throughout the day for land uses       are generated from the city-blocks until some meaningful
such as education, health and offices, remained constant for       temporal patterns are obtained. Then, the closest matching
parks, and increased for retail and residential zones. This        temporal pattern from Brisbane is found for each unknown
study aims to establish the link between twitter activity and      cluster and the land use is thus predicted. This predicted
the known land use types and does not intend to determine          cluster is then compared to actual land use based on its city
the land uses from twitter activity itself. In [11] and [12],      zoning scheme and the overlap percentage is calculated for
the authors propose a method to characterise geographic            evaluation.
regions by focusing on day-to-day living patterns of crowds
using Twitter data. To grasp images of a city, the regularity                IV. T EMPORAL S IGNATURE G ENERATION
of a region is defined by using activity patterns such as the
number of tweets, their contents, the number of users and             Using Brisbane as baseline city, each of the key identified
the movement of crowds. Moreover, the changes in regularity        zone is analysed for its twitter activity. Figure 1 shows the
patterns with respect to time are analysed and the grouped         city council’s land zoning scheme based on areas surrounding
urban types are categorised by tracking similar patterns across    the CBD. Since each geo-tagged tweet contains its location
the regions.                                                       information and time-stamp, the temporal pattern for every
                                                                   hour of the day is extracted and plotted. This temporal
                                                                   signature reflects the twitter activity for a given land zone
   In this study, we also make use of publicly available           and spans the entire period of the data set. As a result,
geo-tagged tweets for the identification of land use in a city.    four temporal signatures are generated for business (Blue 1),
However, we purely use the temporal patterns of raw twitter        residential (Light pink 1, 2, 3 & Maroon 1, 2), education
activity without using any textual information or user profiles.   (Yellow 5) and recreation (Yellow 2 & Grey 2) land use,
Our method is simplistic, requires less processing and thus        respectively.
can be applied on any volume of data. Specifically, we use
temporal signatures of Brisbane tweets as a template (training        Figure 2 shows the temporal behaviour of each key land
data) against which land use in other cities is subsequently       zone as the normalised hourly tweets for the entire data
detected and predicted. We validate the results against land       set. Normalisation is the process of adjusting values from
use data provided by councils of test cities and observe a         different scales to some common scale in order to provide a
good match between the predicted land use and actual land          better comparison of the values. For example, the raw data
classification.
                                                                     1 Schemes   can be found here.
Fig. 1: Brisbane City Zoning Map: land use is identified by a combination of colour and number e.g. business (Blue 1),
residential (Light pink 1, 2, 3 & Maroon 1, 2), education (Yellow 5) and recreation (Yellow 2 & Grey 2).
Source: cityplan.brisbane.qld.gov.au/eplan/#/Property/0

for Business cluster consists of very high values for each
hour compared to other clusters, and gives an impression
that it is probably the most ‘active’ cluster. However, a better
analysis would be to figure out the average percentage of
tweets posted in each hour of a day within each of the
clusters. Consequently, each hourly record value is divided
by the overall average of all hours to get the corresponding
normalised value. In this way, the average for all normalised
values is 1 for each cluster.

                              #T c
                      Thc = P23 h c
                             h=0 #Th

where Thc is the percentage of tweets in hour h ∈ {0, . . . , 23}
within cluster c, and #Thc is the raw count of such tweets.
  As shown in Figure 2, the business zone is characterised
                                                                       Fig. 2: Brisbane Temporal Signatures
by a large tweeting activity during day time. The first peak
in the tweeting activity is observed around 1 p.m. and the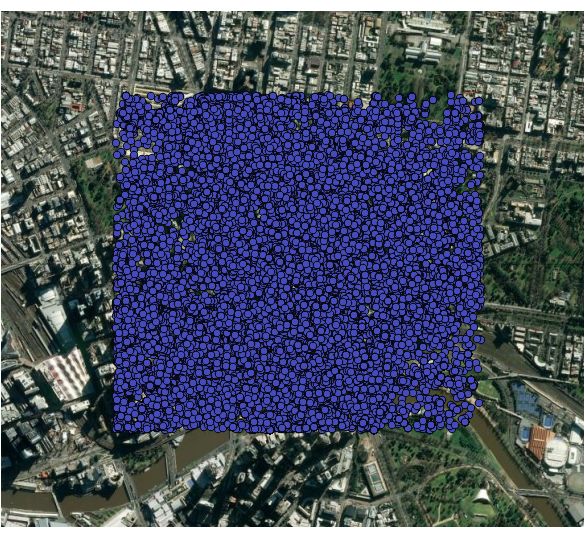
second peak is seen at 5 p.m. This might be related to the            The temporal patterns for each of these unknown clusters
times corresponding to activities such as going for a lunch        are shown in figure 4 and these plots represent normalised
or going home. Spatially, this zone covers areas such as           data. Each of these clusters is yet unknown in terms of the land
hotels, restaurants, shopping centres and offices. Some bus        use that it actually represents. As a next step, these clusters
and train stations are also included in it. Hence, overall this    are compared with Brisbane’s known zones to judge their
zone represents ‘business’ activity in the city. The residential   similarity. This similarity is evaluated quantitatively by using
zone shows increasing twitter activity in the afternoon with       the measure of mean-squared error. The mean-squared error
maximum shown at 10 p.m. It covers areas comprising of             (MSE) function calculates the average of squares of errors,
private residences, apartments and hostels. The education zone     or in other words, the average squared difference between
has its maximum peak at 10 a.m. followed by another one at         the observed values (here a temporal activity signature from
12 p.m. After this, the trend in the twitter activity gradually    Brisbane) and predicted values (here a temporal activity sig-
declines. This zone covers area including a school and a TAFE      nature from Melbourne). It is always non-negative and values
in South Brisbane. The recreation zone has its distinctive         closer to zero are better as they indicate less error, with zero
peak at 7 p.m. after which there is a sharp decline in twitter     signifying no error at all.
activity. Spatially it covers areas including Suncorp Stadium                                    1X
                                                                                                    n
and Brisbane Convention & Exhibition Centre. We hypothesise                           MSE =            (Xi − Yi )2               (1)
                                                                                                 n i=1
that Twitter activities in other cities such as Melbourne and
Sydney have the same pattern for each of the four land             where n is the number of data points, Xi represents observed
uses. We test this hypothesis through our proposed land use        values and Yi represents predicted values. The similarity be-
detection model.                                                   tween values can also be measured with other techniques such
                                                                   as Principal Component Analysis (PCA) [14]. PCA is based on
                 V. L AND U SE D ETECTION                          dimensionality reduction concept and involves building vectors
   In this section, land use is detected for each test city:       based on observed and predicted values. This work, however,
Melbourne and Sydney by using the spatial location of tweets.      uses MSE technique because of its simplicity in calculating
The cluster building process is manual and incremental as per      errors. Each extracted cluster of Melbourne is checked against
following steps:                                                   every zone of Brisbane and the corresponding mean-squared
                                                                   error is calculated. This error is calculated on the basis of each
1) Start from CBD, randomly pickup a city-block, get its
                                                                   hourly normalised value for a cluster and then the overall error
latitude-longitude bounding box, retrieve the data points con-
                                                                   is summed. Table I lists errors for each pair of Melbourne and
tained inside and plot its temporal curve. If the curve contains
                                                                   Brisbane cluster below:
data points for every hour of the day, keep the city-block as
one of the clusters. Otherwise:                                                                           Brisbane Zones
                                                                                          Business   Residential  Education   Recreation
2) Manually expand the cluster by adding adjoining areas            Melb.   Cluster   1    0.045       0.156        0.419       0.387
by enlarging the latitude-longitude bounding box. Check the         Melb.   Cluster   2    0.206       0.204        0.611       0.607
temporal pattern again and expand further if necessary until a      Melb.   Cluster   3    0.098       0.613        0.184        0.90
                                                                    Melb.   Cluster   4    0.239       0.190        0.834       0.117
full temporal curve showing data for every hour of the day is
obtained.                                                          TABLE I: MSE between Melbourne & Brisbane reference
3) Choose another city-block and generate clusters in above        clusters
manner.
4) Discard any cluster with incomplete temporal curve i.e             The minimum error for each pair of clusters is highlighted
missing data points for certain hour(s) of the day.                in bold and based on this, the cluster for Melbourne is
   This cluster generation process emphasises that there should    assigned. e.g. Cluster 1 has the least error when compared
be no zero reading for any hour because this might indicate        against the Business zone of Brisbane. So the model has
that such a cluster is either just random or irregular in nature   predicted that Cluster 1 of Melbourne probably belongs to
with not much activity taking place in it. In comparison, a        Business area of the city. Similarly, Cluster 2 of Melbourne
cluster which has activity for every hour of the day shows         has least error against Residential zone of Brisbane and so
that it is consistently and regularly used by people and this is   this cluster is predicted as Residential. In this way, a land
important for determining an activity or land use eventually. It   use prediction is made for all Melbourne clusters to be later
should also be noted that some of the clusters may eventually      validated against actual land use based on its city council’s
form a little far from the CBD as a result of this process.        classification scheme. If the predictions are mostly correct, it
                                                                   is indicative that we can use a city’s twitter activity pattern as
A. Melbourne Clusters                                              a reference to identify the land use in other similar cities.
   For Melbourne, the cluster building process explained above     B. Sydney Clusters
is followed and eventually four clusters are generated which         For Sydney, the clusters are built in a similar fashion and
are then subjected to further processing and analysis. These       four clusters are generated for further processing and analysis.
clusters are shown in figure 3.                                    These clusters are shown in figure 5.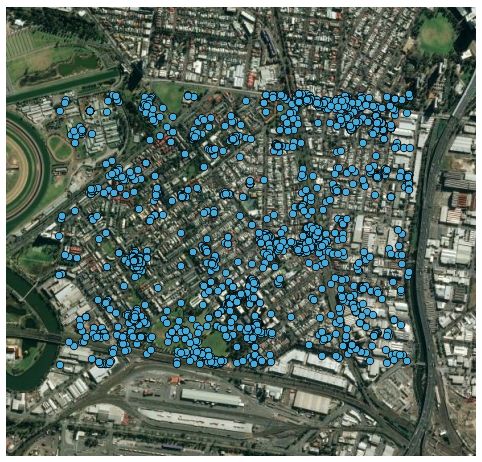
(a) Cluster 1                                           (b) Cluster 2

                                 (c) Cluster 3                                           (d) Cluster 4
Fig. 3: Melbourne Clusters. Cluster 1 ranges from -37.820565 to -37.806470 (latitude) and 144.955165 to 144.974617
(longitude). Cluster 2: -37.799383 to -37.787955 (latitude) and 144.916789 to 144.935543 (longitude). Cluster 3: -37.800277 to
-37.792296 (latitude) and 144.957810 to 144.964049 (longitude). Cluster 4: -37.824938 to -37.817277 (latitude) and 144.971911
to 144.988133 (longitude).

                                                                 Brisbane’s known zones to judge their mutual similarity. Each
                                                                 Sydney cluster is matched against every zone of Brisbane and
                                                                 their corresponding mean-squared error is calculated. Table II
                                                                 lists errors for each pair of Sydney and Brisbane cluster. The
                                                                 minimum MSE error for each pair of clusters is highlighted
                                                                 and based on this, the cluster for Sydney is assigned. Cluster
                                                                 1 is predicted as Business, Cluster 2 as Residential, Cluster 3
                                                                 as Education, and Cluster 4 as Recreation.

                                                                                                          Brisbane Zones
                                                                                          Business   Residential  Education   Recreation
                                                                  Sydney   Cluster   1     0.030       0.238        0.267       0.536
                                                                  Sydney   Cluster   2     0.266       0.114        0.691       0.355
                                                                  Sydney   Cluster   3     0.398       1.204        0.198       1.613
           Fig. 4: Melbourne Temporal Signatures                  Sydney   Cluster   4     0.397       0.321        1.190       0.149

                                                                 TABLE II: MSE between Sydney & Brisbane reference clus-
                                                                 ters
   The temporal patterns of each of these unknown clusters
are shown in figure 6. The plots represent normalised hourly
twitter activity for the corresponding cluster. These clusters                           VI. L AND U SE VALIDATION
are yet unknown in terms of the land use that they actually       In this section, we validate the extracted clusters of
represent. Like Melbourne, these clusters are compared with      Melbourne and Sydney against actual land use and evaluate the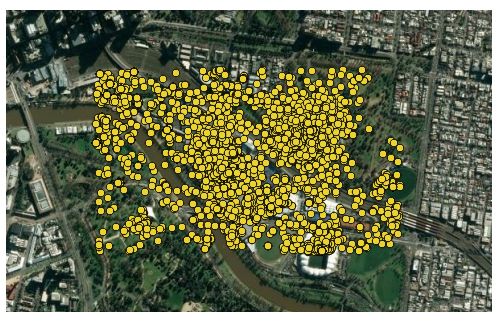
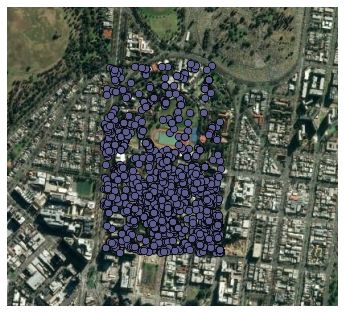
(a) Cluster 1 (b) Cluster 2
(c) Cluster 3 (d) Cluster 4
Fig. 5: Sydney Clusters. Cluster 1 ranges from -33.868316 to -33.863256 (latitude) and 151.202142 to 151.213085 (longitude).
Cluster 2: -33.890915 to -33.888452 (latitude) and 151.196287 to 151.200373 (longitude). Cluster 3: -33.891788 to -33.886575
(latitude) and 151.182370 to 151.190743 (longitude). Cluster 4: -33.895203 to -33.888043 (latitude) and 151.220731 to
151.227083 (longitude).
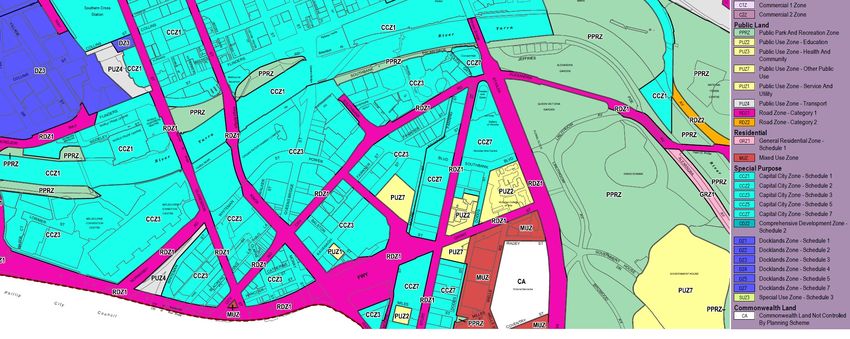
land into commercial, recreation, residential and mixed-use
zones etc. as shown in figure 7. Similarly, the Sydney city
council divides land into commercial, mixed-use, residential
and industrial zones etc. as shown in figure 8.
In order to determine how closely the identified clusters
signify the official land uses, we calculate the degree of
overlap between polygon shape of each extracted cluster and
the polygon of relevant underlying space in the official zoning
map of a city. Table III shows the percentages of overlap
for various types of clusters for both cities. We find that in
general there is a high similarity between the official land use
types and the predicted land use types from twitter. According
Fig. 6: Sydney Temporal Signatures to Table III, the business areas in the official zoning maps
are identified appropriately by our predicted business clusters
with accuracy ranging between 52% and 62%. Similarly, the
overall methodology. To validate the empirical results obtained percentage of similarity between the residential land zone and
so far, the actual land zoning information provided by the city our predicted residential cluster is between 50% and 56%.
councils of Melbourne and Sydney is utilised. Comparison The education cluster of Melbourne is predicted incorrectly
is made against the type of land zone corresponding to the and hence its accuracy against actual education zone is 0%,
predicted cluster type. The Melbourne city council divides whereas for Sydney it is 53.5%. The highest accuracy is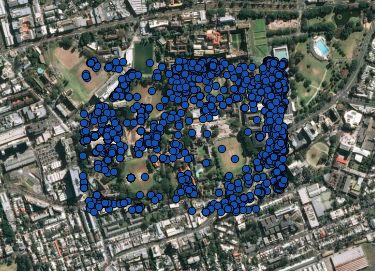
Fig. 7: Melbourne Zoning Map

                                                           Fig. 8: Sydney Zoning Map

 Predicted Land Use                  Official Land Use
                      Business   Residential   Education     Recreation   in all cities, as is the case with Melbourne’s education cluster.
 Melbourne                                                                This is because its corresponding extracted cluster (Cluster
 Business              52.4%         -            -               -
 Residential              -        56%            -               -
                                                                          3) generated slightly higher error with respect to it. In terms
 Education                -          -           0%               -       of calculating the overlap between extracted cluster and its
 Recreation               -          -            -            67.2%      underlying actual land zone, the area of underlying zone
 Sydney
 Business              62.5%         -             -              -       plays a key part. The cluster itself may have been predicted
 Residential              -        50%             -              -       correctly for its actual use, but its overlap percentage is
 Education                -          -          53.5%             -
 Recreation               -          -             -           52.6%      influenced by the size of the council’s land zone area.
                                                                          For instance, the predicted cluster may have a small area
TABLE III: Overlap between the land use predicted by Twitter              owing to concentration of tweets in a limited space but its
activity and the Official land use.                                       corresponding actual land zone area may be much larger.
                                                                          This is possible for places like parks where people might
                                                                          gather in a specific part of it and their resulting cluster will
observed for recreation zone ranging from 52% to 67%.                     be much smaller than the rest of the park, hence yielding
                                                                          smaller overlap percentage. Another issue is the best number
  Not all types of official land zones are necessarily predicted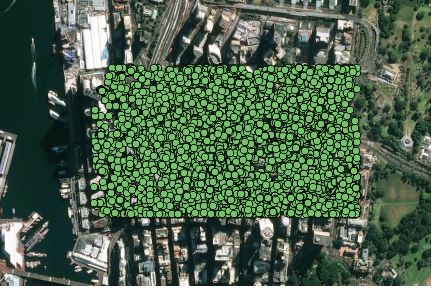
of clusters. Current methodology relies on a limited number                       [6] F. Calabrese, M. Colonna, P. Lovisolo, D. Parata, and C. Ratti, “Real-
of clusters and determining the best number of clusters may                           time urban monitoring using cell phones: A case study in rome,” IEEE
                                                                                      Transactions on Intelligent Transportation Systems, vol. 12, no. 1, pp.
also be a fruitful area for further research.                                         141–151, March 2011.
                                                                                  [7] V. Soto and E. Frias-Martinez, “Robust land use characterization of
    Overall, it can be argued that the predicted clusters in both                     urban landscapes using cell phone data,” in 1st Workshop on Perva-
                                                                                      sive Urban Applications, in conjunction with 9th Int. Conf. Pervasive
cities predominantly match their respective actual land zones.                        Computing, 2011.
Thus, the proposed methodology in this study demonstrates                         [8] A. Noulas, S. Scellato, C. Mascolo, and M. Pontil, “Exploiting semantic
that geo-tagged tweets show great promise for land use iden-                          annotations for clustering geographic areas and users in location-based
                                                                                      social networks,” The social mobile web, vol. 11, no. 2, 2011.
tification, and this suggests profitable areas for future research                [9] J. Cranshaw, R. Schwartz, J. Hong, and N. Sadeh, “The livehoods
in how best to tune this method for maximum accuracy.                                 project: Utilizing social media to understand the dynamics of a city,”
Although, it has been shown that key official land use types are                      in Sixth International AAAI Conference on Weblogs and Social Media,
                                                                                      2012.
reasonably represented by our predicted clusters, this whole                     [10] J. C. Garcı́a-Palomares, M. H. Salas-Olmedo, B. Moya-Gómez,
analysis is still preliminary and needs further investigation.                        A. Condeço-Melhorado, and J. Gutiérrez, “City dynamics through twit-
Moreover, it would also be worth validating the empirical                             ter: Relationships between land use and spatiotemporal demographics,”
                                                                                      Cities, vol. 72, pp. 310–319, 2018.
results against some survey data when available.                                 [11] R. Lee, S. Wakamiya, and K. Sumiya, “Urban area characterization
                                                                                      based on crowd behavioral lifelogs over twitter,” Personal and ubiquitous
                         VII. C ONCLUSIONS                                            computing, vol. 17, no. 4, pp. 605–620, 2012.
                                                                                 [12] S. Wakamiya, R. Lee, and K. Sumiya, “Crowd-sourced urban life
   The availability of massive geo-data generated as a result                         monitoring: urban area characterization based crowd behavioral patterns
                                                                                      from twitter,” ser. ICUIMC ’12. ACM, 2012, pp. 1–9.
of ubiquitous use of various online and mobile applications                      [13] Twitter. (2013, Jun.) Streaming apis. https://dev.twitter.com/streaming/
has highlighted its prospective use in various fields, one of                         overview.
which is urban development and planning. In this study, a                        [14] K. Pearson, “Liii. on lines and planes of closest fit to systems of points
                                                                                      in space,” The London, Edinburgh, and Dublin Philosophical Magazine
method has been proposed and demonstrated for identifying                             and Journal of Science, vol. 2, no. 11, pp. 559–572, 1901.
and predicting land use using Twitter data from Brisbane and                     [15] V. Frias-Martinez and E. Frias-Martinez, “Spectral clustering for sensing
subsequently testing on Melbourne and Sydney. The results                             urban land use using twitter activity,” Engineering Applications of
                                                                                      Artificial Intelligence, vol. 35, pp. 237–245, 2014.
indicate that geo-tagged tweets can represent the land use in
line with official land zoning to a good extent. The percentage
of overlap is found to be as high as 67.2% for Melbourne’s
recreation zone followed by 62.5% for Sydney’s business zone.
The results of this work are comparable to those of [9] and
[15], but the cluster generation method used here is simpler
yet robust compared to those studies which use a much slower
clustering method requiring filtering out of many raw data
points. On the other hand, our method can work with virtually
any volume of data and without removing any records or losing
underlying spatial features.
   It should be noted that the precise nature of activities being
undertaken by twitter users is not determined as a result of
our technique at this stage.

                              R EFERENCES
 [1] J. Yin, Z. Yin, H. Zhong, S. Xu, X. Hu, J. Wang, and J. Wu,
     “Monitoring urban expansion and land use/land cover changes of shang-
     hai metropolitan area during the transitional economy (1979–2009) in
     china,” Environmental monitoring and assessment, vol. 177, no. 1-4, pp.
     609–621, 2011.
 [2] V. Frias-Martinez, C. Soguero, and E. Frias-Martinez, “Estimation of
     urban commuting patterns using cellphone network data,” in ACM
     SIGKDD International Workshop on Urban Computing, ser. UrbComp
     ’12. New York, NY, USA: ACM, 2012, pp. 9–16.
 [3] N. Caceres, L. M. Romero, F. G. Benitez, and J. M. del Castillo, “Traffic
     flow estimation models using cellular phone data,” IEEE Transactions
     on Intelligent Transportation Systems, vol. 13, no. 3, pp. 1430–1441,
     Sept 2012.
 [4] R. O. Oloritun, A. Madan, A. Pentland, and I. Khayal, “Identifying close
     friendships in a sensed social network,” Procedia-Social and Behavioral
     Sciences, vol. 79, pp. 18–26, 2013.
 [5] J. Yuan, Y. Zheng, and X. Xie, “Discovering regions of different
     functions in a city using human mobility and pois,” in 18th ACM
     SIGKDD international conference on Knowledge discovery and data
     mining. ACM, 2012, pp. 186–194.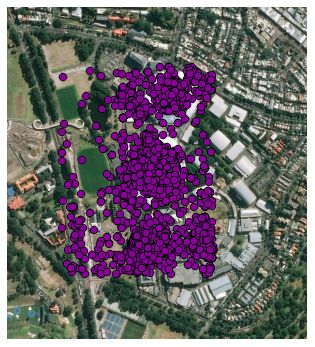
You can also read