ABSENCE OF PROTON TUNNELING DURING THE HYDROGEN-BOND SYMMETRIZATION IN Δ-ALOOH
←
→
Page content transcription
If your browser does not render page correctly, please read the page content below
PHYSICAL REVIEW B 104, 104311 (2021)

             Absence of proton tunneling during the hydrogen-bond symmetrization in δ-AlOOH

                          Florian Trybel ,1,2,* Thomas Meier ,1,3 Biao Wang ,1,4 and Gerd Steinle-Neumann                1
                                    1
                                       Bayerisches Geoinstitut, Universität Bayreuth, D-95440 Bayreuth, Germany
                   2
                       Department of Physics, Chemistry and Biology (IFM), Linköping University, SE-581 83 Linköping, Sweden
                       3
                         Center for High Pressure Science and Technology Advanced Research (HPSTAR), Beijing 100094, China
                                4
                                  Department of Earth Sciences, University of Oxford, OX1 3AN Oxford, United Kingdom

                         (Received 28 June 2021; revised 11 August 2021; accepted 26 August 2021; published 24 September 2021)

                    δ-AlOOH is of significant crystallochemical interest due to a subtle structural transition near 10 GPa from a
                 P21 nm to a Pnnm structure, the nature and origin of hydrogen disorder, the symmetrization of the O-H · · · O
                 hydrogen bond and their interplay. We perform a series of density functional theory-based simulations in
                 combination with high-pressure nuclear magnetic resonance (NMR) experiments on δ-AlOOH up to 40 GPa
                 with the goal to better characterize the hydrogen potential and therefore the nature of hydrogen disorder.
                 Simulations predict a phase transition in agreement with our NMR experiments at 10 − 11 GPa and hydrogen
                 bond symmetrization at 14.7 GPa. Calculated hydrogen potentials do not show any double-well character and
                 there is no evidence for proton tunneling in our NMR data.

                 DOI: 10.1103/PhysRevB.104.104311

                            I. INTRODUCTION                                structure corresponds to distorted rutile, with Al and O atoms
                                                                           located on mirror planes (Fig. 1). AlO6 octahedra share edges
   Hydrogen is an important chemical component in the
                                                                           along the c axis and these octahedra chains are connected
Earth’s mantle, as even a small amount can strongly affect key
                                                                           via corners (Fig. 1). There are two distinct oxygen positions
properties of minerals, such as melting temperature, rheology,
                                                                           (O1 and O2) at the vertices and in the equatorial plane,
electrical conductivity, and atomic diffusion [1–4]. Therefore,
                                                                           respectively. Layers of AlO6 octahedra oriented in different
over the past 20 years, many hydrous minerals, such as dense
                                                                           directions are connected with an asymmetric hydrogen bond
hydrous magnesium silicates [5], have been synthesized at
                                                                           between the layers.
high-pressure (P) and high-temperature (T ) conditions and
                                                                               Single-crystal synchrotron x-ray diffraction (XRD) [15,18]
investigated as potential candidates for hydrogen transport to
                                                                           and neutron diffraction measurements [19,20] identified a
the lower mantle. However, most of these minerals decom-
                                                                           sub- to supergroup phase transition from P21 nm to Pnnm at
pose at P < 60 GPa, where phase H breaks down to MgSiO3
                                                                           ∼10 GPa where O1 and O2 positions become equivalent. The
bridgmanite and a fluid component [6–8].
                                                                           transition is accompanied by a rotation of the AlO6 octahedra
   In 2017, AlSiO3 (OH) was found in diamond inclusions [9]
                                                                           by ∼1◦ , and in the same P range the hydrogen position is pre-
from the mantle transition zone at a depth of 410–660 km.
                                                                           dicted to symmetrize [18,20–23]. In Fourier difference maps
High-P, high-T experiments revealed that this phase can form
                                                                           calculated from their neutron diffraction data, Sano-Furukawa
from hydrous sediment components at upper mantle condi-
                                                                           et al. [20] found a bimodal hydrogen distribution between 9.5
tions (10–12 GPa) [10] and decomposes to δ-AlOOH and
                                                                           and 18 GPa, supporting previous suggestions [18,21,22] that
SiO2 stishovite at conditions similar to those found at the base
                                                                           a double-well potential along the diagonal O-O direction may
of the mantle transition zone (P > 20 GPa) [11]. δ-AlOOH
                                                                           exist, which could give rise to proton tunneling, similar to the
is particularly interesting as it shows a wide stability range
                                                                           state found during the ice-VII to ice-X transition [24–26]. No
including conditions along the geotherm of a subducting slab
                                                                           direct evidence of tunneling has been found to date, however.
[12–14] and may therefore be a potential host of hydrogen in
                                                                               We investigate the phase transition, hydrogen bond sym-
Earth’s lower mantle.
                                                                           metrization (a central unimodal proton distribution between
   δ-AlOOH crystallizes in a primitive orthorhombic lattice
                                                                           the two respective oxygen atoms), and the possibility of
with space group P21 nm at ambient conditions [12,15–17]. Its
                                                                           proton tunneling in δ-AlOOH, combining density functional
                                                                           theory (DFT)-based calculations and high- and low-field high-
                                                                           P nuclear magnetic resonance (NMR) spectroscopy. With
 *
     florian.trybel@liu.se                                                 DFT, we perform a stepwise optimization of the host lattice
                                                                           and the hydrogen positions over a wide volume (V ) range and
Published by the American Physical Society under the terms of the          analyze the potential seen by the hydrogen atoms as well as
Creative Commons Attribution 4.0 International license. Further            the geometry of the AlO6 octahedra. We analyze the signal
distribution of this work must maintain attribution to the author(s)       shift as well as the full width at half maximum (FWHM)
and the published article’s title, journal citation, and DOI. Funded       of our high-field NMR experiments at P of up to 40 GPa
by Bibsam.                                                                 (c.f. Supplemental Fig. S1 in the Supplemental Material [27]),

2469-9950/2021/104(10)/104311(6)                                104311-1                           Published by the American Physical Society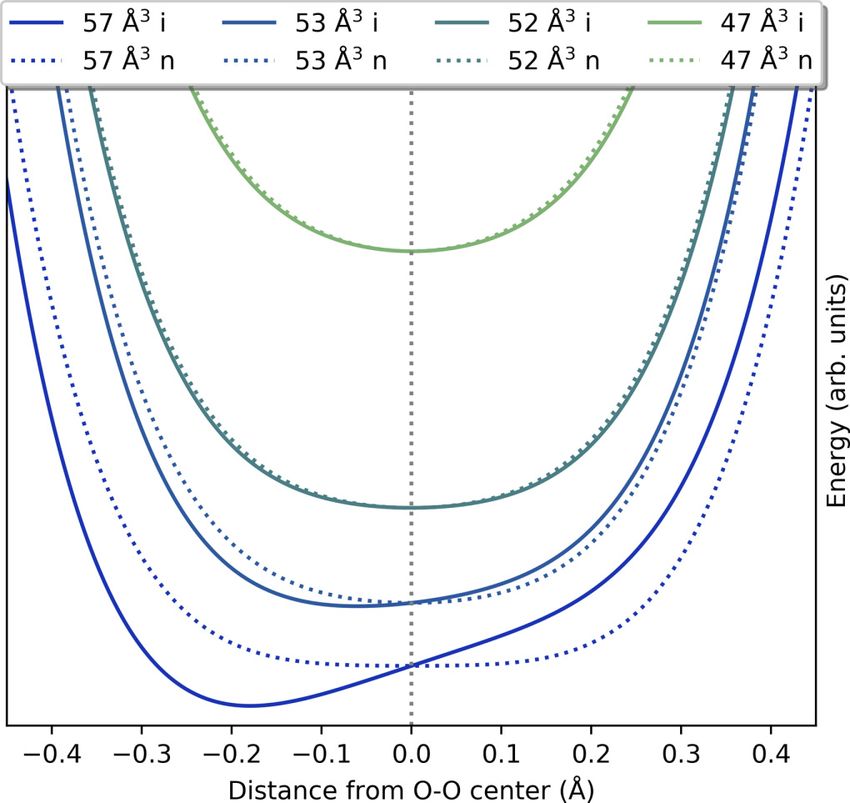
TRYBEL, MEIER, WANG, AND STEINLE-NEUMANN PHYSICAL REVIEW B 104, 104311 (2021)
searching for characteristic features of a phase transition and
using low-field NMR data at 5.6 GPa, we investigate indica-
tions of proton tunneling [25].
II. COMPUTATIONAL DETAILS
All DFT simulations are performed using the Quantum
ESPRESSO package [28,29], where possible GPU-accelerated
[30]. We use projector augmented wave atomic files for Al, O,
and H based on the PBEsol [31] approximation to exchange-
correlation which was previously found to show excellent
agreement with experimental data [22]. For Al the 2p elec-
trons and lower and for O the 1s electrons are treated as
semirelativistic core states. Convergence tests with a threshold
of 10−5 Ry/atom lead to a Monkhorst-Pack k-point grid [32]
of 12 × 8 × 8 for primitive unit cells and a cutoff energy for
the plane-wave expansion of 140 Ry. We use the FINDSYM
code [33] for symmetry analysis and VESTA 3 [34] for visu-
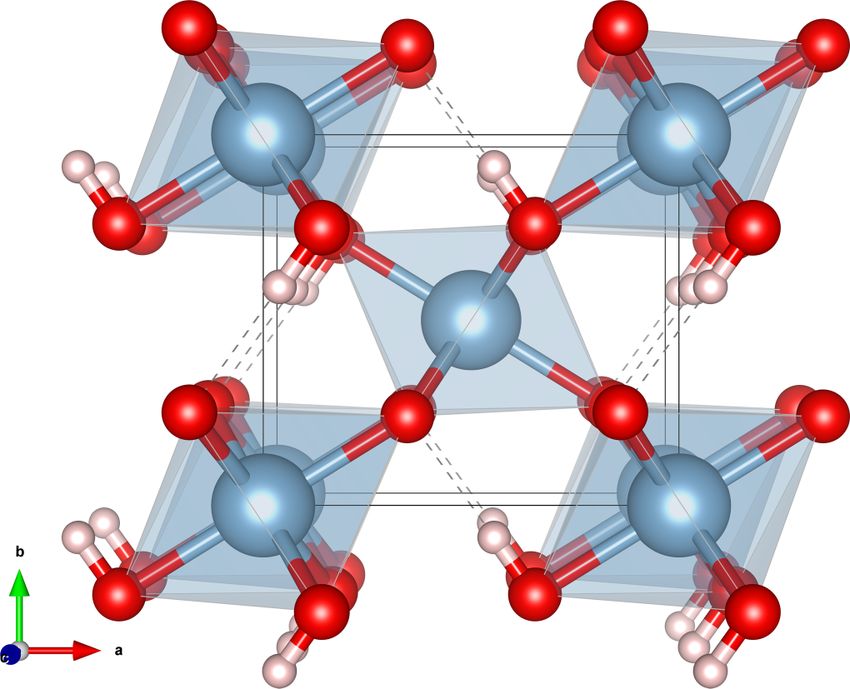
alization of structures. FIG. 1. Crystal structure of P21 nm δ-AlOOH. Aluminum is
shown in blue, oxygen in red, and hydrogen in white. Offset of the
III. EXPERIMENTAL DETAILS hydrogen positions from the center is exaggerated for illustration.
High-P cells with pairs of 250-μm culet diamond anvils
are used, and the preparation of the NMR experiments closely
follows the procedure outlined in our previous work [35]; relax the cell parameters, and perform a final sampling and
3.2 mm excitation coils are formed from single turn cover optimization of the hydrogen positions. Both initial structures
inductors made from 50 μm of copper-coated teflon foil. The [15,20] converge to the same coordinates within the first steps
diamond anvil is coated with 1 μm of copper using physical of the relaxation.
vapor deposition, and subsequently Lenz lens resonators are We sample configurations by displacing the hydrogen
cut out of this layer using focused ion beam milling. atoms along the diagonal oxygen-oxygen direction in the a-b
A 20-μm3 crystal of δ-AlOOH (synthesis is described in plane by starting with both hydrogen atoms being close to
Ref. [36]) is placed in the sample chamber and the DAC is the respective oxygen atom with the smaller b coordinate
filled with neon as a P-transmitting medium. Both excitation (normal configuration) and from the configuration shown in
coils are mounted central to the diamond anvils and connected Fig. 1 (inverse configuration, c.f. Supplemental Fig. S2 of
in a Helmholtz coil arrangement after closing the cell. For the the Supplemental Material [27]). From the energy obtained
high-field measurements, 1045 mT with a corresponding 1 H in each sampling step, we construct the potential seen by the
resonance frequency of ∼45 MHz in an electromagnet is used. hydrogen atom, similar to our previous work on the ice-VII to
Additional homonuclear 1 H - 1 H decoupling experiments are ice-X transition [26] via spline interpolation at each sampled
conducted using a Lee-Goldburg [37] saturation pulse of 25 W V for both configurations. The final positions of the hydrogen
prior to the spin excitation to obtain high-resolution 1 H-NMR atoms are obtained as the minima of the respective spline
spectra. An additional DAC prepared in a similar manner is interpolation (Fig. 2).
filled with distilled H2 O and used as a resonance shift refer- We find distinctly different potential symmetries for nor-
ence. Low-field measurements are performed at 125 mT and mal and inverse sampling with respect to the center of the
a resonance frequency of ∼5 MHz, using the same electro- diagonal oxygen-oxygen distance: Normal sampling results
magnet. Resulting spectra are analyzed by line form matching in a symmetric potential; inverse sampling results in an
to the experimental signal [38]. Pressure is calculated from asymmetric potential (∼0.2 eV lower in energy). Under com-
the Raman signal of the diamonds [39,40] and the AlOOH pression the potentials become narrower in both sampling
volume using the equation-of-state (EOS) from Simonova types, and for inverse sampling asymmetry decreases. At
et al. [36]. V 52.4 ± 0.1 Å3 the potential obtained by inverse sampling
becomes symmetric and the energy difference between the
two potentials approaches zero, with the inverse sampling
IV. STRUCTURAL OPTIMIZATION AND HYDROGEN
remaining slightly lower in energy over the full V range.
POTENTIAL
Contradicting prior suggestions [21,22], both potentials do
In the computations, we start structural optimization with not show any double-well character, even though calculating
reported experimental low-P structures from Komatsu et al. the potential seen by the hydrogen atom from Kohn-Sham
[15] and Sano-Furukawa et al. [20] and optimize the hydrogen DFT should strongly overestimate the potential well without
position for V between 57 and 47 Å3 . We sample and optimize further consideration of the quantum nature of the hydrogen
the hydrogen positions along the diagonal oxygen-oxygen atoms [22,26,41].
direction first, relax the coordinates of all atoms, perform a After each optimization step, we analyze the space group
second sampling and optimization of the hydrogen positions, of the resulting cell and track the rotation of AlO6 octahedra
104311-2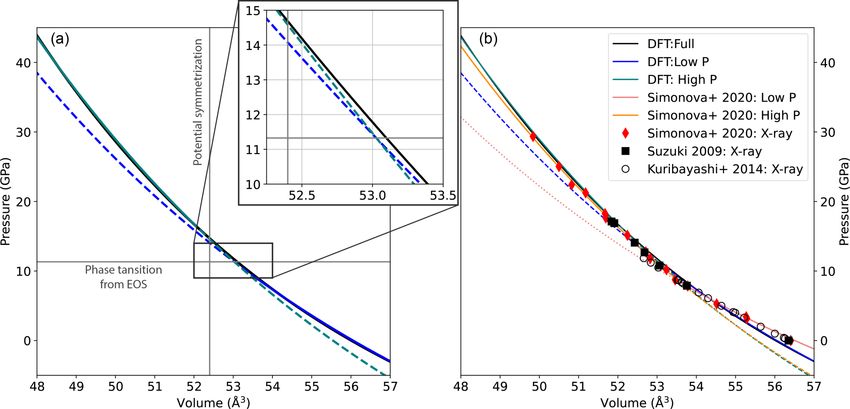
ABSENCE OF PROTON TUNNELING DURING THE …                                                         PHYSICAL REVIEW B 104, 104311 (2021)

    FIG. 2. Comparison of normal (dotted) and inverse (solid) sam-
pling (Supplemental Fig. S2 in the Supplemental Material [27]) of
the potential seen by the hydrogen atom. At large volumes (low P),
normal sampling leads to a symmetric and inverse sampling to an
asymmetric single-well potential with a significantly lower energy
(∼0.2 eV). With increasing compression, this difference vanishes
as the two oxygen positions become equivalent. By construction,
the potentials are equivalent at the central position (indicated by the
                                                                             FIG. 3. Angle analysis for the fully relaxed cell (filled symbols)
vertical dashed line).
                                                                          and the experimental values by Sano-Furukawa et al. [20] (open
                                                                          symbols, SF+2018) following their definition (inset).
using angles ω and ω as defined by Sano-Furukawa et al. [20]
as a function of compression (Fig. 3).
   We find an increase in the angle of ∼0.6◦ when compress-               well as first-order quadrupolar interactions. Therefore, we
ing from 57 Å3 to ∼53 Å3 , followed by a decrease at higher               additionally analyze the line shape of 1 H-NMR solid-echoes
compression for both ω and ω . The angles are in general                 (Supplemental Fig. S1 in the Supplemental Material [27])
∼0.5◦ larger than the experimental values by Sano-Furukawa                and find a minimum in the line width at P = 12.7 ± 0.4 GPa
et al. [20] which show large scatter; the difference between              (Fig. 4(d)), indicating a change in proton mobility.
ω and ω and the P dependence they report are in very good                   Proton tunneling should lead to a zero-field splitting
agreement with our calculations.                                          accompanied by detectable tunneling side bands as it intro-
                                                                          duces an exchange between allowed magnetic transitions with
                                                                          m = 1 and usually forbidden transitions [43]. In work on the
                   V. NMR SPECTROSCOPY
                                                                          ice-VII to ice-X transition in high-P H2 O [25], we showed
   NMR experiments employing Lee-Goldburg decoupling                      that such tunneling side bands can be resolved at high P
pulses lead to line widths of ∼1.5 ppm [shown for 8 and                   using low-field NMR, and that NMR is sensitive to changes in
11 GPa in Fig. 4(a)] which permits the analysis of chemical               the tunneling rate during compression. We therefore employ
shifts with ∼10 ppm [(Fig. 4(c)]. For the chemical shift,                 the low-field setup at P = 5.6 GPa (Fig. 4(b)) and find no
we find an abrupt change at P = 9.9 ± 0.6 GPa from ∼5                     indication for tunneling sidebands in δ-AlOOH, in agreement
to >12 ppm, indicating a structural change in the chemical                with the P evolution of the calculated potentials, showing no
environment of the hydrogen atoms as expected for a phase                 double-well character over the respective compression range.
transition. We find a single proton signal over the full pressure
range indicating a unique, geometrically well-defined proton
                                                                                             VI. EQUATION-OF-STATE
position, in agreement with an earlier NMR study at ambient
conditions by Xue and Kanzaki [42].                                          In order to convert V of the simulation cells to P, we use
   Lee-Goldburg decoupling, while retaining information                   the optimized structures from the inverse configuration and fit
about the isotropic chemical shift interactions and strongly              a third-order Birch-Murnaghan (BM3) EOS to total energy.
focusing the line width, leads to a cancellation of the non-              We use the V at which the potential symmetrizes (52.4 Å3 )
secular parts of the total spin Hamiltonian and thus to a loss            to split the E − V results in two sets and calculate an EOS
of information about spin interactions due to chemical shift              for (i) the full V range, (ii) 57  V  53.5 Å3 , and (iii) 52
anisotropy, direct homo- and heteronuclear dipole-dipole, as              V  47 Å3 (Fig. 5(a)). We calculate the intersection of the

                                                                    104311-3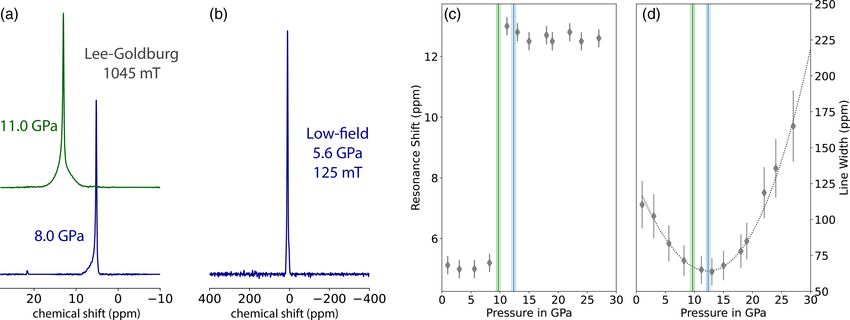
TRYBEL, MEIER, WANG, AND STEINLE-NEUMANN                                                         PHYSICAL REVIEW B 104, 104311 (2021)

   FIG. 4. (a) Lee-Goldburg 1 H-NMR spectra at 8 and 11 GPa at a field of 1045 mT with H2 O as a chemical shift reference. (b) NMR
spectrum of δ-AlOOH at 5.6 GPa (shifted to zero) at a field of 125 mT. (c) Shift of the resonance as a function of pressure in the Lee-Goldburg
spectra. The shift increases abruptly at P = 9.9 ± 0.6 GPa from ∼5 ppm to >12 ppm. (d) FWHM of the resonance peak as a function of P.
A minimum in line width occurs at P = 12.7 ± 0.4 GPa (∼52.7Å3 ). The dotted black line is a third-order polynomial fit to the data between
5 and 20 GPa. In panels (c) and (d), the blue vertical lines show the minima of the polynomial fit to the line width data and the green line
indicates the jump in the resonance shift with the respective errors indicated by the dotted lines.

enthalpy curves for (ii) and (iii) and estimate the transition               The calculated EOS parameters (low P: V0 = 56.0 Å3 ,
P as 11.3 ± 0.6 GPa [horizontal line in Fig. 5(a)], where the             K0 = 183 GPa, K0 = 3.7; high P: V0 = 55.5 Å3 , K0 =
error is estimated from the shift when the point closest to the           224 GPa, K0 = 4.0) are in good agreement with partial EOS
transition in the potential is in-/excluded from the respective           parameters by Simonova et al. [36] (low P: V0 = 56.51(8) Å3 ,
V ranges. The phase transition is of second order as we do not            K0 = 142(5) GPa; high-P part V0 = 55.56(8) Å3 , K0 =
find a V collapse.                                                        216.0(5) GPa, with K0 = 4.0 in both cases) and data from

   FIG. 5. (a) Third order Birch-Murnaghan (BM3) EOS fit to the total energy of the optimized structures from the inverse configuration
sampling. The full V range is fitted by the black curve, V > 53.5 Å3 by the blue curve, and V < 52 Å3 by the teal curve. The vertical line
shows the estimated transition from the potential analysis, and the horizontal line is the intersection of the enthalpy calculated from the two
partial BM3 fits. The inset shows a zoom of the area where low- and high-P partial EOS intersect. (b) Comparison of different V − P data and
EOS from our calculations with literature data by Kuribayashi et al. [18], Simonova et al. [36], and Suzuki [44].

                                                                  104311-4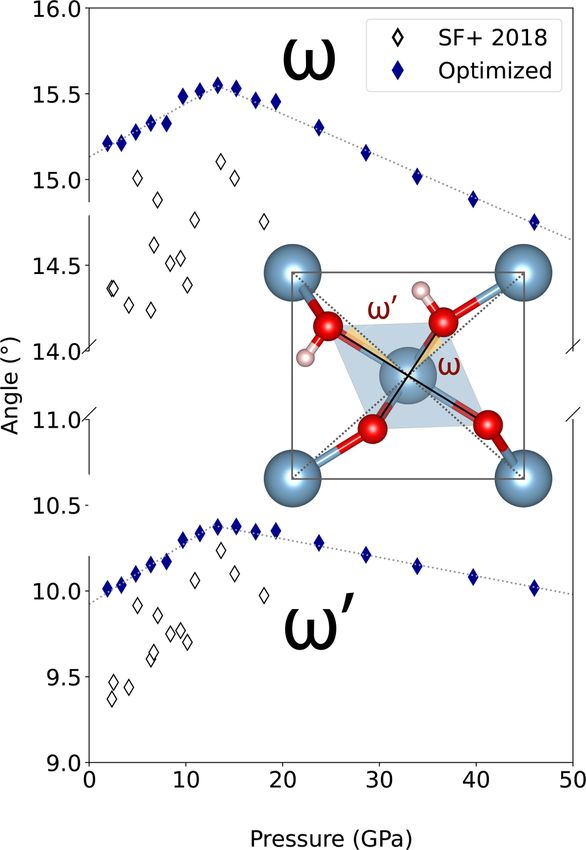
ABSENCE OF PROTON TUNNELING DURING THE …                                                           PHYSICAL REVIEW B 104, 104311 (2021)

   TABLE I. Calculated values of the transition pressure from the low-P P21 nm to the high-P Pnnm structure of AlOOH. For the line width
analysis, errors are estimated from the P error and for the chemical shift from the P resolution of the measurement. For the simulations, errors
are estimated from the P resolution of the sampling and for the EOS calculation as the difference between the intersection P of the low-P and
the high-P sub-EOS (Fig. 5). The last three columns show literature data from Simonova et al. [36] (S+ 2020), Sano-Furukawa et al. [20]
(SF+ 2018), and Pillai et al. [21] (P+ 2018).

Criterion   NMR Shift          EOS        < AlOAl > angles       NMR line width        Potential        S+ 2020         SF+ 2018      P+ 2018
P (GPa)      9.9 ± 0.6     11.3 ± 0.6         13.1 ± 0.7            12.4 ± 0.3        14.7 ± 0.4     >10 (structural)     9/18.1        8/15

Suzuki [44] and Kuribayashi et al. [18] at V < 55 Å3                      P points (P  13 GPa) appear to decrease linearly with P, in
(Fig. 5(b)). At larger V , our EOS slightly underestimates P              agreement with our computational results (Fig. 3). The large
compared with the experimental EOS, which is most likely                  scatter and limited P range in the experimental data impede a
caused by thermal effects not being included in the calcula-              more detailed analysis, comparison, and discussion, however.
tions.                                                                        The absence of a double well in our mapping of the hy-
   Using the respective low-P and high-P EOS parame-                      drogen potential at any V is supported by low-field NMR
ters, we convert all V dependencies to P dependencies and                 measurements which do not show any indication of tunneling
find potential symmetrization at P = 14.7 ± 0.4 GPa and the               side bands. Therefore, we conclude that, contrary to the ice-
maxima in ω and ω at P = 13.1 ± 0.7 GPa (Table I).                       VII to ice-X transition [25,26], there is no tunneling-induced
                                                                          proton disorder in δ-AlOOH. The only observation directly
                                                                          linked to a double-well potential are the Fourier difference
                                                                          maps by Sano-Furukawa et al. [20] that describe an asymmet-
            VII. DISCUSSION AND CONCLUSION                                ric proton distribution at P > 9.5 GPa, followed by a bimodal
                                                                          distribution to P  15 GPa and a symmetric unimodal distri-
    We have analyzed different properties of δ-AlOOH that                 bution at P = 18 GPa. According to our results and data, the
can be directly linked to the phase transition (chemical shift,           intermediate (bimodal) state is not characterized by proton
EOS) and hydrogen bond symmetrization (potential symme-                   disorder. Rather, it reflects order with weak asymmetry that
try), but also properties that should record an influence of              gradually decreases. Therefore, we suggest the following
both processes (angles ω and ω as well as the NMR line                   interpretation of the neutron data: As O1 and O2 become
width). We find features in the same three P regions: (i) The             symmetrically equivalent during the structural transition from
phase transition characterized by the change in chemical shift            P21 nm to Pnnm at ∼10 GPa, asymmetry can no longer be
at 9.9 ± 0.6 GPa and the change in the slope of the E − V                 associated to an O1-H · · · O2 bond, but an averaged picture
curve (and therefore splitting of the EOS) at 11.3 ± 0.4 GPa;             emerges where protons are closer to former O1 and O2 atoms,
(ii) a maximum in the angles ω and ω at 13.1 ± 0.7 GPa                   which may be visible in the Fourier difference maps and lead
and a minimum in the line width at 12.4 ± 0.3 GPa; (iii) the              to the bimodal distribution if projected onto a Pnnm unit cell.
symmetrization of the potential at 14.7 ± 0.4 GPa.
    Comparing our results with recently published experiments
                                                                                               ACKNOWLEDGMENTS
[20,36] and computations [21,22], we find that we match the
phase transition measured via neutron diffraction by Sano-                   F.T. and G.S.-N. were supported by Deutsche Forschungs-
Furukawa et al. [20] and XRD by Simonova et al. [36] at                   gemeinschaft (DFG) within FOR 2440 (Matter under Plane-
∼10 GPa in the NMR experiments and the calculations. Fur-                 tary Interior Conditions) with Grant STE1105/13-1 and T.M.
thermore, we reproduce the hydrogen bond symmetrization                   with Grant ME5206/3-1. F.T. was further supported by the
estimate from the calculation of elastic constants by Cortona             Swedish Research Council (VR) Grant No. 2019-05600. The
[22] and Pillai et al. [21] at ∼15 GPa in our potential analysis.         authors thank Niccolò Satta and Giacomo Criniti for very
For angles ω and ω , we find the same increase in slope                  helpful discussions. Computations were partly performed at
as Sano-Furukawa et al. [20], with a maximum at 13.1 ±                    the Leibniz Supercomputing Centre of the Bavarian Academy
0.7 GPa. If we take a closer look at the data by Sano-Furukawa            of Sciences and the Humanities. GPU accelerated computa-
et al. [20], values for the angles ω and ω at the highest three          tions are supported via the NVIDIA Hardware Grant.

 [1] D. Bercovici and S.-i. Karato, Nature (London) 425, 39                [7] J. Tsuchiya and K. Umemoto, Geophys. Res. Lett. 46, 7333
     (2003).                                                                   (2019).
 [2] T. Inoue, Phys. Earth Planet. Inter. 85, 237 (1994).                  [8] M. Nishi, J. Tsuchiya, T. Arimoto, S. Kakizawa, T. Kunimoto,
 [3] S.-I. Karato, M. S. Paterson, and J. D. FitzGerald, J. Geophys.           Y. Tange, Y. Higo, and T. Irifune, Phys. Chem. Miner. 45, 995
     Res.: Solid Earth 91, 8151 (1986).                                        (2018).
 [4] T. Yoshino, T. Matsuzaki, S. Yamashita, and T. Katsura, Nature        [9] R. Wirth, C. Vollmer, F. Brenker, S. Matsyuk, and F. Kaminsky,
     (London) 443, 973 (2006).                                                 Earth Planet. Sci. Lett. 259, 384 (2007).
 [5] A. B. Thompson, Nature (London) 358, 295 (1992).                     [10] S. Ono, J. Geophys. Res.: Solid Earth 103, 18253 (1998).
 [6] E. Ohtani, Y. Amaike, S. Kamada, T. Sakamaki, and N. Hirao,          [11] A. Sano, E. Ohtani, T. Kubo, and K.-i. Funakoshi, J. Phys.
     Geophys. Res. Lett. 41, 8283 (2014).                                      Chem. Solids 65, 1547 (2004).

                                                                   104311-5
TRYBEL, MEIER, WANG, AND STEINLE-NEUMANN PHYSICAL REVIEW B 104, 104311 (2021)
[12] A. Sano, E. Ohtani, T. Kondo, N. Hirao, T. Sakai, N. Sata, [29] P. Giannozzi, O. Andreussi, T. Brumme, O. Bunau, M. B.
Y. Ohishi, and T. Kikegawa, Geophys. Res. Lett. 35, L03303 Nardelli, M. Calandra, R. Car, C. Cavazzoni, D. Ceresoli, M.
(2008). Cococcioni, N. Colonna, I. Carnimeo, A. D. Corso, S. de
[13] Y. Duan, N. Sun, S. Wang, X. Li, X. Guo, H. Ni, V. B. Gironcoli, P. Delugas, R. A. D. Jr., A. Ferretti, A. Floris, G.
Prakapenka, and Z. Mao, Earth Planet. Sci. Lett. 494, 92 (2018). Fratesi, G. Fugallo et al., J. Phys.: Condens. Matter 29, 465901
[14] X. Su, C. Zhao, C. Lv, Y. Zhuang, N. Salke, L. Xu, H. Tang, H. (2017).
Gou, X. Yu, Q. Sun, and J. Liu, Geosci. Front. 12, 937 (2021). [30] J. Romero, E. Phillips, G. Ruetsch, M. Fatica, F. Spiga, and P.
[15] K. Komatsu, T. Kuribayashi, A. Sano, E. Ohtani, and Y. Kudoh, Giannozzi, in International Workshop on Performance Mod-
Acta Crystallogr., Sect. E: Struct. Rep. Online 62, i216 (2006). eling, Benchmarking and Simulation of High Performance
[16] E. Ohtani, K. Litasov, A. Suzuki, and T. Kondo, Geophys. Res. Computer Systems (Springer, Cham, 2017), pp. 67–87.
Lett. 28, 3991 (2001). [31] J. P. Perdew, A. Ruzsinszky, G. I. Csonka, O. A. Vydrov, G. E.
[17] A. Suzuki, E. Ohtani, and T. Kamada, Phys. Chem. Miner. 27, Scuseria, L. A. Constantin, X. Zhou, and K. Burke, Phys. Rev.
689 (2000). Lett. 100, 136406 (2008).
[18] T. Kuribayashi, A. Sano-Furukawa, and T. Nagase, Phys. Chem. [32] H. J. Monkhorst and J. D. Pack, Phys. Rev. B 13, 5188
Miner. 41, 303 (2014). (1976).
[19] A. Sano-Furukawa, K. Komatsu, C. B. Vanpeteghem, and E. [33] H. T. Stokes and D. M. Hatch, J. Appl. Crystallogr. 38, 237
Ohtani, Am. Mineral. 93, 1558 (2008). (2005).
[20] A. Sano-Furukawa, T. Hattori, K. Komatsu, H. Kagi, T. Nagai, [34] K. Momma and F. Izumi, J. Appl. Crystallogr. 44, 1272
J. J. Molaison, A. M. dos Santos, and C. A. Tulk, Sci. Rep. 8, (2011).
15520 (2018). [35] T. Meier, F. Trybel, G. Criniti, D. Laniel, S. Khandarkhaeva, E.
[21] S. B. Pillai, P. K. Jha, A. Padmalal, D. Maurya, and L. Chamyal, Koemets, T. Fedotenko, K. Glazyrin, M. Hanfland, M. Bykov et
J. Appl. Phys. 123, 115901 (2018). al., Phys. Rev. B 102, 165109 (2020).
[22] P. Cortona, J. Phys.: Condens. Matter 29, 325505 (2017). [36] D. Simonova, E. Bykova, M. Bykov, T. Kawazoe, A. Simonov,
[23] J. Tsuchiya, T. Tsuchiya, S. Tsuneyuki, and T. Yamanaka, N. Dubrovinskaia, and L. Dubrovinsky, Minerals 10, 1055
Geophys. Res. Lett. 29, 15 (2002). (2020).
[24] L. Lin, J. A. Morrone, and R. Car, J. Stat. Phys. 145, 365 (2011). [37] T. Meier, S. Khandarkhaeva, J. Jacobs, N. Dubrovinskaia, and
[25] T. Meier, S. Petitgirard, S. Khandarkhaeva, and L. Dubrovinsky, L. Dubrovinsky, Appl. Phys. Lett. 115, 131903 (2019).
Nat. Commun. 9, 2766 (2018). [38] T. Meier, D. Laniel, M. Pena-Alvarez, F. Trybel, S.
[26] F. Trybel, M. Cosacchi, T. Meier, V. M. Axt, and G. Steinle- Khandarkhaeva, A. Krupp, J. Jacobs, N. Dubrovinskaia, and L.
Neumann, Phys. Rev. B 102, 184310 (2020). Dubrovinsky, Nat. Commun. 11, 6334 (2020).
[27] See Supplemental Material at http://link.aps.org/supplemental/ [39] Y. Akahama and H. Kawamura, J. Appl. Phys. 96, 3748 (2004).
10.1103/PhysRevB.104.104311 for an additional visualization [40] Y. Akahama and H. Kawamura, J. Appl. Phys. 100, 043516
of the structures and 1 H-NMR solid-echoes. (2006).
[28] P. Giannozzi, S. Baroni, N. Bonini, M. Calandra, R. Car, C. [41] C. Drechsel-Grau and D. Marx, Phys. Rev. Lett. 112, 148302
Cavazzoni, D. Ceresoli, G. L. Chiarotti, M. Cococcioni, I. (2014).
Dabo, A. Dal Corso, S. de Gironcoli, S. Fabris, G. Fratesi, R. [42] X. Xue and M. Kanzaki, J. Phys. Chem. B 111, 13156 (2007).
Gebauer, U. Gerstmann, C. Gougoussis, A. Kokalj, M. Lazzeri, [43] S. Clough, A. Horsewill, P.J. McDonald, and F.O. Zelaya, Phys.
L. Martin-Samos et al., J. Phys.: Condens. Matter 21, 395502 Rev. Lett. 55, 1794 (1985).
(2009). [44] A. Suzuki, Mineral. Mag. 73, 479 (2009).
104311-6You can also read