Plate of the Nation: A look at what S.A. is eating and the nation's health - March 2020 - Knorr
←
→
Page content transcription
If your browser does not render page correctly, please read the page content below
Plate
of the
Nation:
A look at what S.A.
is eating and the
nation’s health.
March 2020
We need a fundamental overhaul of our food system
which, in its current form, is a threat to the environment
and human health.

(WWF South Africa report :Agri-Food Systems: Facts and Futures)

                                                                  Our planet is not headed
                                                                  in a good direction on various levels:
                                                                  our collective health is deteriorating,
                                                                  our environment is worsening,
                                                                  and our growing human population
                                                                  will continue taxing food supplies.

                                                                               (The Great Food Transformation: The EAT Lancet Commission Report)
Understand the composition of the

What was
                                                              plate of the nation across the different
                                                              demographics (% of meat eaters,
                                                              vegetarians, vegans, flexitarians).

the reason for                                                Understand the attitudes towards food,

the study?
                                                              what is consumed and the link to health.

•   Knorr would like to help South Africa move towards
    a better food future by providing stakeholders            Understanding if there is an improvement
    (government, NGO’s, Industry, retailers, etc.)            in access to healthy foods.
    with information regarding how & what the nation
    is eating and how it impacts South Africa’s health

•   The main purpose of this research is to create a source
    of information that stakeholders can tap into in order
    to shape the health of the nation
                                                              Understand the challenges in consuming
                                                              healthy foods.
Research was conducted
amongst a nationally representative                                                                                                         10%
sample of SA population,                                                                                                                    Limpopo

aged 16+ years (LSM 2-10)
                                                                                                                                  26%          8%
     48%
     Males
                                      52%
                                      Females
                                                                                                              7%
                                                                                                            North West
                                                                                                                                  Gauteng    Mpumalanga

     78%
     Black
                                      65%
                                      Urban
                                                                                                                         5%
                                                                                                                    Free State
                                                                                                                                                      19%
                                                                                                                                                  Kwa-Zulu Natal

                                                                                         2%
     10%                              35%
                                      Rural
                                                                                    Northern Cape

     White

     9%
     Coloured
                                                                                                                     12%
                                                                                                                   Eastern Cape

     3%
     Indian/Asian
                                                                            12%
                                                                          Western Cape

Methodology:                              Fieldwork took place between 11-23 Feb 2020
•   CAPI (Computer Aided Interview)       •   This is an annual study and we will be tracking how the plate changes over time
•   Sample size: n=1005                       - All figures in the presentation are percentage figures (%) unless otherwise stated
•   30 minute questionnaire                   - Additional data from WWF has also been included to complete the picture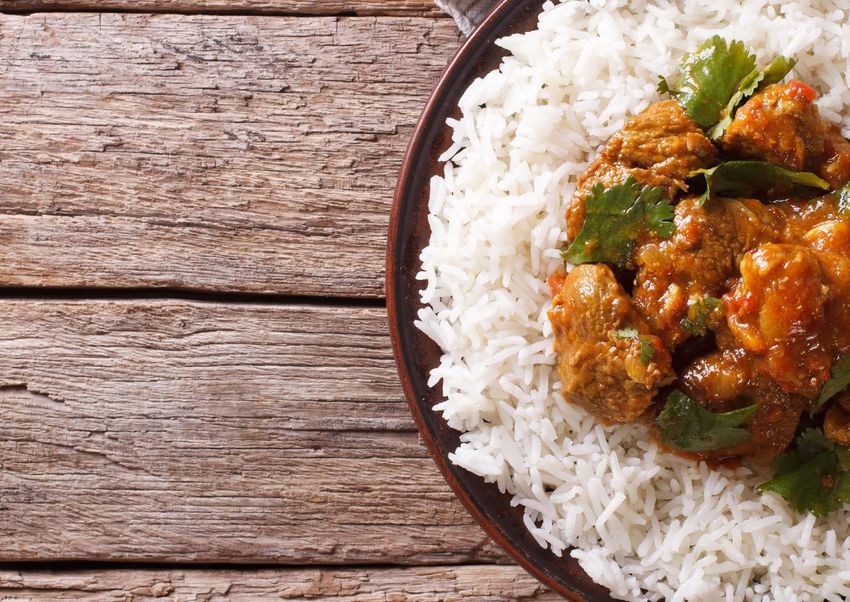
Summary of findings
•   South Africans generally understand the main tenets of healthy             - South Africans may have a good repertoire of fruit and vegetables
    eating i.e. eating vegetables                                          		    they claim to eat, it is the frequency of consumption that is the
                                                                           		    issue as well as the proportions of vegetables and fruit to meat
•   However, there is a massive discrepancy between what is “known”        		    and starch
    and what is “done”                                                     		    • Starch is eaten 6 times a week, with bread, rice, potatoes
    - Vegetables are seen as far less important to include in a meal       			      and mielie pap being the most popular.
		    than meat or starch                                                  			      Around half the population do not use any type of
                                                                           			      vegetables as a substitute for starch
•   Whilst ¾ South Africans claim to eat healthily with some regularity,       - Overall, bread with eggs and pap and meat are the most
    the general eating habits of S.A. are out of kilter with               		    consumed meals in South Africa
    recommendations
    - South Africa has a meat eating culture with meat being eaten,        •   70% of South Africans admit to snacking in between meals
		    on average 4 times per week.                                             - Some more than on one occasion during the day
		    • Poultry and red meat are most favoured.                                - South Africans have an average of 6 snacks in their repertoires
			      - Beans are the most used substitute, likely due to the fact      		    with chips being the most widely consumed
				        that meat is relatively expensive
                                                                           •   Word of mouth and health care professions are the main sources
•   The typical South African plate has a far greater proportion of            on nutritional information.
    meat and is lacking in vegetables                                          - Online sources are still quite low and this may be due to trust
		    • This is likely to be linked to the importance of traditional       		    and credibility more than accessibility
			      foods in SA
    - As kids are generally eating the same as their parents, a kid’s      •   The importance of Knorr’s purpose of “Reinventing Food for Humanity”
		    plate is also lacking in vegetables                                      has never been more relevant & important for South Africa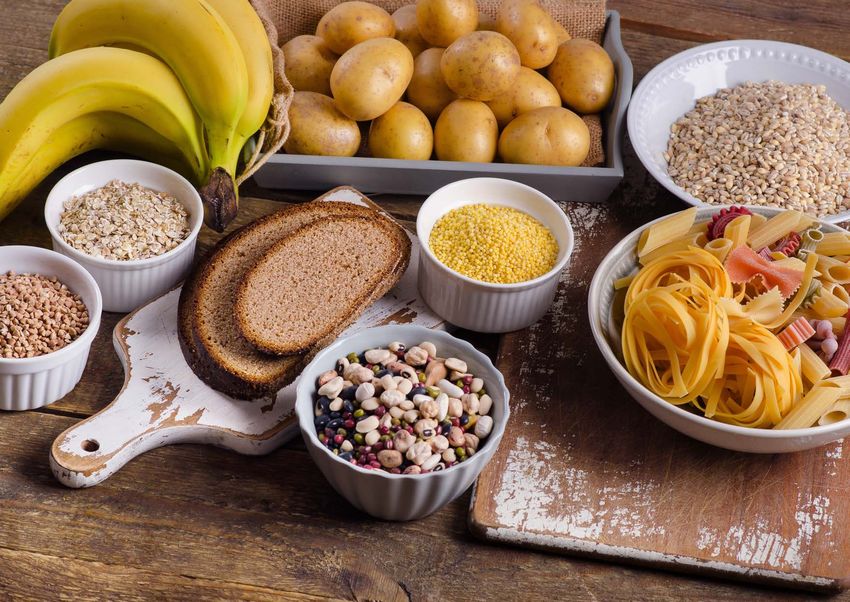
It’s been said that South Africa
is the unhealthiest nation on earth
The Indigo Wellness Index focuses on ten key metrics:
Blood pressure, Blood glucose, obesity, depression, happiness, alcohol use, tobacco use,
exercise, healthy life expectancy, and government spending on healthcare.

                                                                                           (Source: Indigo Wellness Index, 2019)
FOOD SECURITY, SAFETY AND NUTRITION

                                                                            >50% increase
                             26%            of South Africans
                                            are considered
                               FOOD SECURITY, SAFETY AND NUTRITION
                                                                            in consumption of processed
                                                                            and packaged food since 1994
                             FOOD  INSECURE
                                                                     >50%
                                                                 45,8%             increase
                             26%            of South Africans
                                FOOD SECURITY,    SAFETY
                                       are considered    AND NUTRITION
                                                       consumption
                                                                          increase
                                                                     in consumption
                                                                   of processed
                                                                  and  packagedmeat
                                                                                food since
                                                                                          in
                                                                                    of processed
                                                                                     since 1994
                                                                                           1994
                  27% FOOD71%
                           INSECURE
                  experience
                               of
                         26%women
                  children 50%     2017
                                                                          in consumption
                                                                                 increase
                                                                                         increase
                                                                                          of processed
                                                                                                  in1994
                             overweight                                   and
                                                                           of packaged   food
                                                                                    the year ofsince
                                                                                                the

                  27% FOOD or  INSECURE                          consumption of processed meat since 1994
                  stunting        obese      deaths caused by world’s largest

                               71% of                                             2017
                                             diet-related NCDs Listeriosis outbreak

                  children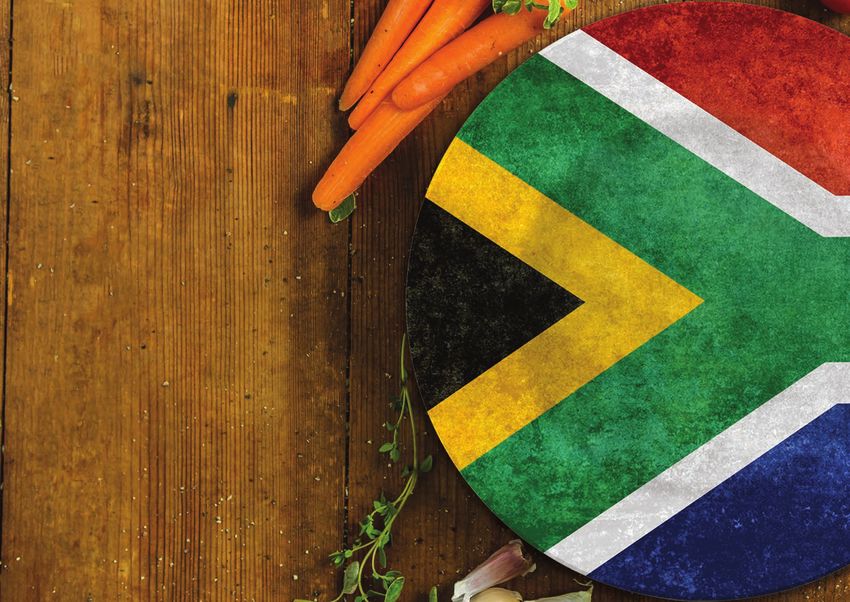
¾
  Over

                             23% 31%
                                 Not at all
  of South Africans                                            Always*
     claim to eat
   healthy meals
with some frequency                       46%
                                            Sometimes
                                                                                  South Africans
                                                                                eat an average of
                                                                               2 meals per day with
                                                                              weekday dinner being
                                                                            the most consumed (88%)
                                                                             and weekend breakfast
                                                                              being the least (54%)

                      * Higher % of vegetarians, women, white South Africans and
                        those in WC fall into this segment. There is a higher incidence
                        of acknowledged health issues in this group which may also
                        be driving behavior (vs. eating healthily to prevent issues)

                      Yet 47% admit to eating the same foods most of the time
                      i.e. low dietary diversity

                      Interestingly nearly 2/3 of the self-proclaimed healthy eater group also
                      identified themselves as having a more diverse diet i.e. “like to try new
                      and different foods” – this may be a function of affordability and food
                      experimentation confidence or simply that there’s an understanding in
                      this group that healthy eating and diverse diets are linked
62%
of South Africans get their nutritional information
from friends and family
This is in line with other general findings around what’s considered
a reliable source of information
                                       U.S.   Brazil   China   India   Russia   South Africa

                                               58               60
                                                        54                          54
Personal recommendation                47
for brands are more
                                                                        36
important than they were
a few years ago

Source: IPG New Realities Study 2019
                                                                       % Strongly Agreeing

•     Half of those with acknowledged medical conditions also rely on
      health care professionals for advice                                                        Health
                                                                                                          y
                                                                                                 tend t eaters
•     Packaging also plays an important role – particularly for self-pro                       nutritio o look for
                                                                                                       nal inf
                                                                                                  more s      o from
      claimed healthy eaters                                                                             ou
      - 42% look at info on packs vs 31% of non-healthy eaters                                   (2,5 vs rces
                                                                                                         1,9 for
                                                                                                 non-h
                                                                                                        ealthy
                                                                                                    eaters
•     1/3 of people look to traditional advertising such as TV, radio and                                  )
      billboards, to get nutritional info

• Surprisingly, in this digital age, neither social media nor the
  internet (blogs, google, product pages etc.) were used by as many
  South Africans as you might imagine
  - 23% internet
  - 20% social media
  - This is likely linked to the decreasing trust people claim to have
		 in these channels (Edleman Trust Report 2020)
Vegetables are seen
to lead the charge
in terms of healthy eating
However, there is a massive discrepancy
between what is “known” and what is “done”.
                                                                    Thank
                                                                 respon fully, not on
                                                                          dent a         e
 Healthy eating means:                 What food is healthy:                     dmitte
                                                                         not ea         d to
 • Eating lots of vegetables (29%)     • Vegetables (74%)       any fru         ting
                                                                        it and
                                                                               vegeta
 • Eating fruits (19%)                 • Fruit (53%)                                  bles!
 • Eating good food (19%)              • Fish / Seafood (11%)
 • Living a healthy lifestyle (17%)    • Red meat (9%)
 • Cut down on fatty/oily food (10%)   • Dairy products (8%)
                                       • Chicken (8%)

                            Starch is eaten more frequently
                                  than fruit and vegetables

    STARCH                   MEAT            VEGETABLES
      6X                      4X                   4X
Despite the claimed belief that they
are generally eating healthily,
the general eating habits of S.A. are out of
kilter with recommendations
• The typical South African plate has a far greater proportion
of meat and is lacking in vegetables
TOTAL SA PLATE RECOMMENDED IMPORTANCE OF INCLUDING IN A MEAL
COMPOSITION COMPOSITION
The Eatwell plate composition as defined 6
ADULTS AGE 16+ by the University of Cambridge and the NHS
5
9% 8% 12%
26% Meat 4
8% 3% Legumes
29% 15% 3
13%
32% 2
33% 1
41%
0
BREAKFAST LUNCH DINNER
Meat Products/Legumes (Incl. Eggs) Starch Vegetables Dairy Fats & oils Starch Meat Vegetables/Fruit Dairy Legumes
of
The % late
nap • As kids are generally eating the same as their parents, a
meat o e even
s
increa uring kid’s plate is also lacking in vegetables
rd
furthe casions” • Vegetables are seen as far less important to include in a
ia l oc
“spec meal than meat or starch
(37%)The vast majority of SA
are meat eaters
2% 14%
0.1%
0.3%
84%
Meat Eater
Pescatarian
Vegetarian
Flexitarian
Vegan
90% of South Africans
eat meat 2x week+
Meat is eaten on average 4 times per week, with poultry
& red meat being the most favoured
On average, each South African eats more than 58kg of meat
92% 83% 53% 45% every year, compared with around 40kg in 1994 – mostly chicken
and processed pork products such as sausages and polony.
Poultry Red Meat Seafood Pork
Source:
https:/
/www.iol.co.za/lifestyle/health/sa-eating-habits-survey-paints-grim-picture-1926140Top dishes are all centred
around starch, and for lunch
and dinner, tend to
include meat
PLATE COMPOSITION PLATE COMPOSITION PLATE COMPOSITION
WEEKDAY BREAKFAST WEEKDAY LUNCH WEEKDAY DINNER
10% 9% 8%
15% 3% 4%
2%
3%
7% 27%
31%
16%
17%
13%
7%
50%
41%
37%
Meat Products Starch Vegetables Dairy Legumes Fats & Oils
BREAKFAST LUNCH DINNER
WEEKDAY WEEKDAY WEEKDAY
• Bread/Toast (65%) • Bread/Sandwich (32%) • Pap & Meat (21%)
• Bread/Toast & Egg (31%) • Pap & Meat (21%) • Rice & Meat (7%)
• Porridge (20%) • Rice & Meat (7%) • Stew (4%)
• Cereal (20%)
• Oats (11%)Top dishes are all centred
around starch, and for lunch
and dinner, tend to
include meat
ADULTS AGE 16+
PLATE COMPOSITION PLATE COMPOSITION PLATE COMPOSITION
WEEKEND BREAKFAST WEEKEND LUNCH WEEKEND DINNER
9% 8%
10% 3%
3% 17% 3%
5% 3%
29%
34%
15%
17%
15%
7%
48%
39%
35%
Meat Products Starch Vegetables Dairy Legumes Fats & Oils
BREAKFAST LUNCH DINNER
WEEKEND WEEKEND WEEKEND
• Bread/Toast (71%) • Bread/Sandwich (48%) • Pap & Meat (54%)
• Bread/Toast & Egg (36%) • Pap & Meat (21%) • Rice & Meat (43%)
• Porridge (20%) • Rice & Meat (21%) • Stew (5%)
• Cereal (17%)
• Oats (14%)When meat isn’t available,
nearly 1/3 people don’t
replace it with anything
But 2/3 will use beans (especially self-proclaimed
healthy eaters)
MEAT REPLACEMENTS USED
Beans 66
Mushrooms 24
Lentils 18
Textured Veg Protein 17
Soya 10 Meat Subs:
Used most by
Paneer 1 Females, KZN,
Flexitarians,
None 27 Health Conscious93% 88% 80% 78% 55%
¾
Over
BREAD RICE POTATOES/ MIEILIE PAP PASTA
SWEET POTATOES
45%
BREAKFAST
54%
PUMPKIN/
40%
NOODLES
40%
OATS
5%
COUSCOUS/
CEREALS BUTTERNUT QUINOA/BARLEY
FREQUENCY OF STARCH CONSUMPTION
2%
20%
of South Africans EVERY DAY
2-3 TIMES PER WEEK
ONCE A WEEK
eat starch 78%
every day
Only when starches
aren’t available, STARCH REPLACEMENTS USED
do vegetables
start to play Green Beans 37
a bigger role
in meals. Cauliflower 30
White Beans 21 Starch Subs:
Used most by
Eggplant 9 White, Urban,
WC, LSM 7-10,
Courgettes 3 Health Conscious
None 48The high consumption of starch and meat dishes
in SA is linked to the importance of traditional
food in the country
100%
of South Africans claim
to eat some form of
traditional/indigenous food
82 81 80
73
61 59
53 50 47 46
37 35 35 31
17 13 13 10 9 4
Smiley
Gatsby
Bunny Chow
Vetkoek
Mielie Pap
Boerewors
Samp & Beans
Chakalaka
Tripe
Biltong
Walkie Talkies
Kota
Amakhekhe
Samoosas
Potjiekos
Mopane Worms
Bobotie
Salomie
Bokkoms
Ostrich Eggs
1/3 A plant based diet is:
South Africans state that they don’t - Don’t know (36%)
know what a plant based diet is with - Vegetables (20%)
an additional significant proportion - Food from the garden (11%)
merely guessing what it may be! - Fruit (8%)
- Eating healthy food (5%)
- Food from plants (4%)Whilst South Africans
have a good repertoire of
fruit and vegetables
they claim to eat, it is the VEGETABLES REGULARLY CONSUMED
frequency of consumption Tomato
Onions
82
81
Cabbage 80
that is the issue. Carrots
Beetroot 61
75
Spinach/Kale 60
Lettuce 54
• Vegetables are consumed far less frequently
Peppers 52
than starch Cucumber 51
• On average 4x week, with the more accessible and Avocado 49
affordable tomatoes, onions, cabbage and carrots Mielies 38
being the most regularly consumed Beans 33
Mushrooms 32
Cauliflower 24
FREQUENCY OF CONSUMPTION Brocolli 22
Peas 21
2% Squash 19
13% 1% EVERY DAY
2-3 TIMES PER WEEK
36% ONCE A WEEK FRUITS REGULARLY CONSUMED
2-3 TIMES PER MONTH
48% ONCE A MONTH Bananas 77
LESS OFTEN Apples/Pears 72
Mangoes 50
Citrus 35
Guavas 33
• Unsurprisingly, self-proclaimed healthy eaters Stone Fruits 30
Melon 30
have a larger repertoire of vegetables eaten than
Berries 21
the ‘average’ South African Granadillas 16
• 13,5 fruits and veg vs. 10,8 for those with a ‘not Kiwi Fruit 12
healthy’ dietTime of the year
and seasonality
only impacted the diets
of 1/5 South Africans
Self-proclaimed healthy eaters and those with a
self-identified diverse diet were more likely to eat
different things in summer vs. winter.
Seasonal changes in diet also occur most among white
and those living in the Western and Eastern Cape
Yes No
100
90
80
70
69 71
60 78 86
50
40
30
20
31 29
10 22
14
0
Total Healthy Non-healthy Diverse
Eaters Eaters Diet
Winter diets are even more meat (73%) and starch
(74%) heavy than those in summer.
Legumes also stand more chance of being consumed
in winter – although only by 25% of people
Whereas fruit and vegetables (inc. salad) fare better
in summerAccess to healthy food is not a problem,
however affordability is a concern for many
82% Access to Healthy Food
11
THINK IT HAS 26
BECOME EASIER • But only 52% think healthy food is affordable
TO FIND HEALTHY • And they may not be wrong at a certain level
- Fruit, fish, bread & cereals price changes were the highest
63
FOOD IN THE food inflation contributors (y-o-y) with 8.7%, 6.7% and 6%,
respectively, with vegetable price inflation 1.1% higher than
PAST 5 YEARS a year ago. (NAMC Feb 2020) YES SOMETIMES NO
30%
Change in nominal cost of food groups
% Change (m-o-m) % Change (Y-o-y) 25.5
25%
in the NAMC food basket
20%
14.6
15%
10%
7.2
5.5 6.6
5% 2.6
1.0 0.5 1.1 0.3 1.1
0%
-1.0 -1.1
-2.1
-3.3-2.6 -2.6
-5% -4.0
-10%
Animal Protein
Bread & Cereals
Coffee & Tea
Vegetables
Dairy & Eggs
Fruit
Bean Products
Fats & Oils
Sugary FoodsAnd then of course,
there’s snacking TOTAL
%
TOTAL 708
70%
of South Africans admit to snacking in between meals
Biltong
Cakes/Doughnuts/Muffins
Cheese
21
27
24
- Some more than on one occasion during the day Chips (potato, corn etc) 55
- Snacking is most prevalent among 25-34 year olds and in urban areas Chocolate 42
Dried fruit 14
Surprisingly , having kids in the house did not appear to particularly influence Fizzy drinks (e.g. Coke, Sprite etc) 37
whether or not adults indulge in snack attacks! In fact, those housesholds Fruit/fruit salad 34
without kids claim to have larger snacking repertoires than those with kids Granola bars/Cereal bars 4
with higher consumption of biltong, chips, nuts and biscuits. Ice-cream 33
Mageu 16
• South Africans have an average of 6 snacks in their repertoires Magwina 19
with chips being the most widely consumed Mielies 13
Nuts 31
More self proclaimed “non-healthy” eaters have smaller snacking repertoires
Pies 19
than those who always/sometimes eat healthily but they eat more chips and
Popcorn 37
drink more fizzy drinks.
Pretzels 6
Raisins 20
The “healthier” crowd also include dried fruit, nuts, yogurt and cheese into
their snacking. Rice cakes/Crackers 6
Samoosas 12
Sandwiches 29
Consumption of soft drinks has also risen more than 68%, with the overall Savoury biscuits 11
consumption of processed sugar increasing by almost 33% since 1999. Seeds (sunflower or seed mix) 3
Source: https:/
/www.iol.co.za/lifestyle/health/sa-eating-habits-survey-paints-grim-picture-1926140 Smoothies 14
Sweet biscuits 33
Sweets (gums, hard boiled) 15
46% 66% 30% Trail mix 1
Vegetables (carrot sticks, tomatoes) 12
Yoghurt (tubs or drinks) 31
BREAKFAST LUNCH DINNER BEDTIME
The most popular time to
snack is between lunch and
dinner (47%)PEOPLE economic productivity.
South Africa has kept the prevalence of undernourishment below 5% since 1990 and
is close to reaching the World Food Summit goal of decreasing the undernourished
population to 50% of the 1996 value. However, in a country where half the population
The economic development of a nation depends in part
lives below the poverty line, South Africa still faces significant challenges. Paramount
on the health of itsamong
population. Addressing
these are diet-related thesuch
health problems, non-
as the growing prevalence of obesity
communicable disease (NCD) epidemic is critical to
and non-communicable diseases (NCDs), and the persistence of hunger, nutrient
deficiencies and stunting.
improving public health and economic growth.
Risks are most pronounced for women, children and those with low income, reflecting
In South
and Africa
reinforcing alone,
historic half of all
socio-economic South African
disparities. adults
The already overburdened public
are overweight
healthcare system is beingorstressed
obese, evenwhich inthe
further by most
growingcases,
health impacts of
ais‘nutrient transition’ –of
the outcome from traditional
poor diet anddiets high in cereals andlife-
a sedentary fibre to a diet
high
style,in sugars, fats and to
according animal-source
Discovery protein. This is compounded
It added that being by associated
environmental challenges across the food value chain that further reduce population
obese increases healthcare costs by as much
health and well-being and pose a material risk for business and the economy.
as R4,400 a year for each person – a hefty added
R27 BILLION burden
South onincreasingly
Africa’s the cost industrialised
of healthcare nationally.food system makes it even
and concentrated
more difficult to address these food-related health risks. Highly processed, nutritionally
LOSSES TO SA’S GDP poor, energy-dense foods that are high in saturated fats, sodium, added sugars,
Dietary risk factors and physical inactivity are
synthetic additives and preservatives are not only readily available but also affordable
FROM 2006–2015 responsible for the majority of global disease –
and socially acceptable. The dominance of these foods in the market is having a negative
DUE TO DIABETES, nearly
impact double
on small the number
food producers and the of deaths
informal caused
market, by healthier, more
undermining
STROKE AND tobacco and four times the number caused by
diverse rural and local food networks and their associated shorter value chains.
CORONARY HEART abuse of alcohol and drugs. People tend to be
This has already resulted in real costs and increased social and health impacts. The
overly-optimistic about their health status.
DISEASE accumulated losses to South Africa’s gross domestic product (GDP) from 2006–2015
from diabetes, stroke and coronary heart disease alone are estimated at R27 billion.
ObesitytoisGenesis,
According one ofanthe major public
economics-based health
consulting concerns
firm, NCDs already account for
facing South Africa, nearly
and 40% its of
impactand cost extends to individuals,
healthcare spend in Gauteng. They estimate that by 2030 this spend
families, communities,will
the health
reach service,
R19,2 billion andsociety
per year. 3
as a whole. The
number of people within South Africa who are overweightor obese has
ECONOMY AND POVERTY
been rising annually over the past few decades, and this situation simply
cannot be allowed to continue.
Agriculture is an important economic sector and should provide decent jobs and support
Most South Africans consume
livelihoodsless fruits andvegetables
for smallholder and
farmers and others. As amore
result, fat- and sector has
the agriculture
sugar-containing foods. The sad reality is that obesityis not confined
been identified by the South African government as both a job creator toand crucial to
the adult population,addressing
but childhood obesity is inequities.
pervasive resource-access also on However,
the risedue to history of social
South Africa’s
inappropriate feedingexclusion
practicesand for infants
economic and young
inequality children.
on the basis of race still defines the agriculture sector
(Deputy Minister of Health) today. For decades, ‘black’ population groups were denied ownership of land, provided
with limited or no electricity sources and were last in the queue for safe, clean water-
provisioning systems.4 This legacy has compounded poverty and today, small farms
By 2030, NCDs will account for five
and farmers, times
most of whomas are
many deaths as communicable
land-dispossessed ‘black’ South Africans, are generally
diseases in low and excluded middleand income countries.
marginalised, unable to According to Stats
gain access to finance SA,
or markets.
non-communicable diseases accounted for 57.4% of deaths in South
Africa in 2016. For the See genesis-analytics.com, Von Bormann & Gulati, 2016
first time since 1997 diseases of the circulatory
3 4
system are the top ranking underlying main group of natural causes.
Overall,
Agri-foodthe results
Systems: show| Page
Facts and Futures a considerable
12 burden of disease from non-
communicable diseases and concerning signs of a sizable proportion.And it’s not just
about the health
of the nation’s people SOUTH AFRICA'S FOOD SYSTEM
AND THE ENVIRONMENT
• Total agriculture accounts for around a quarter of all greenhouse gas CLIMATE CHANGE The agri-food value
emissions, of which approximately 60 percent is due to animal causes increasing erratic weather
chain accounts for
more GHG emissions
agriculture. Compared to plants, production of animal-based foods is patterns and a shift in production areas than any other sector
more water and land intensive and emits more greenhouse gases.
• 75% of the global food supply comes from only 12 plant and five animal 80% of biodiversity
3% of the country
has the right climate and soil
on farms is at risk
species. Just three (rice, maize and wheat) make up nearly 60 percent combinations for rain-fed crops
of calories from plants in the entire human diet.
• Despite there being between 20,000 and 50,000 discovered edible
plants, only 150 to 200 are regularly eaten by humans. 50%
of all SA’s wetlands
80% of SA’s rivers
- Eating such a small range of foods does not provide sufficient have already been lost
are compromised in quality
and quantity
nutrients, as the range of type of vitamins and minerals is limited
and hence our health is effected 80% OF SA’S LAND IS FARMLAND
- Relying on such a small number of plants and animals for food is
linked to a decline in diversity of plants and animals in nature. This
10% OF SA’S LAND GENERATES
50% OF ALL AVAILABLE SURFACE WATER
is a result of the damage to the natural ecosystem. NATURE IS THE FOUNDATION OF OUR FOOD SYSTEMS
• In South Africa, where 80% of the land is suitable for livestock farming, 1/3
overgrazing on erosion prone soils has led to widespread land OF ALL
FOOD IS 44% WASTED
OF
FOOD IS FRUIT
degradation, dramatically reducing carbon storage in soils. WASTED
& VEGETABLES 62%
The embedded energy, water, nutrients OF WATER IN SA IS
and human labour are lost with this food too USED FOR IRRIGATION
Agri-food Systems: Facts and Futures | Page 17
Source: WWFWe need a
Great Food Transformation
“The food we eat and how we produce it will determine
the health of people and planet, and major changes
must be made to avoid both reduced life expectancy
and continued environmental degradation.” Source: EAT-Lancet Commission
That’s why Knorr is Reinventing Food for Humanity
with 3 key thrusts
Champion Champion Champion
dietary diversity more plant based sustainable ways
diets to grow and
produce foodYou can also read