Development of a solventless stir bar sorptive extraction/ thermal desorption large volume injection capillary gas chromatographic-mass ...
←
→
Page content transcription
If your browser does not render page correctly, please read the page content below
Open Chemistry 2020; 18: 1339–1348
Research Article
Mona Sargazi, Mark Bücking*, Massoud Kaykhaii
Development of a solventless stir bar sorptive extraction/
thermal desorption large volume injection capillary gas
chromatographic-mass spectrometric method for ultra-trace
determination of pyrethroids pesticides in river and tap water
samples
https://doi.org/10.1515/chem-2020-0176 limits are thousands of times lower than that of the stan-
received June 16, 2020; accepted September 9, 2020 dard method of liquid–liquid extraction. Reproducibility of
Abstract: Stir bar sorptive extraction (SBSE) has been the method, based on the relative standard deviation, was
developed in 1999 to efficiently extract and preconcen- better than 7.5% and recoveries for spiked tap and river
trate volatile compounds, and many applications have water samples was within the range of 87.83–114.45%. The
been found after that. This technique conforms to the application of PDMS-coated SBSE coupled with CGC-MS
principles of green chemistry. Here, we used an autosam- equipped with a large volume injector thermal desorption
pler with an online thermal desorption unit connected to unit can be used for ultra-trace analysis of environmental
CGC-MS to analyze pesticides. This study describes the water samples. Solventless SBSE offers several advantages
development of a highly sensitive extraction method over conventional traditional liquid–liquid extraction such
based on SBSE for simultaneous determination of ultra-trace as being very fast and economical and provides better ex-
amounts of four pesticides λ-cyhalothrin, α-cypermethrin, traction without requiring any solvents; so it can be con-
tefluthrin, and dimefluthrin in environmental water sam- sidered as a green method for the analysis of pesticides.
ples. This method was compared to the standard liquid– Keywords: pesticides, stir bar sorptive extraction, thermal
liquid extraction. In this study, a totally solventless SBSE desorption, simultaneous determination, capillary gas
was applied to river and tap water samples for the chromatography-mass spectrometry, water analysis
extraction and preconcentration of four pesticides.
PDMS-coated SBSEs of 10 mm × 1 mm thickness were
used for this purpose, and SBSEs were directly placed
into a large-volume injector of a CGC-MS for thermal des- 1 Introduction
orption of the analytes. In all extractions, deltamethrin
was used as an internal standard. This method showed Sample preparation is one of the most important steps in
linearity in the range of 1.0–200.0 ng L−1 for cyhalothrin, the chemical analysis. Especially, it is of most importance
tefluthrin, and dimefluthrin and 10.0–800 ng L−1 for cy- at trace level analysis, which needs not only preconcen-
permethrin. Preconcentration factors of 179, 7, 162, and tration of the analytes but also a cleanup step to elimi-
166 were obtained with very low limits of detection of 0.32, nate interferences [1]. Sample preparation by traditional
3.41, 0.36m and 0.69 ng L−1 for cyhalothrin, cypermethrin, extractions such as Soxhlet and liquid–liquid extraction
tefluthrinm and dimefluthrin, respectively. These detection (LLE) are tedious, time consuming, and need large
amounts of toxic organic solvents. Hence, innovative ap-
proaches are being investigated to find extraction techni-
ques with higher efficiency, less chemicals consumption,
* Corresponding author: Mark Bücking, Fraunhofer Institute for
Molecular Biology and Applied Ecology IME, Auf dem Aberg 1, 57392 less extraction time, and being more environmentally
Schmallenberg-Grafschaft, Germany, e-mail: Mark.Buecking@ime. friendly and safer, among others [2]. Most of these tech-
fraunhofer.de, tel: +49 (0) 2972 302-304 niques are based on the miniaturization of traditional
Mona Sargazi: Department of Chemistry, Faculty of Sciences, methods, so they are called microextraction techniques
University of Sistan and Baluchestan, Zahedan 98135-674, Iran
(MEs). In all MEs, the volume of the extracting phase is
Massoud Kaykhaii: Department of Chemistry, Faculty of Sciences,
University of Sistan and Baluchestan, Zahedan 98135-674, Iran,
considerably reduced in comparison with the sample vo-
e-mail: kaykhaii@chem.usb.ac.ir, tel: +98(54)33446413; lume; as a result, extraction takes place based on estab-
fax: +98(54)33431067 lishing equilibrium of analytes between adsorbents or
Open Access. © 2020 Mona Sargazi et al., published by De Gruyter. This work is licensed under the Creative Commons Attribution 4.0
International License.1340 Mona Sargazi et al. sorbents and target sample, rather than exhaustive [18], air-assisted liquid–liquid microextraction [19], micro- extraction. Liquid-phase microextraction, solid-phase wave-assisted dispersive liquid–liquid microextraction [20] microextraction (SPME), and stir bar sorptive extraction and salt and pH-induced solidified floating organic droplets (SBSE) are the most used sorbent-based methods of MEs. homogeneous liquid–liquid microextraction [21]. However, These techniques benefit from low sample requirement, except SPME, these techniques are not entirely solvent free automation of devices, and high speed [3]. SPME and and have multistep procedures. On the other hand, SPME SBSE are similar in extraction principle; however, SBSE fibers generally suffer from drawbacks such as relatively has higher capacity due to more amount of sorbent high cost, fragility, a low limited selectivity, and swelling of phase, and hence, it is more sensitive, more robust, and the coatings in chlorinated solvents [22]. can be applied to ultra-trace detection of inorganic com- λ-Cyhalothrin, α-cypermethrin, tefluthrin, and dime- pounds as well as organics in various real matrices. For fluthrin are classified as pyrethroids, which are mainly liquid samples, it also needs no pervious sample prepara- used to control the population of insects. They are syn- tion neither a solvent with the ability of extraction of sev- thetic pyrethrins with high hydrophobicity and high oc- eral analytes simultaneously in a single step [4,5]. Due to tanol–water partition coefficients. The solubility of λ-cy- these advantages, SBSE have wide applications in many halothrin, α-cypermethrin, tefluthrin, and dimefluthrin areas such as food, flavor, environmental, life, and biome- in water are 0.8, 4.0, 20.0 and 2,000 µg L−1 respectively. dical sciences for the analysis of variety of analytes [6]. Because of high toxicity of pyrethroids for fishes, bees After extraction, SBSE can be introduced directly into the and soil microorganisms, monitoring of them in the en- analytical system equipped with a thermal desorption (TD) vironment even at very low concentrations (
Development of a solventless stir bar sorptive extraction/thermal desorption 1341
Table 1: Octanol–water partition coefficients, retention times, and selected SIM ions for pesticides studied
Analyte Sigma-Aldrich Cat. No. log ko/w (ref) Retention time (min) SIM ions
λ-Cyhalothrin 91465086 6.85 [26] 7.64 204.5/240.5
α-Cypermethrin 67375308 6.38 [26] 8.22 206.4/208.4
Tefluthrin 79538322 6.40 [31] 5.80 204.5/240.5
Dimefluthrin 271241146 5.40 [25] 6.44 167.6/166.6
Deltamethrin* 52918635 6.18 [26] 8.83 78.8/296.6
*
Internal standard.
same company. 5 mg L−1 stock solution of each pesticide mode are listed in Table 1. The dwell time was 50 ms.
was prepared in acetone and stored in a refrigerator at Data acquisition, instrument control, and data analysis
4°C. A mixed standard containing 0.05 mg mL−1 of all were performed by Agilent mass hunter quantitative ana-
pesticides was also prepared in acetone for simulta- lysis software.
neous measurements.
2.3 SBSE extraction procedure
2.2 Instrumentation
Twister stir bars were preconditioned before use by heating
An Agilent 7890A gas chromatograph with 7000C triple them in TDU at 300°C for 30 minutes with a helium stream
quadrupole MS (Agilent technologies, Walsbronn, of 100 mL min−1. Water sample or standard was poured in a
Germany) was employed for performing chromatographic glass vial containing 20 mL of water adjusted at pH 7. The
analysis and mass detection. The system was equipped stir bar was placed in vial, and the extraction was per-
with a commercial TDU, which was connected to a large formed for 180 min with a stirring speed of 700 rpm at
volume injector, model CIS-4 injector (GERSTEL). The 40°C. In all extractions, deltamethrin was used as an in-
TDU unit was equipped with a GERSTEL MPS auto-sam- ternal standard. After extraction, the stir bars were taken
pler, which can sequentially introduce 98 samples into out of the vials, washed with deionized water, and dried
the TDU. The glass tubes containing the stir bars were under nitrogen stream for 1 min. The stir bars were then put
placed in a tray that was assembled in MPS. Stir bars into autosampler tubes and sealed and then were placed
coated with 0.5 mm (10 mm × 0.5 mm thickness) and into the autosampler tray for CGC/MS analysis.
1 mm (10 mm × 1 mm thickness) PDMS were also pur- Ethical approval: The conducted research is not related
chased from GERSTEL. River water was taken from a local to either human or animal use.
river in Schmallenberg (Germany). Splitless thermal des-
orption was performed by TDU programming from 30°C
(0.25 min) to 250°C (10 min) at a rate of 360°C min−1 with
a helium flow rate of 1.2 mL min−1. The analytes were 3 Results and discussion
cryo-focused in a cooled injection system (CIS-4) inlet at
−50°C using liquid nitrogen. Splitless injection was then
3.1 Optimization of extraction conditions
performed by ramping the CIS-4 from −50°C (0.1 min) to
250°C (5 min) at a rate of 12°C min−1. Chromatographic ana-
lysis was performed on a DB-5MS ultra inert capillary In the SBSE (PDMS) theory [5], the extraction efficiency of
column of 30 m × 0.25 mm I.D. and a phase thickness of an analyte is related to the partitioning between the PDMS
0.25 µm (Agilent technologies). GC oven was programmed phase of the stir bar and the water sample, which shows a
from 100°C (2 min) to 320°C (3.5 min) at a rate of 40°C min−1. performance close to the octanol–water partition coeffi-
The transfer line, ion source, and mass analyzer tempera- cients distribution during static equilibrium. Therefore,
tures were set at 280, 150, and 150°C, respectively, with the to achieve the best efficiency of SBSE extraction, para-
solvent delay of 5 min. Negative chemical ionization (NCI) meters that could have an effect on the partitioning of
mass spectra were recorded with an ionization current of sample between water and PDMS extracting phase were
34.6 µA. Two characteristic ions of each compound, target studied and optimized, including extraction time, stirring
and qualifier ions, in the selected ion monitoring (SIM) speed, sample volume, extraction temperature, ionic1342 Mona Sargazi et al.
strength of sample solution, and pH value. Twenty milli- 95 Cyhalothrin
liters of freshly prepared individual solution of 100 ng L−1 90
Cypermethrin
Tefluthrin
Extracon recovery (%)
Dimefluthrin
of each pesticide were used for all optimization. Initial 85
80
tests showed that the signal of a Twister with a coating
75
layer of 1 mm is about two times higher than that of 70
0.5 mm thickness; so, for all experiments, a Twister with 65
1 mm thickness was employed. 60
55
50
400 500 600 700 750
3.1.1 Effect of extraction time Srring speed (rpm)
Extraction with SBSE can be regarded as an equilibrium Figure 2: Effect of stirring speed on the extraction efficiency (ex-
process rather than exhaustive. In most SBSE applica- traction conditions: 100 µL of 100 ng L−1 of each analyte; extraction
time: 180 min; sample volume: 20 mL; temperature: 40°C; pH: 7).
tions, the efficiency of extraction increases with the ex-
traction time [32]. The extraction of the target analytes
into SBSE was carried out in a range of time between 60 reaches to its equilibrium, further increase in the stirring
and 180 min. It was observed that the peak areas of all speed has no effect on the amount of the analytes uptake,
compounds were increased up to 120 min sharply and to and so the signal will remain constant; however, to be sure
175 min, and this increase is not rapid and then achieved of reaching a maximum extraction recovery, 700 rpm was
an equilibrium state. Longer contact times had no effect selected as the best stirring speed (Figure 2). Increasing the
on improving extraction efficiency. To be sure of giving stirring speed even further can be considered since no ad-
enough time to the system to reach equilibrium in various ditional costs or time is required.
media (such as viscous or very dilute samples), 180 min
was chosen as extraction time for all pesticides (Figure 1).
3.1.3 Effect of sample volume
3.1.2 Effect of stirring speed Sample volumes tested in this work were 10, 20, 40, and
60 mL. The total amount of each target compound was
Increasing the stirring rate has a positive effect on the 100 ng L−1. According to the data in Figure 3, increasing
amount of extraction because equilibrium will be reached the sample volume causes increasing chromatographic
faster at a higher stirring speed. Consequently, at a preset peak areas for all pesticides up to a certain volume and
time, increasing the speed will result in extraction incre- then decreases. For cyhalothrin’s curve, this volume is
ment [33]. The experimental results showed that the extrac- 40 mL, and for three other compounds, this maximum
tion efficiency increases by increasing the stirring rate up to was observed at 20 mL. Since signal improvement for cy-
600–700 rpm and then stays constant. After extraction halothrin volume from 20 to 40 mL is only about 6.5%,
100 100 Cyhalothrin
Cyhalothrin
Cypermethrin 95 Cypermethrin
90
Tefluthrin
Extracon recovery (%)
Tefluthrin 90
Extracon recovery (%)
80 Dimefluthrin Dimefluthrin
85
70 80
75
60
70
50 65
40 60
55
30 50
60 90 120 175 180 10 20 40 60
Extracon me (min) Sample volume (mL)
Figure 1: Effect of time on the efficiency of extraction (extraction Figure 3: Effect of sample volume on the efficiency of extraction (ex-
conditions: 100 µL of 100 ng L−1 of each analyte; stirring speed: traction conditions: 100 µL of 100 ng L−1 of each analyte; extraction
700 rpm; sample volume: 20 mL; temperature: 40°C; pH: 7). time: 180 min; stirring speed: 700 rpm; temperature: 40°C; pH: 7).Development of a solventless stir bar sorptive extraction/thermal desorption 1343
20 mL sample volume was chosen for further experiments. 100 Cyhalothrin
As can be observed, changing the volume of sample has no 90 Cypermethrin
Tefluthrin
80
significant effect on the extraction recovery. This can be con-
Extracon recovery (%)
Dimefluthrin
70
sidered as a positive aspect of this method because one can 60
start eventually with a different sample volume and still is not 50
far from the optimum point. 40
30
20
10
3.1.4 Effect of temperature 0
0 0.1 0.2 0.3 0.4
Amount of NaCl (g.mL-1)
Effect of the temperature on extraction efficiency of the
analytes were also studied, and it was found that the area
Figure 5: Effect of ionic strength on the efficiency of extraction (ex-
of chromatographic peaks was increased with an increase
traction conditions: 100 µL of 100 ng L−1 of each analyte; extraction
in temperature up to 40°C and decreases after then
time: 180 min; stirring speed: 700 rpm; sample volume: 20 mL;
(Figure 4). This is because increasing the temperature temperature: 40°C; pH: 7).
increases the mobility of molecules of samples, so they
can adsorb on the stir bar faster during a preset time.
Temperatures higher than 40°C result in even more mo- efficiency. Since our desired analytes have high octanol–
bility of molecules of the analytes, which prevents them water partitioning coefficient, adding sodium chloride
to absorb properly on Twister’s coating. and increasing the ionic strength cannot affect recovery.
Hence, further experiments were performed in the ab-
sence of sodium chloride [34].
3.1.5 Effect of ionic strength
Salting-out effect is in wide use in liquid–liquid extrac- 3.1.6 Effect of pH
tion because it lowers the solubility of the analytes in the
aqueous phase; so, more analytes can be entered into the The effect of sample pH on the extraction efficiency of four
extracting phase. Here, the influence of this parameter pesticides was also investigated. Dropwise addition of either
was studied with the addition of different amounts of 0.1 M HCl or 0.1 M NaOH was used for pH adjustment be-
sodium chloride, ranging from 0.0 to 0.4 g mL−1, on the tween 2.0 and 9.0. The highest extraction for cyhalothrin,
under-experiment solutions. Figure 5 shows that salt ad- tefluthrin, and dimefluthrin was observed at pH of 6,
dition decreases the peak area because of increasing the whereas for cypermethrin, this point was achieved at pH 8
viscosity of solution that leads to a decrease in the speed (Figure 6). This can be described according to the molecular
of stir bar rotation. Also there is a strong correlation be-
tween octanol–water partitioning coefficient and SBSE
100
Cypermethrin
90 Cyhalothrin
100 Cyhalothrin Tefluthrin
Extracon recovery (%)
95 Cypermethrin 80
Dimefluthrin
90 Tefluthrin
Extracon recovery (%)
70
Dimefluthrin
85
60
80
75 50
70
40
65
60 30
55 20
50 2 3 4 5 6 7 8 9
25 °C 40 °C 60 °C pH
Temperature (°C)
Figure 6: Effect of pH of solution on the efficiency of extraction
Figure 4: Effect of temperature on the efficiency of extraction (ex- (extraction conditions: 100 µL of 100 ng L−1 of each analyte; extrac-
traction conditions: 100 µL of 100 ng L−1 of each analyte; extraction tion time: 180 min; stirring speed: 700 rpm; sample volume: 20 mL;
time: 180 min; stirring speed: 700 rpm; sample volume: 20 mL; pH: 7). temperature: 40°C; pH: 7).1344 Mona Sargazi et al.
structure of target pesticides. The presence of halogens in [36]. In the subsequent studies, pH of solutions was adjusted
organic molecules causes molecule to have a lower pKa [35] to 7.0, in which extraction of all analytes are close to their
and analytes with pKa values more than 4.5, showing an maximum value. Moreover, by working at this pH, there is
increase in extraction efficiencies with a decrease in pH no need for pH adjustment.
Table 2: Analytical figures of merit for determination of four target pesticides by SBSE-TD-CGC-MS and LLE and comparison with other
methods proposed for their analysis in water samples
Analytical feature Extraction technique
g
SPME SPE UA-DLLME SALLEh SBSE-TD-CGC-MS LLE
Cyhalothrin
Linear range 2.5–1,500 µg L−1 NM NM NM 1–200 ng L−1 10–6,000 µg L−1
R2a 0.9984 0.9992 0.9989 0.9996 0.998 0.9997
LODb 0.3 µg L−1 3.00 µg L−1 0.30 µg L−1 1.70 µg L−1 0.32 ng L−1 0.64 µg L−1
LOQc 0. 7 µg L−1 NM 1.00 µg L−1 5.00 µg L−1 1.07 ng L−1 7.48 µg L−1
RSD,d % 7.80 4.00 8.00 11.00 7.49 1.23
Enrichment factore NMf NM NM NM 179 2
Detecting instrument HPLC/FD GC/MS LC/MS LC/MS CGC/MS CGC/MS
Extraction technique SPME SPE DLLME SALLE SBSE LLE
Reference [38] [39] [41] [41] This work This work
Cypermethrin
Linear range 20–2,000 µg L−1 NM NM NM 10–800 ng L−1 10–6,000 µg L−1
R2 0.998 0.997 0.9990 0.9932 0.998 0.9973
LOD NM 4.00 µg L−1 0.800 µg L−1 4.00 µg kg−1 3.41 ng L−1 3.63 µg L−1
LOQ 13.3 µg L−1 NM 2.50 µg L−1 12.50 µg L−1 11.39 ng L−1 12.10 µg L−1
RSD, % 11.3 9.40 8.00 12.00 4.44 2.87
Enrichment factor NM NM NM NM 7 2
Detecting instrument GC/MS GC/MS LC/MS LC/MS CGC/MS CGC/MS
Extraction technique DI-SPME SPE DLLME SALLE SBSE LLE
Reference [40] [38] [41] [41] This work This work
Tefluthrin
Linear range NM NM NM NM 1–200 ng L−1 30–5,000 µg L−1
R2 NM NM 0.9986 0.9988 0.9989
LOD NM NM 1.70 µg kg−1 8.00 µg kg−1 0.36 ng L−1 4.67 µg L−1
LOQ NM NM 5.00 µg kg−1 25.00 µg kg−1 1.22 ng L−1 15.57 µg L−1
RSD, % NM NM 13.00 16.00 6.95 6.10
Enrichment factor NM NM NM NM 162 2
Detecting instrument NM NM LC/MS LC/MS CGC/MS CGC/MS
Extraction technique NM NM DLLME SALLE SBSE LLE
Reference NM NM [41] [41] This work This work
Dimefluthrin
Linear range NM NM NM NM 1–200 ng L−1 30–5000 µg L−1
R2 NM NM NM NM 0.9992 0.9997
LOD NM NM NM NM 0.69 ng L−1 5.11 µg L−1
LOQ NM NM NM NM 2.31 ng L−1 17.03 µg L−1
RSD, % NM NM NM NM 7.20 4.32
Enrichment factor NM NM NM NM 166 6
Detecting instrument NM NM NM NM CGC/MS CGC/MS
Extraction technique NM NM NM NM SBSE LLE
Reference NM NM NM NM This work This work
a
R2, coefficient of determination. b LOD, was based on 3Sb/m criterion for 10 blank measurements. c LOQ, was based on 10Sb/m criterion for
10 blank measurements. d RSD, relative standard deviation, for 3 replicate measurements. e Enrichment factors were obtained by dividing
the concentrations equivalent to the peak area of the analytes after extraction to the concentration of them without extraction, which
generates the same peak height when 1.0 µL of the sample was injected. Thereby, it was possible to compare the enrichment of the
developed procedure with the output of normal CGC/MS injection [37]. f Not mentioned. g Ultrasound-assisted dispersive liquid–liquid
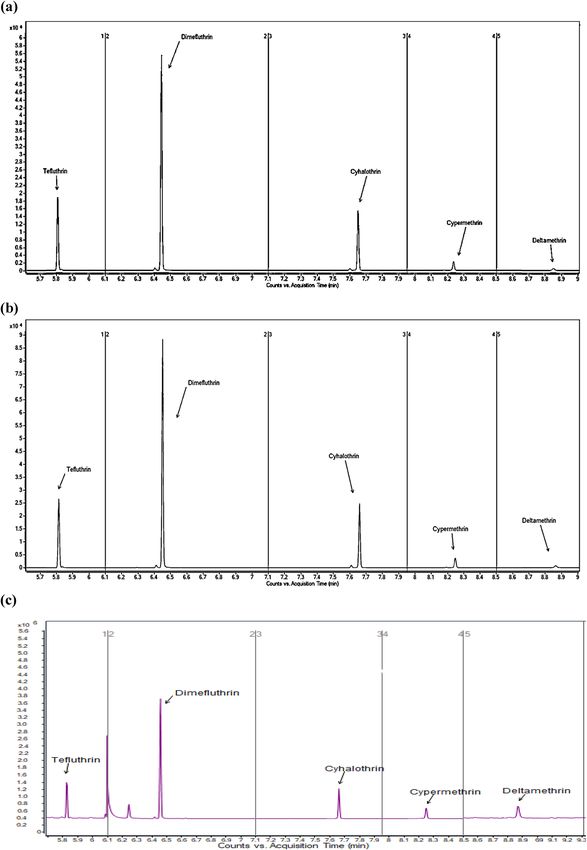
microextraction. h Salting-out assisted liquid–liquid extraction.Development of a solventless stir bar sorptive extraction/thermal desorption 1345 Figure 7: Chromatograms of spiked river water sample obtained by (a) direct injection, (b) LLE, and (c) SBSE.
1346 Mona Sargazi et al.
3.2 Analytical performance of SBSE-TD- method has the highest preconcentration and sensitivity
CGC/MS among similar MEs.
Under the optimum conditions, linear range, coefficient
of determination (R2), limit of detection (LOD), limit of
quantification (LOQ), and repeatability (expressed as re- 3.3 Analysis of real water samples
lative standard deviation percent, RSD%) of the sug-
gested stir bar sorptive extraction-thermal desorption- The proposed method was applied for extraction and de-
gas chromatography-mass spectrometry (SBSE-TD-CGC- termination of cyhalothrin, cypermethrin, tefluthrin, and
MS) method were obtained and summarized in Table 2. dimefluthrin in river and tap water samples. No pesti-
This table also comprises a comparison of the suggested cides were detected in samples; therefore, to validate
method with the previously published articles for the the method’s accuracy, water samples were spiked with
analysis of water samples using ME procedures. No data these pesticides at three concentration levels. Figure 7
were found for the analysis of tefluthrin and dimefluthrin depicts example chromatograms of spiked river water
using SPME or solid-phase extraction (SPE). The developed sample obtained by direct injection, liquid–liquid
Table 3: Results for the analysis of cyhalothrin, cypermethrin, tefluthrin, and dimefluthrin in spiked real samples with SBSE-TD-CGC-MS
and LLE.
River water
SBSE-TD-CGC-MS LLE
Insecticide Added (ng L−1) Recovery (%) RSD% (n = 3) Added (µg L−1) Recovery (%) RSD% (n = 3)
Cyhalothrin 2.5 110.41 7.49 500 94.65 0.87
25 94.68 3.95 1,000 96.16 0.46
200 97.58 1.29 4,000 99.02 0.3
Cypermethrin 25 87.83 2.49 500 99.29 2.55
100 114.78 4.16 1,000 99.09 0.63
400 100.35 2.77 4,000 103.89 0.44
Tefluthrin 2.5 102.50 1.78 30 102.37 0.79
25 112.30 1.41 300 99.28 6.10
200 99.63 4.58 3,000 93.11 5.30
Dimefluthrin 2.5 109.35 7.20 30 93.23 3.90
25 114.09 5.97 300 93.57 4.17
200 107.31 5.47 3,000 95.68 3.73
Tap water
SBSE-TD-CGC-MS LLE
Added (ng L−1) Recovery (%) RSD% (n = 3) Added (µg L−1) Recovery (%) RSD% (n = 3)
Cyhalothrin 2.5 89.16 6.07 500 96.43 1.23
25 104.44 7.26 1,000 102.52 0.93
200 114.45 2.21 4,000 98.23 1.16
Cypermethrin 25 110.52 0.55 500 101.34 2.87
100 113.37 2.47 1,000 105.65 0.94
400 95.43 4.44 4,000 97.16 1.62
Tefluthrin 2.5 112.75 1.66 30 97.24 3.13
25 109.64 6.95 300 99.51 2.76
200 106.29 6.78 3,000 98.45 1.25
Dimefluthrin 2.5 106.93 1.94 30 95.76 2.43
25 109.33 5.24 300 99.43 4.32
200 112.11 5.95 3,000 98.12 2.61Development of a solventless stir bar sorptive extraction/thermal desorption 1347
extraction (LLE), and SBSE-TD-CGC/MS. The trueness of [2] Kaykhaii M, Noorinejd S. Salt saturated single drop microex-
the method was evaluated by analyzing the same sam- traction of gold from water samples and its determination by
ples using the standard LLE method. Results are summar- graphite furnace atomic absorption spectrometry. J Anal At
Spectrom. 2014;29(5):875–9.
ized in Table 3. F-test and paired t-test at 95% confidence
[3] Augusto F, Carasek E, Gomes Costa Silva R, Regina Rivellino S,
level showed no difference between LLE and our sug- Domingues Batista A, Martendal E. New sorbents for extraction
gested method. and microextraction techniques. J Chromatogr A.
2010;1217:2533–42.
[4] Hashemi SH, Kaykhaii M, Jamali-Kaykha A, Sajjadi Z,
Mirmoghaddam M. Application of response surface metho-
dology for silver nano-particle stir bar sorptive extraction of
4 Conclusion heavy metals from drinking water samples: A Box-Behnken
design. Analyst. 2019;144:3525–32.
A solventless stir bar sorptive extraction-thermal deso- [5] Nogueira JMF. Stir-bar sorptive extraction: 15 years making
rption large volume injection coupled to capillary gas sample preparation more environment-friendly. Trend Anal
Chem. 2015;71:214–23.
chromatography-mass spectrometry (SBSE-TD-CGC/MS)
[6] Prieto A, Basauri O, Rodil R, Usobiaga A, Fernández LA,
was developed to determine ultra-trace amounts of λ-cy-
Etxebarria N, et al. Stir-bar sorptive extraction: A view on
halothrin, α-cypermethrin, tefluthrin, and dimefluthrin method optimisation, novel applications, limitations and po-
in river and tap water samples. Our proposed method tential solutions. J Chromatogr A. 2010;1217:2642–66.
showed high sensitivity, good repeatability, and linearity [7] Ochiai N, Sasamoto K, David F, Sandra P. Solvent-assisted stir
besides easy operation and being solvent free. In compar- bar sorptive extraction by using swollen poly dimethyl si-
loxane for enhanced recovery of polar solutes in aqueous
ison to liquid–liquid extraction, in which a large amount
samples: Application to aroma compounds in beer and pesti-
of poisonous solvents must be used, stir bar sorptive ex- cides in wine. J Chromatogr A. 2016;1455:45–6.
traction provides better extraction without requiring any [8] Nakamura S, Daishima Sh. Simultaneous determination of 64
solvents. So, it can be considered as a green method for pesticides in river water by stir bar sorptive extraction and
the analysis of these pesticides. Using the most advanced thermal desorption-gas chromatography-mass spectrometry.
instruments in the market enabled us to achieve lower Anal Bioanal Chem. 2005;382:99–107.
[9] Sanchez-Rojas F, Bosch-Ojeda C, Cano-Pavon JM. A review of
LODs and LOQs in comparison to the similar researches
stir bar sorptive extraction. Chromatographia.
previously performed on the same analytes with SBSE. 2009;69:79–94.
Results also indicated better stability of both the instru- [10] Margoum C, Guillemain C, Yang X, Coquery M. Stir bar sorptive
ment and the extraction system with good repeatability. extraction coupled to liquid chromatography-tandem mass
The method was compared with other methods of deter- spectrometry for the determination of pesticides in water
samples: method validation and measurement uncertainty.
mining the same pesticides, which showed that SBSE-TD-
Talanta. 2013;116:1–7.
CGC/MS has higher sensitivity than others. However, the [11] Hashemi H, Khajeh M, Kaykhaii M. Molecularly imprinted stir
main disadvantage of the developed method is its bar sorptive extraction coupled with atomic absorption spec-
slowness in extraction, which makes this method trometry for trace analysis of copper in drinking water sam-
time consuming. ples. Anal Methods. 2013;5(11):2778–83.
[12] Reyes-Garcés N, Gionfriddo E, Gómez-Ríos GA, Alam MN,
Boyacı E, Bojko B, et al. Advances in Solid Phase
Acknowledgements: Mona Sargazi thanks for her fellow-
Microextraction and Perspective on Future Directions. Anal
ship from the Iranian Ministry of Science, Research and Chem. 2018;90:302–60.
Technology. [13] Boyd-Boland A, Magdic S, Pawliszyn JB. Simultaneous deter-
mination of 60 pesticides in water using solid-phase microext
Conflict of interest: The authors declare no conflict of ract ion and gas chromatography-mass spectrometry. Analyst.
1996;121:929–38.
interest.
[14] Székács A, Mörtl M, Darvas B. Monitoring pesticide residues in
surface and ground water in hungary: surveys in 1990–2015.
J Chem. 2015;2015:1–15.
[15] Mohammad I, Sayed M, Khan HM, Cooper WJ. Analysis of
pesticides in water samples and removal of monocrotophos by
References γ-irradiation. Anal Bioanal Tech. 2014;5:1–10.
[16] Hamilton DJ, Ambrus A, Dieterle RM, Felsot AS, Harris CA,
[1] Hashemi SH, Kaykhaii M, Khajeh M. Molecularly imprinted Katayama A, et al. Regulatory limits for pesticide residues in
polymers for stir bar sorptive extraction: Synthesis, charac- water (IUPAC Technical Report). Pure Appl Chem.
terization and application. Anal Lett. 2015;48(12):1815–29. 2003;75:1123–55.1348 Mona Sargazi et al.
[17] Jabali Y, Millet M, El-Hozb M. Optimization of a DI-SPME-GC- [29] Huang YW, Lee HK, Shih HK, Jen JF. A sublimate sorbent for stir-
MS/MS method for multi-residue analysis of pesticides in bar sorptive extraction of aqueousendocrine disruptor pesti-
waters. Microchem J. 2019;147:83–92. cides for gas chromatography-electron capture detection.
[18] Jouyban A, Farajzadeh MA, Afshar Mogaddam MR. In matrix J Chromatogr A. 2018;1564:51–8.
formation of deep eutectic solvent used in liquid phase ex- [30] Ochiai N, Sasamoto K, Kanda H, Yamagami T. Optimization of a
traction coupled with solidification of organic droplets dis- multi-residue screening method for the determination of 85
persive liquid-liquid microextraction; application in determi- pesticides in selected food matrices by stir bar sorptive ex-
nation of some pesticides in milk samples. Talanta. traction and thermal desorption GC-MS. J Sep Sci.
2020;206:120169. 2005;28:1083–92.
[19] Farajzadeh MA, Feriduni B, Afshar Mogaddam MR. [31] Cunha SC, Fernandes JO. Multipesticide residue analysis in
Determination of triazole pesticide residues in edible oils maize combining acetonitrile-based extraction with dispersive
using air‐assisted liquid–liquid microextraction followed by liquid–liquid microextraction followed by gas chromatography-
gas chromatography with flame ionization detection. J Sep Sci. mass spectrometry. J Chromatogr A. 2011;1218:7748–57.
2015;38(6):1002–9. [32] Hashemi SH, Kaykhaii M, Tabehzar F. Molecularly imprinted
[20] Farajzadeh MA, Hessamaddin Sohrabi H, Mohebbi A, Afshar stir bar sorptive extraction coupled with high performance
Mogaddam MR. Combination of a modified quick, easy, cheap, liquid chromatography for trace analysis of naphthalene sul-
efficient, rugged, and safe extraction method with a deep eu- fonates in seawater. J Iran Chem Soc. 2016;13:733–41.
tectic solvent based microwave‐assisted dispersive liquid–li- [33] Hashemi SH, Kaykhaii M, Tabehzar F. Spectrophotometric
quid microextraction: Application in extraction and precon- determination of four naphthalene sulfonates in seawater
centration of multiclass pesticide residues in tomato samples. after their molecularly imprinted stir bar sorptive extraction.
J Sep Sci. 2019;42(6):1273–80. J Chil Chem Soc. 2018;63:4057–63.
[21] Torbati M, Farajzadeh MA, Torbati M, Alizadeh Nabil AA, [34] Serodio P, Nogueira JMF. Multi-residue screening of endocrine
Mohebbi A, Afshar Mogaddam MR. Development of salt and disrupters chemicals in water samples by stir bar sorptive
pH-induced solidified floating organic droplets homogeneous extraction-liquid desorption-capillary gas chromatography–
liquid-liquid microextraction for extraction of ten pyrethroid mass spectrometry detection. Anal Chim Acta.
insecticides in fresh fruits and fruit juices followed by gas 2004;517:21–32.
chromatography-mass spectrometry. Talanta. [35] Pereira VJ, da Cunha JPAR, de Morais TP, Ribeiro-Oliveira JP, de
2018;176:565–72. Morais JB. Physical-chemical properties of pestisides con-
[22] Diwan A, Singh B, Roychowdhury T, Yan D, Tedone L, cepts, applications, and interactions with the environment.
Nesterenko P, et al. Porous, high capacity Coatings for Solid Biosience. 2016;32:627–41.
Phase Microextraction by Sputtering. Anal Chem. [36] Aparicio I, Martín J, Santos JL, Malvar JL, Alonso E. Stir bar
2016;88(3):1593–600. sorptive extraction and liquid chromatography–tandem
[23] Oudou HC, Hansen HCB. Sorption of lambda-cyhalothrin, massspectrometry determination of polar and non-polar
cypermethrin, deltamethrin and fenvalerate to quartz, cor- emerging and priority pollutants in environmental waters.
undum, kaolinite and montmorillonite. Chemosphere. J Chromatogr A. 2017;1500:43–52.
2002;49:1285–94. [37] Kaykhaii M, Dicinoski GW, Smedley R, Pawliszyn J, Haddad PR.
[24] Zhou JL, Rowland SJ, Fauzi R, Mantoura C, Lane MCG. Preparation and evaluation of solid-phase microextraction fi-
Desorption of tefluthrin insecticide from soil in simulated bres based on functionalized latex nanoparticle coatings for
rainfall runoff systems-kinetic studies and modelling. Water trace analysis of inorganic anions. J Chromatogr A.
Res. 1997;31:75–84. 2010;1217:3452–56.
[25] Pesticides properties database. Environmental fate: [38] Vazquez PP, Mughari AR, Galera MM. Solid-phase microex-
Ecotoxicology and Human health. sitem.herts.ac.uk/aeru/ traction (SPME) for the determination of pyrethroids in cu-
ppdb/en/Reports/3069.htm, accessed June 01, 2018. cumber and watermelon using liquid chromatography com-
[26] Hoeck EV, David F, Sandra P. Stir bar sorptive extraction for the bined with post-column photochemically induced fluorimetry
determination of pyrethroids in water samples a comparison derivatization and fluorescence detection. Anal Chim Acta.
between thermal desorption in a dedicated thermal desorber, 2008;607:74–82.
in a split/splitless inlet and by liquid desorption. J Chromatogr [39] Esteve-Turrillas FA, Pastor A, de la Guardia M. Determination of
A. 2007;1157:1–9. pyrethroid insecticide residues in vegetable oils by using
[27] Serodio P, Nogueiro JMF. Development of a stir bar sorptive combined solid-phases extraction and tandem mass spectro-
extraction-liquid desorption-large volume injection capillary metry detection. Anal Chim Acta. 2005;553:50–7.
gas chromatographic mass spectrometric method for pyre- [40] Zhang L, Gionfriddo E, Acquaro Jr V, Pawliszyn J. Direct im-
throid pesticides in water samples. Anal Bioanal Chem. mersion solid-phase microextraction analysis of multi-class
2005;382:1141–51. contaminants in edible seaweeds by gas chromatography-
[28] Barriada-Pereira M, Serôdio P, González-Castro MJ, mass spectrometry. Anal Chim Acta. 2018;1031:83–97.
Nogueira JMF. Determination of organochlorine pesticides in [41] Petrarca MH, Ccanccapa-Cartagena A, Masia A, Godoy HT,
vegetable matrices by stir bar sorptive extraction with liquid Pico Y. Comparison of green sample preparation techniques in
desorption and large volume injection-gas chromatography- the analysis of pyrethrins and pyrethroids in baby food by
mass spectrometry towards compliance with European Union liquid chromatography–tandem mass spectrometry.
directives. J Chromatogr A. 2010;1217:119–26. J Chromatogr A. 2017;1497:28–37.You can also read