Big Bear Municipal Water District 2018 - Lake Operations Summary
←
→
Page content transcription
If your browser does not render page correctly, please read the page content below
Big Bear Municipal Water District
      Lake Operations Summary

              2018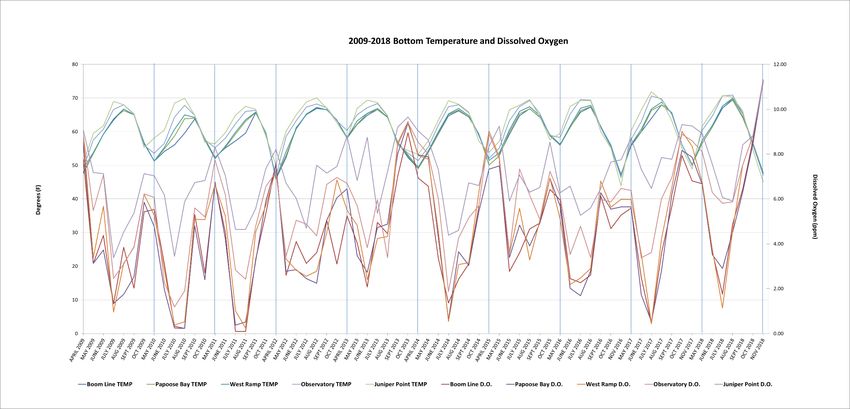
Big Bear Municipal Water District
                         2018 Lake Operations Summary

  “The mission of the Big Bear Municipal Water District is to Manage the Lake for
                              recreation and wildlife”

Big Bear Lake, Lake Management operations, in support of the Districts mission, consists of a multitude of
management activities. This document serves as a summary of three broad activities; lake level
stabilization, limnological monitoring, and invasive species management.

Lake Level Stabilization
The 2018 season began with below normal lake-levels. On January 2, 2018 the Lake was down 14.96 feet.
After the winter season was complete, the Lake reached 14.60 feet below full on March 28, 2018 (Figure
1) before beginning to drop again. There was little rain and very little snowpack which led to low spring
snow melt flows and a low lake level at the start of the 2018 boating season. Over the 2018 summer
season, the lake level was a few feet below the average lake level over the 2017 boating season. The 2018
boating season ended with the lake at 18.08 feet below full. The lake reached its lowest level on
November 28th at 18.46 feet below full. The District paid Valley District $1,476,043 in 2018 in accordance
with the 1996 in-lieu agreement to help stabilize the level of Big Bear Lake. There were no additional water
releases in 2018 beyond the fish release requirement for Bear Creek. Historical lake levels can be viewed
on the District web page. Figure 2 depicts lake levels from 2011-2018.

                                                                                                           Figure 1

                                                                                                1|Page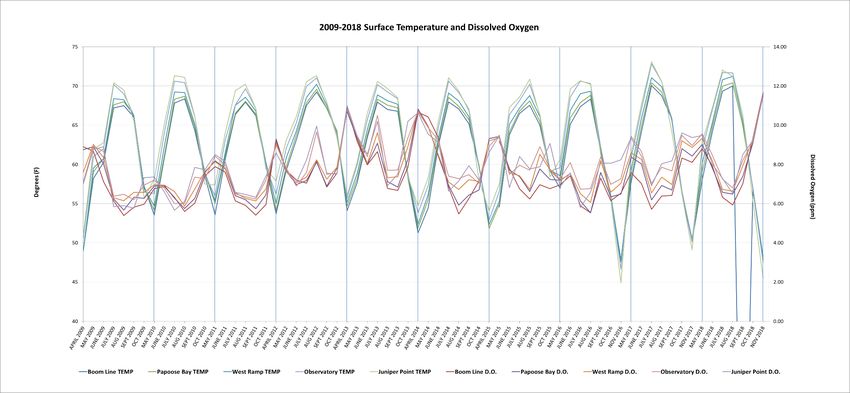
Figure 2

2|Page
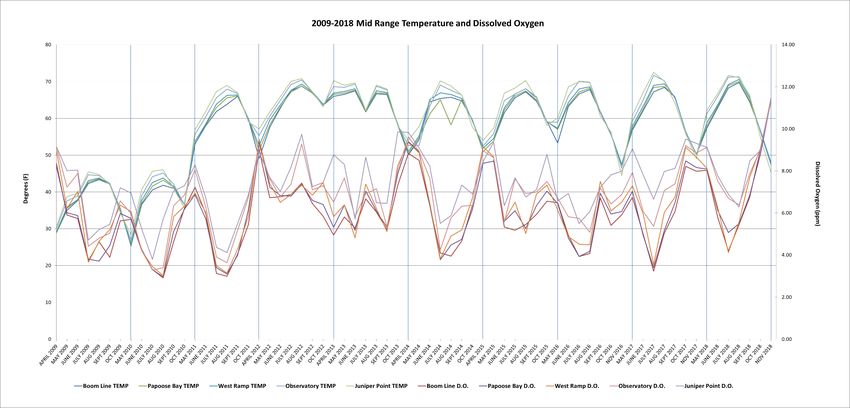
Limnological Monitoring
                     District Staff weekly measure the Lake’s limnological properties during the boating season (May-
                     November) at 5 monitoring stations across the Lake. Measurements of the Lake’s temperature and
                     dissolved oxygen are taken using a YSI 556 MPS meter. Water clarity is also measured at each monitoring
                     station using a Secchi Disk. The charts below (Figures 3, 4, and 5) show surface, mid depth and bottom
                     water temperature and dissolved oxygen content for each of the five Lake monitoring stations (1=Boom
                     Line, 2=Papoose Bay, 3=West Ramp, 4=Observatory and 5=Juniper Point).

                     The District compiled and created graphs for a ten-year rolling period of the limnological properties of the
                     Lake to compare trends. These graphs are located in the appendix of this report.

                                              Fig. 3 2018 Surface Temperature and Dissolved Oxygen
              80.0                                                                                                                  15
                                                                                                                                    14
              70.0                                                                                                                  13
                                                                                                                                    12
              60.0                                                                                                                  11
                                                                                                                                    10
              50.0

                                                                                                                                         Dissolved Oxygen
                                                                                                                                    9
                                                                                                                                    8
Temperature

              40.0
                                                                                                                                    7
                                                                                                                                    6
              30.0
                                                                                                                                    5

              20.0                                                                                                                  4
                                                                                                                                    3

              10.0                                                                                                                  2
                                                                                                                                    1
               0.0                                                                                                                  0

                                          Station 1 TEMP     Station 2 TEMP      Station 3 TEMP      Station 4 TEMP
                                          Station 5 TEMP     Station 1 D.O.      Station 2 D.O.      Station 3 D.O.

                                                                                                                      3|Page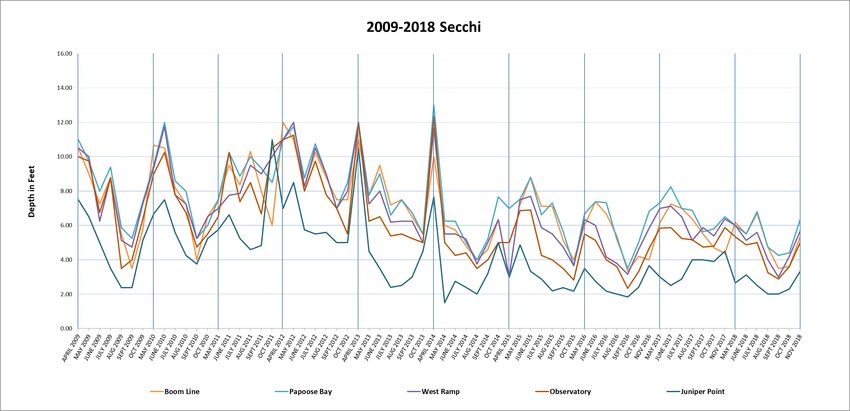
Fig. 4 2018 Mid Range Temperature and Dissolved Oxygen
              80.0                                                                                         15
                                                                                                           14
              70.0                                                                                         13
                                                                                                           12
              60.0                                                                                         11
                                                                                                           10
              50.0

                                                                                                               Dissolved Oxygen
                                                                                                           9
                                                                                                           8
              40.0
Temperature

                                                                                                           7
                                                                                                           6
              30.0
                                                                                                           5

              20.0                                                                                         4
                                                                                                           3
              10.0                                                                                         2
                                                                                                           1
               0.0                                                                                         0

                           Station 1 TEMP       Station 2 TEMP      Station 3 TEMP    Station 4 TEMP
                           Station 5 TEMP       Station 1 D.O.      Station 2 D.O.    Station 3 D.O.

                              Fig. 5 2018 Bottom Temperature and Dissolved Oxygen
              80.0                                                                                         15
                                                                                                           14
              70.0                                                                                         13
                                                                                                           12
              60.0                                                                                         11
                                                                                                           10
              50.0

                                                                                                               Dissolved Oxygen
                                                                                                           9
                                                                                                           8
              40.0
Temperature

                                                                                                           7
                                                                                                           6
              30.0
                                                                                                           5

              20.0                                                                                         4
                                                                                                           3
              10.0                                                                                         2
                                                                                                           1
               0.0                                                                                         0

                     Station 1 TEMP         Station 2 TEMP       Station 3 TEMP      Station 4 TEMP
                     Station 5 TEMP         Station 1 D.O.       Station 2 D.O.      Station 3 D.O.

                                                                                                  4|Page
Typically as the Lake surface warms, the Lake stratifies with cold dense oxygen depleted water forming a
layer below the relatively warmer, less dense, oxygenated water above. Later in the year, surface and
bottom water temperatures typically equilibrate and the waters mix bringing oxygen depleted and
nutrient laden water up into the water column to spur algae growth. Water clarity drops dramatically and
water column oxygen is also diluted when this occurs. Table 1 lists the dates that the Lake has mixed.
Mixing typically occurs in late August or early September. The 2018 season saw normal states of
stratification and mixing.

The Lake first began to stratify in mid-June and remained slightly stratified by from late-June to mid-August.
Around August 10, 2018 the Lake showed signs of de-stratification and slight mixing. On August 27, 2018,
the entire Lake was completely mixed and showing uniform temperatures throughout the entire
waterbody. By September 9, 2018 the lake began to lightly stratify until October 1, 2018 when the lake
mixed thoroughly and remained mixed though the end of the year. Due to the timing of the Lake’s mixing
in 2018, algae rates were higher during those times. However, physically, aesthetically, and recreationally,
the lake was not adversely impacted with algae growth. Temperature is the main variable effecting lake
stratification and mixing. Other variables such as heavy winds and low lake level may help contribute to
mixing. The 2018 season saw a more mixed Lake throughout. Given the amount of time the lake was mixed,
and the amount of available nutrients in the water column, it was amazing to see a lake which have very
little impact from algae growth. Winds may have helped keep the physical appearance of algae down since
algae sinks and scatters when the wind blows the surface of the water. However, the lack of algae blooms
was likely due to the aluminum sulfate treatment in 2015. This treatment capped available nutrients in
deeper portions of the lake which reduced nutrient flux rates between the lake sediment and the water
column. With those additional sediment nutrients made unavailable, algae did not have a sufficient means
of nourishment to create a lake-wide bloom. Because of the low lake levels and very little inflow of new
nutrients, previous populations of algae in years past, and aquatic vegetation may have been sequestering
available nutrients which reduced algae populations this season. The conditions for algae were ripe this
year, and the main variable on the lower populations of algae this season was nutrient availability.

Surface water temperatures peaked on August 6, 2018 with 70.99 degrees Fahrenheit at the west end
and on July 23, 2018 with 74.65 degrees Fahrenheit at the east end of the lake. Throughout 2018, the
temperature differed by 3.5-4 degrees Fahrenheit on average from the west to the east end. Lake
temperatures normally varied from the mid-60s to low-70s at both the west and east ends of the Lake.

Secchi readings vary widely year to year over the spring and summer months when the Lake is stratified.
In 2018, Secchi depths maxed between July 9 and July 23, 2018. The depth readings become shallower as
the season proceeds due to algal growth and mixing. Figure 6 is a chart showing average weekly Secchi
water clarity results in 2018.

                                                                                                 5|Page
Fig. 6 2018 Secchi
                12

                10
Depth in Feet

                8

                6

                4

                2

                0

                                    Station 1      Station 2       Station 3          Station 4            Station 5

                                                 Table 1 – Lake Mixing History
                      Year                                             Date Lake Mixed
                      2018                                             June 3, August 10-15, October 1 (close to not stratifying
                                                                       all year)
                      2017                                             August 14, September 11
                      2016                                             August 22, September 12
                      2015                                             Late June-Early July, Mid October
                      2014                                             Mid-August/Mid-September
                      2013                                             August
                      2012                                             Lake did not stratify
                      2011                                             September 6 and June 7
                      2010                                             September 3
                      2009                                             June 12 and August 12
                      2008                                             August 19
                      2007                                             August 20
                      2006                                             August 28
                      2005                                             September 6
                      2004                                             Lake did not stratify

                The District installed a Lake aeration system in the summer of 2004. The decision to purchase and install
                the system was the result of low lake levels, warm water temperature, high concentrations of algae and
                low dissolved oxygen content when the Lake is stratified. High Lake water temperatures and low
                dissolved oxygen concentrations stressed trout species, sometimes resulting in fish die off in large
                numbers. Table 2 provides a qualitative summary of fish die off prior and subsequent to the installation
                of the aeration system.

                                                                                                                       6|Page
Table 2 – Big Bear Lake Fish Die Off History
Year Qualitative Die Off of Trout Comments
2018 Insignificant
2017 Insignificant
2016 Insignificant
2015 Insignificant
2014 Insignificant
2013 Insignificant
2012 Insignificant
2011 Insignificant
2010 Insignificant
2009 Insignificant
2008 Insignificant
2007 Insignificant
2006 Insignificant
2005 Insignificant
Sept. 2004 New aerator is installed
2004 Very Significant 1000-2000 per week
2003 Very Significant 1000-2000 per week
2002 Significant 200-1000 per week
2001 Moderate 100-200 per week
2000 Moderate 100-200 per week
1999 Moderate 100-200 per week
1998 Minor 0-100 per week
1997 Minor 0-100 per week
1996 Minor 0-100 per week
The system is a stationary floating 25 horse power pump located between the boom line and the dam
that draws Lake water and discharges it into the air at the rate of 8600 gallons per minute. The water
cools and is oxygenated as it falls through the air before returning to the Lake. The result is an
approximate 40 acre oxygenated, cooler water refuge for trout fish species. Although the system
typically operates during the cooler night and early morning hours, under extreme problematic
conditions it is run 24 hours a day. Since installation and operation of the aeration system no significant
fish die offs have occurred.
Invasive Species Management
The Invasive Species Management program can be broken down into 3 major activities; aquatic plant
control, carp removal and quagga mussel prevention program.
Aquatic Plant Control
Activities associated with aquatic plant control have two components. Milfoil specific herbicides are
commonly used to treat areas infested with Eurasian Water Milfoil. Native aquatic plant species are
7|Pagetypically controlled mechanically using a weed harvester. Cuttings are delivered to a composting facility
operated by the City of Big Bear Lake. Harvesting operations are used to maintain navigation channels
and boat dock lake access. By harvesting and removing milfoil, the District receives credit by the Santa
Ana Regional Water Quality Control Board for phosphorus and nitrogen TMDL reduction targets.
The District has made considerable progress in reducing the population of milfoil plants in the Lake
compared to the baseline year 2000 when more than 1000 acres of the lake were infested. Figure 7 is a
chart summarizing acres of Milfoil mapped each year.
Figure 7
Three methods of herbicide application are used. Each of the application methods utilizes a pontoon
boat and two Lake Maintenance employees. The boat driver uses a GPS mapping system to assure
applications are made within the mapped boundaries and at the prescribed concentrations. Large areas
are treated using vortex physics of water pumped through an eductor nozzle at pressure to draw dry
product from a hopper to mix granular herbicide with Lake water and spray it onto the Lake surface.
Nozzles installed on either side of the back of the weed harvester barge distribute product in swaths 30
feet wide as the barge moves through the milfoil infested littoral zone. Metering of product delivery in
this unit is based on the known delivery rate of the equipment and the speed of the barge moving
through the infested area. The other method employs vortex physics but uses air instead of water.
Typically called the “Vortex” by the District, this method is used for smaller more pinpoint applications.
The unit has a blower that moves air across the bottom opening of a funnel shaped hopper. The air
draws the product out of the hopper and is then directed through a hose to a hand held control and
nozzle. Metering with this unit is based on an even distribution of a preloaded quantity of product in
the hopper and the known dimension of the area to be treated. The liquid herbicide application is made
8|Pagebelow the water surface by injection from submerged discharge hoses. An electric metering pump
draws herbicide from storage through calibrated hose nozzles trailing from the back of a moving work
boat. In all cases application rates are computed using label instruction for plant species, treatment area
and water depth and are in accordance with the District’s Aquatic Pesticide Application Plan/NPDES
permit. In 2018, two small herbicide applications were made. For both events, the herbicides used were
a mixture of triclopyr and endothall. Most plant control came from harvesting in 2018. The reasons are
given below.
On odd-years, the District conducts a detailed density survey of aquatic vegetation within Big Bear Lake.
Being an even-year, weed growth in 2018 was surveyed but density counts were not performed. The
District had knowledge of what species were present in the lake and where they would likely create
problems. The bigger concern came from the Lake’s level and nutrient loading. The Lake’s highest level
in 2018 was at 57.73 feet (14.60 feet below full) which occurred on March 28th. Because of the drought
conditions and far below average winter, the District expected the Lake to drop approximately three and
a half (3.5) feet over the summer months of 2018. The total range of lake level was 3.86 feet March 28
to November 28. The actual lowest lake level in 2018 occurred on November 28, 2018 at 18.46 feet
below full.
Beginning the 2018 season at lower than average level, the District made an informed proactive decision
to sparsely treat with aquatic herbicides for the 2018 season. Similar to the 2016 and 2017 season, the
District feared that chemically treating the Lake’s aquatic vegetation would result in heavy nutrient
loading from the decaying vegetation. These decaying byproducts would be added to an already nutrient-
saturated half-full lake, which could result in a massive algae bloom(s). The District weighed the options
and decided it would be worse to have a massive algae bloom (possibly a harmful algae bloom “HAB”)
than to have the presence of more nuisance aquatic vegetation left in the Lake. Furthermore, the presence
of more aquatic vegetation in the water column would help absorb some of the water’s nutrients. The
District conducted an alum treatment in May-June 2015. The legacy effects of the alum treatment would
be better preserved if more nutrient was not added to the water column or the lake bottom. It was
decided that the District would mechanically harvest and remove nuisance species rather than treat with
herbicides.
Though the District focused on utilizing heavy harvesting rotations, there were minimal treatments in
2018. No scalable treatment events occurred. Spot treatments were made only at marinas. The cost of
herbicide used for spot treating the marinas totaled $1024. Employee expenses, fuel and depreciation for
the 2018 program came to $690.00 for a 2018 total program cost of $1,714.
The District harvested heavily from June 15, 2018 to September 15, 2018. The District took calls from
the public and surveyed the Lake daily to schedule and plan the logistics of the mechanical harvester.
Because of the Lake’s low level, only one launch ramp was accessible to off-load the harvester’s cuttings
to a dump truck. The limited ramp access made harvesting extremely time consuming for the summer
season. A full harvester can only travel two (2) miles per hour, so cutting nuisance vegetation at one end
of the Lake and transporting the cuttings to the ramp at the other end of the Lake proved to be a slow
operation. This in turn diminished the amount of nuisance vegetation that could be cut.
9|PageThough transportation was time-consuming, this year saw good control of Eurasian Water Milfoil,
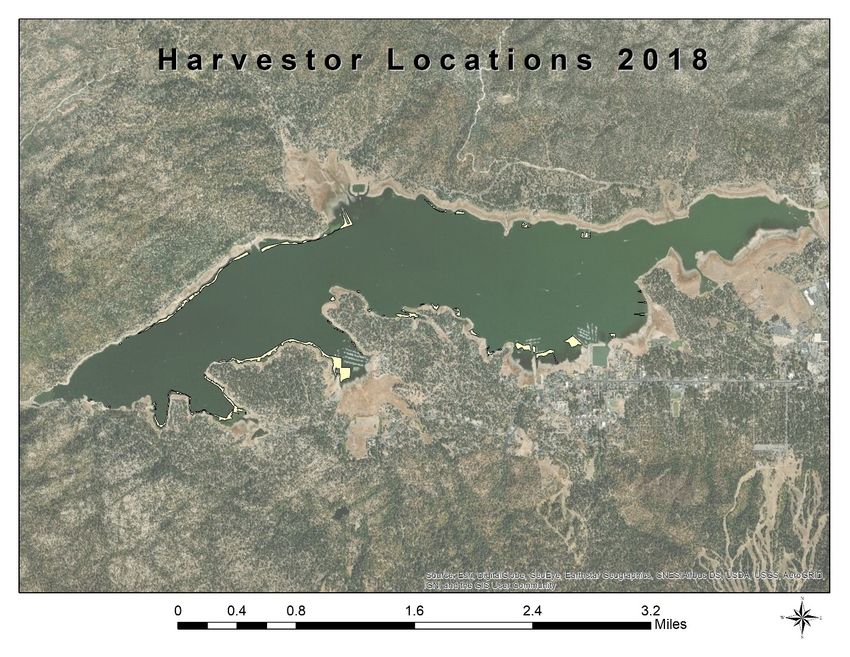
coontail, and widgeon grass by manually harvesting. In 2018, 54 acres were mapped and harvested,
shown in Figure 8 below. There were 81 loads of aquatic vegetation removed by the District’s harvester.
These 81 loads totaled 276.9 tons (553,800 lbs.) of wet-weight vegetation or 27.14 tons (54,272 lbs.) of
dry-weight vegetation. As plants are harvested the operator notes the species collected during his run.
Using the weight and species of aquatic plant and average phosphorous and nitrogen content based on
previous sampling and laboratory analysis results for each species, the District estimates total
phosphorous and nitrogen removed by the harvesting operation each year, summarized in Table 3
below. Of the 2018 totals, approximately 163 lbs. of phosphorus and 1,357 lbs. of nitrogen were
removed from the Lake. Weed harvesting expenses, including labor, fuel and depreciation, totaled
$15,420.
Table 3 – Harvestor Totals
HARVESTOR TOTALS
Wet
Dry Weight
Weight Phosphorus Nitrogen
Vegetation
Vegetation
LBS 553,800.00 54,272.40 162.82 1,356.81
TONS 276.9 27.1362 - -
Figure 8
10 | P a g eHarvesting in 2018 was successful. Granted the lake level was low, the Lake was low to moderately
impacted by milfoil and other nuisance aquatic macrophytes. Though 2018 saw less mappable and
harvested acres than 2017. This is simply due to lower lake levels – as lake levels drop there is less and
less photic zone area for aquatic species to grow.
The Lake experienced no significant algae blooms. There was no biological or recreational impairment due
to algae during the 2018 season. This was in part due to: 1) allowing more aquatic macrophytes to remain
in the water column helped to absorb nutrients that would have otherwise been available for algae
growth, 2) the legacy effect of the 2015 alum treatment, and 3) continuous microscopy monitoring of the
water column for algae types and cell counts with the District’s FlowCam microscope. There was slight
aesthetic impairment at times in some back bays during hot, calm days. However, as soon as wind picked
up, the algae disappeared. Water samples were taken through-out the summer season:
Table 4 – FlowCam Algae Sampling Events
FlowCam Algae Sampling Events
Date Location Sample Runs
7/9/2018 TMDL 1 (Dam) 5
7/13/2018 Big Bear Marina 4
7/25/2018 West Ramp 1
7/26/2018 East Ramp 4
8/20/2018 TMDL 1 (Dam) 3
9/19/2018 Big Bear Marina 3
10/3/2018 Big Bear Marina 11
10/25/2018 TMDL 6 (Mid Lake) 4
10/26/2018 TMDL 6 (Mid Lake) 3
Carp Removal
After observing the effectiveness of electro-shock fishing for Carp by a District contractor in 2007 the
District purchased an electro-shock boat in 2008 and installed a commercial grinder placed over a sewer
manhole in 2009. Shocked carp are netted and after the boat is filled they are ground up and disposed
of in the sanitary sewer at the back of the District shop. The Big Bear Area Regional Wastewater Agency
(BBARWA) charges the District $150 for every 1000 pounds of Carp discharged to the sewer.
Electro-shock fishing began June 15, 2018 and continued to September 15, 2018. However due to
mechanical problems with the generator on the electro-fishing boat, the District was unable to electro-
fish very many carp in the summer of 2018. The annual Carp Round-up event also removes carp from
the lake. Cash and prizes are awarded for winners in the various divisions. Bow hunters came from
California and the southwest to compete in this District sponsored event on the weekend of June 16-17,
2018.
Including the 1,489 pounds of carp shot during the Carp Round-up, the District removed a total of 2,289
pounds of carp during summer 2018.
Expenses for the carp removal program including the grinder, wages, fuel costs and BBARWA charges for
carp disposal in 2018 totaled $289. Fish surveys conducted by the California Department of Fish and
11 | P a g eWildlife indicate that the District’s carp removal program has dramatically improved game fish
populations. Table 5 and Figure 9 show the District’s Carp removal statistics from 2007-2018.
Table 5 – Carp Removal Statistics
Year Carp Tournament Electro Shock Total Pounds Cost (approx.)
(lbs) Fishing (lbs) Removed
2018 1,489 800 2,289 $498
2017 3,327 9,890 13,217 $3,576
2016 2,438 4,950 7,388 $2,782
2015 8,913 32,800 41,713 $10,644
2014 4,443 10,700 15,143 $4,276
2013 3,931 7,050 10,981 $3,928
2012 4,115 18,955 23,070 $10,090
2011 11,000 20,491 31,491 $7,000
2010 10,128 39,350 49,478 $14,551
2009 6,350 36,000 42,350 $12,490
2008 4,200 26,000 30,200 $8,909
2007 6,119 96,000 102,119 $96,000
Figure 9
Quagga Mussel Prevention Program
Starting with the boating season of 2008, the District implemented a quagga mussel prevention program
aimed at preventing the spread of quagga mussels in Big Bear Lake. The general policy is clean, drained
and dry before a vessel can launch. If a vessel does not meet these criteria, the vessel will be
decontaminated at one of our public launch ramps. Private marinas along the lake are required to have
12 | P a g ea level 1 certified quagga mussel inspector available to inspect boats prior to launch. If they encounter a
vessel that does not meet the criteria, they are sent to one of the public launch ramps for
decontamination.
The District has 3 decontamination stations. The East Ramp and West Ramp handle the bulk of the
decontaminations. The third station is located at the District’s main office and is only run on holidays or
special events. The decontamination is conducted by flushing suspect areas of the vessel with hot water.
The entire process can take as little as 5 minutes or up to 45 minutes depending on the size of the vessel
and level of decontamination.
In the spring of each year, the District’s Level III quagga mussel inspection trainers conduct a Level I
quagga mussel training class to certify new and returning inspectors. The class is a free-of-charge all-day
course for both private marina employees and District staff.
The District was awarded $400,000 in grant money for a Quagga/Zebra Mussel Prevention grant through
the Department of Boating and Waterways in April 2016. This money funded projects and costs for 2016
seasonal ramp personnel salaries, doubling the decontamination capacity at the East Ramp by adding an
additional decontamination pad and decontamination unit, purchasing new efficient and safer operating
propane fired/electric driven decontamination units for the East and West launch ramps, implementing
a more robust and secure reciprocal banding program, upgrading the District’s phone system to include
a quagga hotline for the public, and training our inspection staff to be Level II quagga inspectors with the
new training material and protocol. The District was awarded an additional $345,000 under the same
program in early 2017, which funded seasonal ramp personnel and operational costs, decon unit
replacement parts, signage and training material, more banding supplies, and a FlowCam to monitor the
Lake for quagga mussel veligers. In late 2017, the District was awarded an additional $385,000 to cover
seasonal ramp personnel and operational costs, constructing a new enclosure at the Eat Ramp to house
the new decontamination units, and purchase more banding supplies.
The District consistently monitored water for the presence of quagga mussels in Big Bear Lake. If
quaggas were found in Big Bear Lake early enough, the District could do its part to contain the quagga or
zebra mussels so they would not contaminate any other neighboring body of water. The District sent
water samples to the California Department of Fish and Wildlife Bodega Bay Shellfish Laboratory for
analysis and samples were proven negative by the State. Furthermore, the District monitored for quagga
mussels using cross-polarized light microscopy with the District’s flow cam. Samples were collected and
tested on the following dates (all results were negative):
13 | P a g eTable 6 – Plankton Tow Sample Sheet
2018 Quagga Plankton Tow Sample Sheet for FlowCam Cross-Polarized Microscopy
Date Location Sample Runs Positive/Negative Sampled By Analyzed By
7/9/2018 TMDL 1 (Dam) 5 Negative James Bellis James Bellis
7/13/2018 Big Bear Marina 4 Negative James Bellis James Bellis
7/25/2018 West Ramp 1 Negative James Bellis James Bellis
7/26/2018 East Ramp 4 Negative James Bellis James Bellis
8/20/2018 TMDL 1 (Dam) 3 Negative James Bellis James Bellis
9/19/2018 Big Bear Marina 3 Negative James Bellis James Bellis
10/3/2018 Big Bear Marina 11 Negative James Bellis James Bellis
10/25/2018 TMDL 6 (Mid Lake) 4 Negative James Bellis James Bellis
10/26/2018 TMDL 6 (Mid Lake) 3 Negative James Bellis James Bellis
Also, the District monitored multiple substrate locations weekly in 2018. Other locations were checked
for presence of quagga mussels throughout 2018. These areas include boats exiting the launch ramp,
District vessels during maintenance, District docks, the face of the Bear Valley Dam, and random
shoreline areas during dock inspections. All instances of substrate and other inspections came back
negative in 2018. Because Big Bear Lake is still quagga/zebra free, the District is eligible to apply for
further quagga/zebra prevention grant funding. The District intends to apply for more funding through
the Department of Boating and Waterways Quagga/Zebra Mussel Prevention program as opportunities
become available.
The District employs 11 seasonal ramp attendants whose job is to inspect and decontaminate vessels as
they arrive at the public launch ramps. In total, the District launched 7,758 boats in the 2018 boating
season. Of these, 4,707 were inspected at the public launch ramps. Of this number 2,556 vessels were
clean and no decontamination was necessary and 2,151 vessels were decontaminated. A total of 3,051
boats were banded. Figure 10 below depicts the lake use statistics for 2011-2018.
14 | P a g eFigure 10 – Lake Use Statistics
Big Bear Lake
Lake Use Statistics
MEMORIAL DAY THRU LABOR DAY
MON-FRI DAILY AVERAGE BOAT COUNT 2018 2017 2016 2015 2014 2013 2012 2011
MON-FRI MORNING 48 46 47 48 51 60 64 54
MON-FRI AFTERNOON 144 144 108 121 107 101 100 90
WEEKEND DAILY AVERAGE BOAT COUNT 2018 2017 2016 2015 2014 2013 2012 2011
WEEKEND MORNING 105 128 93 83 115 132 135 111
WEEKEND AFTERNOON 306 321 219 238 247 188 175 198
MEMORIAL DAY THRU LABOR DAY
MON-FRI DAILY AVERAGE SHORELINE USERS 2018 2017 2016 2015 2014 2013 2012 2011
MON-FRI MORNING 157 136 137 115 134 123 146 123
MON-FRI AFTERNOON 357 387 391 316 304 240 278 241
WEEKEND DAILYAVERAGE SHORELINE USERS 2018 2017 2016 2015 2014 2013 2012 2011
WEEKEND MORNING 289 312 230 163 245 127 269 213
WEEKEND AFTERNOON 812 901 675 655 665 437 403 549
APRIL-SEPTEMBER
TOTAL VESSEL LAUNCHED 2018 2017 2016 2015 2014 2013 2012 2011
EAST RAMP 993 4823 2141 7249 8984 9130 9231 9499
WEST RAMP 6765 3022 8201 2523 2890 2786 2769 2946
APRIL-SEPTEMBER
TOTAL VESSEL INSPECTION 2018 2017 2016 2015 2014 2013 2012 2011
EAST RAMP 1619 3899 2283 3487 3837 3764 3744
WEST RAMP 3088 1576 3014 953 997 999 1274
APRIL-SEPTEMBER
TOTAL VESSEL DECONTAMINATED 2018 2017 2016 2015 2014 2013 2012 2011
EAST RAMP 549 1648 988 1766 1903 1794 1677
WEST RAMP 1602 778 1372 428 387 340 673
APRIL-SEPTEMBER
TOTAL VESSEL CLEAN 2018 2017 2016 2015 2014 2013 2012 2011
EAST RAMP 1070 2251 1295 1721 1934 1970 2067
WEST RAMP 1486 798 1642 525 569 659 601
APRIL-SEPTEMBER
TOTAL VESSEL BANDED 2018 2017 2016 2015 2014 2013 2012 2011
EAST RAMP 0 924 2303 3762 5147 5366 5487
WEST RAMP 3051 1446 5187 1570 1934 1787 1495
ANNUAL PERCENTAGE OF USE:
AM PM
PRIVATE BOATS 2018 2017 2016 2015 2014 2013 2018 2017 2016 2015 2014 2013
PRIV STILL FISHING 10% 11% 12% 18% 20% 20% 13% 16% 16% 14% 15% 14%
PRIV TROLLING 24% 23% 25% 29% 30% 26% 15% 16% 12% 16% 12% 9%
PRIV SKIING 10% 11% 10% 13% 10% 9% 5% 6% 7% 6% 6% 5%
PRIV SAILING 0% 0% 1% 0% 0% 1% 1% 1% 1% 1% 1% 2%
PWC 9% 8% 8% 8% 8% 7% 10% 11% 12% 12% 12% 12%
PRIV OTHER 13% 17% 15% 16% 16% 18% 15% 15% 20% 20% 20% 28%
TOTALS 66% 70% 71% 84% 84% 81% 59% 65% 68% 69% 66% 70%
AM PM
RENTAL BOATS 2018 2017 2016 2015 2014 2013 2018 2017 2016 2015 2014 2013
RENT STILL FISHING 5% 4% 5% 4% 4% 7% 8% 6% 8% 7% 7% 5%
RENT TROLLING 17% 15% 15% 9% 8% 7% 15% 15% 12% 10% 8% 4%
RENT OTHER 11% 12% 9% 3% 4% 5% 17% 15% 12% 14% 19% 22%
TOTALS 33% 31% 29% 16% 16% 19% 40% 36% 32% 31% 34% 31%
AM PM
ACTIVITY USE 2018 2017 2016 2015 2014 2013 2018 2017 2016 2015 2014 2013
FISHING 56% 52% 58% 59% 61% 60% 51% 52% 48% 46% 41% 32%
OTHER ACTIVITIES 44% 48% 42% 41% 39% 40% 49% 48% 52% 54% 59% 68%
INSPECTION TOTALS 2018 2017 2016 2015 2014 2013
CLEAN 33% 39% 28% 23% 21% 22%
DECON 28% 31% 23% 22% 19% 18%
BANDED 39% 30% 72% 55% 60% 60%
15 | P a g eSummary of 2018 Lake Management Operations Expenses
In Lieu Agreement $1,476,043
Herbicide Treatment $1,714
Weed Harvesting $15,420
Carp Removal and Disposal $498
TOTAL $1,493,675
16 | P a g eTen-Year Rolling Limnology Reports
17 | P a g e18 | P a g e
19 | P a g e
20 | P a g e
21 | P a g e
22 | P a g e
23 | P a g e
You can also read