Estimating the basic reproductive ratio for the Ebola outbreak in Liberia and Sierra Leone
←
→
Page content transcription
If your browser does not render page correctly, please read the page content below
Khan et al. Infectious Diseases of Poverty (2015) 4:13
DOI 10.1186/s40249-015-0043-3

 RESEARCH ARTICLE                                                                                                                              Open Access

Estimating the basic reproductive ratio for the
Ebola outbreak in Liberia and Sierra Leone
Adnan Khan1, Mahim Naveed2, Muhammad Dur-e-Ahmad3 and Mudassar Imran4*

  Abstract
  Background: Ebola virus disease has reemerged as a major public health crisis in Africa, with isolated cases also
  observed globally, during the current outbreak.
  Methods: To estimate the basic reproductive ratio R0, which is a measure of the severity of the outbreak, we
  developed a SEIR (susceptible-exposed-infected-recovered) type deterministic model, and used data from the
  Centers for Disease Control and Prevention (CDC), for the Ebola outbreak in Liberia and Sierra Leone. Two
  different data sets are available: one with raw reported data and one with corrected data (as the CDC suspects
  under-reporting).
  Results: Using a deterministic ordinary differential equation transmission model for Ebola epidemic, the basic
  reproductive ratio R0 for Liberia resulted to be 1.757 and 1.9 for corrected and uncorrected case data, respectively.
  For Sierra Leone, R0 resulted to be 1.492 and 1.362 for corrected and uncorrected case data, respectively. In each of
  the two cases we considered, the estimate for the basic reproductive ratio was initially greater than unity leading to
  an epidemic outbreak.
  Conclusion: We obtained robust estimates for the value of R0 associated with the 2014 Ebola outbreak, and
  showed that there is close agreement between our estimates of R0. Analysis of our model also showed that
  effective isolation is required, with the contact rate in isolation less than one quarter of that for the infected
  non-isolated population, and that the fraction of high-risk individuals must be brought to less than 10% of the
  overall susceptible population, in order to bring the value of R0 to less than 1, and hence control the outbreak.
  Keywords: Epidemiology, Ebola virus disease, Transmission model, Basic reproductive ratio

Multilingual abstracts                                                               in Central and Western Africa [2]. Beginning in December
Please see Additional file 1 for translations of the abstract                        2013 in West Africa, precisely Guinea, the EVD outbreak
into the six official working languages of the United                                spread to Sierra Leone, Liberia and Nigeria with fatality
Nations.                                                                             rates of 73.2%, 43.0%, 52.5% and 33.3% respectively [4].
                                                                                     In May 2014, the second outbreak was confirmed in
Background                                                                           nearby regions, including Sierra Leone and Liberia [3].
Ebola virus disease (EVD), named after the Ebola River                               As of October 14th 2014, 4,555 Ebola deaths have been
in Zaire, is known to be a highly contagious disease with                            reported in these countries, including one death in the
a high mortality rate [1,2]. Previously known as Ebola                               United States [5].
hemorrhagic Fever, EVD has a number of different strains.                               EVD is a viral infection caused by a virus of the fam-
Originating in Sudan and Zaire in 1976, there has been a                             ily Filoviridae, genus Ebolavirus. There are five iden-
number of over the years [1,2]. From 1976 to 2008, the                               tified subspecies of the Ebolavirus. Four of the five
total case fatality rate for EVD victims was 79% [3]. The                            subspecies: i) Ebolavirus (Zaire ebolavirus), EBOV ii)
ongoing outbreak of EVD is affecting multiple countries                              Sudan virus (Sudan ebolavirus), SUDV, iii) Bundibugyo
                                                                                     virus (Bundibugyo ebolavirus), BDBV and iv) Ta Forest
* Correspondence: mimran@asu.edu                                                     virus (Ta Forest ebolavirus), TAFV, have caused disease
4
 Department of Mathematics and Natural Sciences, GULF University for
Science and Technology, Mubarak Al-Abdullah, West Mishref, Kuwait                    in humans. The fifth, called the Reston virus (Reston
Full list of author information is available at the end of the article

                                        © 2015 Khan et al.; licensee BioMed Central. This is an Open Access article distributed under the terms of the Creative
                                        Commons Attribution License (http://creativecommons.org/licenses/by/4.0), which permits unrestricted use, distribution, and
                                        reproduction in any medium, provided the original work is properly credited. The Creative Commons Public Domain
                                        Dedication waiver (http://creativecommons.org/publicdomain/zero/1.0/) applies to the data made available in this article,
                                        unless otherwise stated.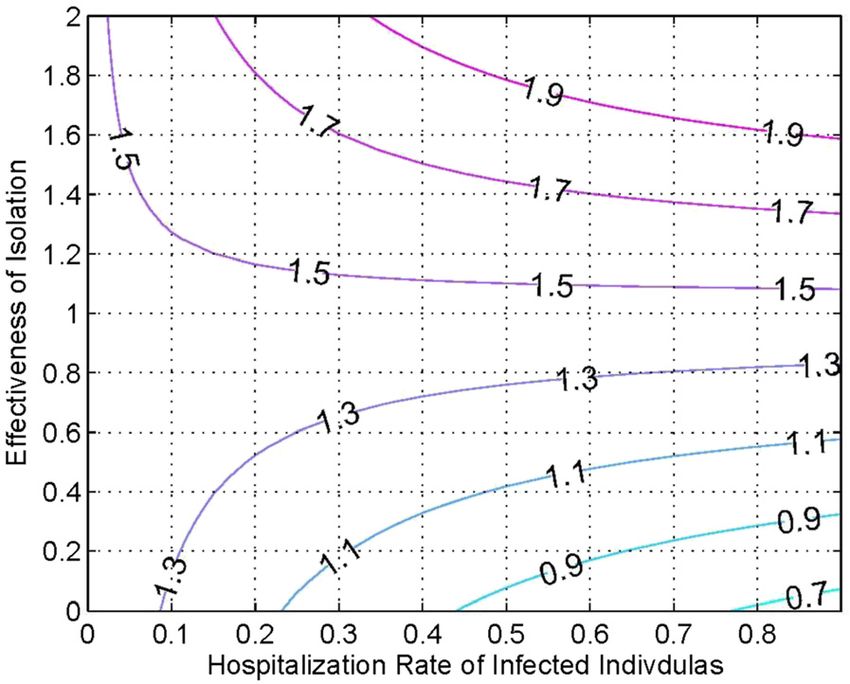
Khan et al. Infectious Diseases of Poverty (2015) 4:13                                                              Page 2 of 8

ebolavirus), has caused disease in nonhuman primates           used epidemic modeling to estimate the number of sec-
[2]. The primary source of Ebola virus is considered to        ondary cases generated by an index case in the absence of
be fruit bats of the Pteropodidae family, with monkeys,        control interventions [10]. In another study, Chowell et al.
gorillas, and chimpanzees believed to further transmit         carried out a comparative review of mathematical models
the disease [4].                                               of the spread and control of Ebola [11]. Legrand et al. have
   Ebola is transmitted through direct contact with the        previously studied transmission dynamics in order to de-
skin, blood or bodily fluids of an infected individual or      rive a relationship between the hospitalization rate and
animal and with contaminated objects [2,6]. Individuals        epidemic size [12].
who take care of an infected person or bury someone               Apart from mathematical modeling of Ebola, note-
who has died from the disease can also acquire the virus       worthy non-mathematical contributions have also been
[2]. There is evidence that health care workers and rela-      made. Recently, Tambo and Xiao-Nong examined re-
tives may become infected after contact with a patient         search, prevention, detection, and management related
or patient’s bodily fluids. It must be noted that a recov-     issues of the Ebola outbreak and reflected upon the major
ered individual cannot spread the virus but the Ebola          gaps in frontline and airport Ebola control and contain-
virus has been found to remain in semen for up to three        ment, providing possible structured opportunities to the
months. Therefore, abstinence from sex is recommended          public [13]. Lai et al. provided insight into non-mutable
for at least this period of time [6]. From the outbreaks       host cell therapeutic agents targeting different steps of the
since 1976, it has been observed that the Ebola virus          life cycle of the Ebola virus [14]. Tambo et al. proposed
cannot naturally transmit through air, water, or food like     surveillance response systems for controlling the Ebola
influenza or diarrheal diseases [2,4]. Furthermore, indivi-    outbreak shedding light on the use of early warnings,
duals suffering from EVD do not infect other individuals       critical human resources development, and methods to
during the incubation period, which can last between           enhance tracking and managing challenges and urging
two and twenty-one days [4]. Common symptoms of                further development in new drug discovery and vaccines
EVD include fever, myalgia, malaise, sore throat, chest        [15]. Tambo also shed light on non-conventional humani-
pain, red eyes, hiccups, rash, weakness, severe headaches,     tarian interventions on Ebola in another recent study [16].
joint and muscle pain, diarrhea, vomiting, stomach pain,          None of the above mentioned models have used the as-
dehydration, dry and hacking cough, and loss of appetite.      pect of two susceptible populations: high-risk and low-
These symptoms typically start two days to three weeks         risk. The model we present in this paper explains different
after acquiring EVD. As the infection spreads, the body        aspects of the disease dynamics. In the following section
undergoes severe blood loss and coagulation abnorma-           we explore the formulation of our model. Then we explain
lities. Ultimately, the liver, kidney, and micro vascular      the data fitting technique and present our results.
endothelial cells (capillary walls) become infected, leading      The purpose of our study is to estimate the basic re-
to compromise of vascular integrity. If not diagnosed and      productive ratio (R0) for the EVD outbreak in Liberia
treated, death usually occurs in the second week of symp-      and Sierra Leone. Using data obtained from the CDC for
toms, and is usually caused by massive blood loss [4].         the period of May 1st, 2014 up until October 1st, 2014,
   Recovery from Ebola is dependent on good supportive         we present a deterministic SEIR type model for the trans-
clinical care and the infected individual's immune re-         mission dynamics of the Ebola virus to estimate R0. We
sponse. Fortunate individuals who recover from EVD de-         also present an illustration of the required disease control
velop antibodies that last for at least 10 years [6]. These    scenario to achieve R0 < 1.
individuals may still experience weakness, fatigue, head-
aches, hair loss, hepatitis, sensory changes, and inflam-      Methods
mation of organs [4].                                          Mathematical model formulation
   Over the years, a few models for EVD have been stud-        We base our study on a deterministic ordinary differential
ied and analyzed. Thomas E. Sutto has used an exponen-         equations (ODE) epidemic model in which the population
tial fitting of data provided by the Centers of Disease        size is divided into six mutually exclusive compartments.
Control and Prevention (CDC) and the World Health              The total population at any time instant t, denoted by
Organization (WHO) to develop formulae that best fit           N(t), is the sum of individual populations in each com-
infection rate totals [7]. Similarly, Camacho et al. depic-    partment that includes low-risk susceptible individuals
ted the potential for large EVD outbreaks by fitting a         SL(t), high-risk susceptible individuals SH(t), exposed in-
mathematical model to time series, estimating epidemio-        dividuals E(t), infected individuals I(t), hospitalized indi-
logical factors responsible for disease transmission [8].      viduals H(t), and recovered individuals R(t) such that,
Another significant contribution estimated parameters
from daily incidence and mortality time series for the
1995 Congo Ebola outbreak [9]. Similarly, Chowell et al.          N ðt Þ ¼ SL ðt Þ þ SH ðt Þ þ E ðt Þ þ I ðt Þ þ H ðt Þ þ Rðt Þ
Khan et al. Infectious Diseases of Poverty (2015) 4:13                                                                 Page 3 of 8

  The high-risk susceptible population includes health-             Infected individuals recover from disease at rate of θI. The
care workers and providers (including all front-line                number of hospitalized individuals is generated when in-
workers), relatives of infected individuals, and the peo-           fected individuals are hospitalized at a rate τ. It diminishes
ple involved in burial processes. The rest of the suscep-           when individuals recover at a rate θH, and die naturally or
tible population is considered to be at a low risk of               due to infection at rates μ and δH, respectively. The flow
acquiring EVD.                                                      diagram of Ebola model is shown in Figure 1.
  Since there is no vertical transmission of the infection,           The model in this study is given by the following sys-
we assume that all newborns are susceptible. The sus-               tem of non-linear differential equations:
ceptible population increases at a constant recruitment
                                                                        dS L
rate Π (all recruited individuals are assumed to be sus-                     ¼ Πð1 − pÞ − λS L − μS L
ceptible), and p is the fraction of recruited individuals                dt
                                                                        dS H
who are at a high risk of acquiring the infection. Low-risk                   ¼ Πp − ψ H λS H − μS H ψ H > 1
                                                                         dt
susceptible individuals acquire the infection at a rate λ.              dE
Furthermore, the susceptible population also decreases                      ¼ λðS L þ ψ H S H Þ − ðα þ μÞE
                                                                        dt                                                    ð1Þ
at the natural death rate μ. An increase in the high-risk               dI
                                                                            ¼ αE − ðτ þ θI þ δ I þ μÞI
population SH means that there are more health-care                     dt
workers and more people involved in the burial process.                 dH
                                                                             ¼ τI − ðθH þ δ H þ μÞH
The rate at which infection is acquired by susceptible clas-            dt
                                                                        dR
ses, also recognized as the force of infection, depends on                  ¼ θI I þ θH H − μR
                                                                        dt
the proportion of the infected and hospitalized individuals,
taking into account the infectiousness of the hospitalized          where, λ ¼ β ðIþηH
                                                                                    N
                                                                                       Þ
                                                                                         is called the force of infection.
individuals (η). In our model, the force of infection is              All model parameters are summarized in Table 1 in
given by λ. The Exposed population increases after sus-             Section 2.4.
ceptible individuals acquire the infection at a rate λ from
low-risk individuals or at a rate ψHλ from high-risk indi-          The basic reproductive ratio
viduals respectively. The population of infected individuals        The basic reproductive ratio (R0) is the number of indi-
generated at a rate α decreases when these individuals go           viduals infected by a single infected individual during
to a hospital at rate τ. It also decreases because of the nat-      the infectious period in an entirely susceptible popula-
ural death rate μ, and the disease-induced death rate δI.           tion [17]. As our model consists of multiple classes, the

 Figure 1 Shows a flow diagram depicting the dynamics of the Ebola virus across all compartments.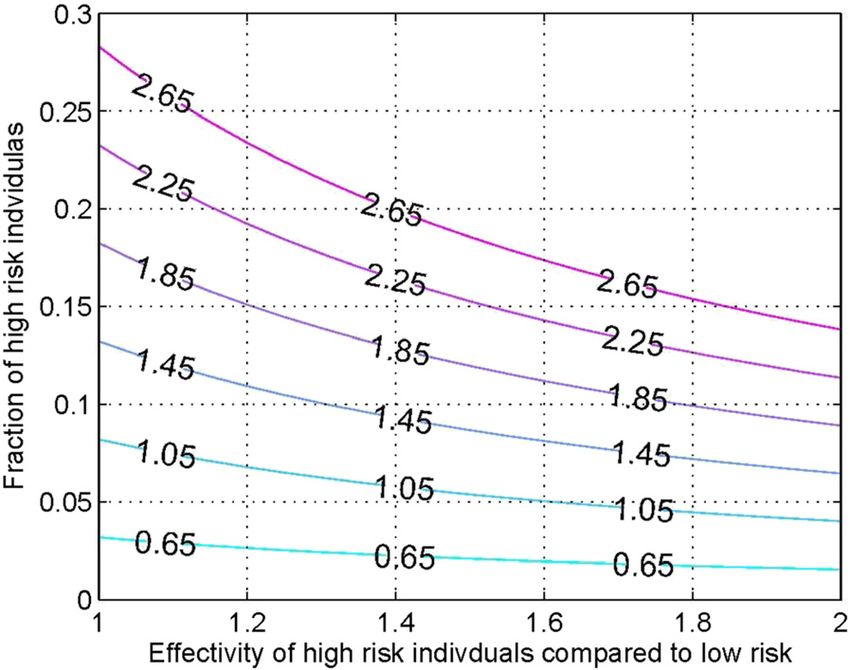
Khan et al. Infectious Diseases of Poverty (2015) 4:13                                                                                Page 4 of 8

Table 1 Values of the parameters used in Model 1                                   where ρ is the spectral radius (the maximum Eigen value
Parameter Description                                                  Value       of the matrix) and FV− 1 is the next generator matrix.
ψH              Modification parameter for infection rate of           1.2-2       This leads to the following expression
                high-risk susceptible individuals
                                                                                                   (
δI              Disease-induced death rate of infected                 0.10                                        1
                individuals                                                            R0 ¼ αβΩ
                                                                                                    ðα þ μÞðθI þ δI þ μÞ þ τðα þ μÞ
δH              Disease-induced death rate of hospitalized             0.5                                                         )
                individuals                                                                                    τ                η
                                                                                              þ
θI              Recovery rate of infected individuals                  0.1                      ðα þ μÞðθI þ δI þ μÞ þ τðα þ μÞ K3
θH              Recovery rate of hospitalized individuals              0.2                ¼ R1 þ R2 :
α               Rate at which latent individuals become                0.1
                infectious                                                           Here, R1 and R2 reflect the continuation of infectious
τ               Hospitalization rate for infected individuals          0.16        individuals from the community and from hospitals re-
Π               Recruitment rate                                       1.7
                                                                                   spectively. The epidemiological significance of the basic
                                                                                   reproductive ratio R0 - which represents the average
p               Fraction of the individuals at high-risk               0.2
                                                                                   number of new cases generated by a primary infectious
β               Transmission rate of disease                           Estimated   individual in a population where some susceptible indi-
1/μ             Average life of human                                  63 years    viduals are at high risk and some infected individuals
                                                                                   go to hospital - is that the Ebola pandemic can be ef-
next generation operator is used to calculate R0 [17]. Be-                         fectively controlled by reducing the number of high-
cause our population consists of a hospitalized class in                           risk individuals and by decreasing peoples’ contact with
addition to exposed and infected classes, our final R0 is                          hospitalized individuals with other individuals, be they
the sum of R1 and R2 (resulting from the infectiousness                            relatives, health-care workers, people involved in burial
linked to community and hospitals respectively).                                   processes, etc. This can bring the threshold quantity
   We use the next generation matrix approach, as intro-                           (R0) to a value less than unity. Biologically, this implies
duced by Diekmann et al., to calculate R0 [18]. Using dif-                         that the Ebola pandemic can be eliminated from the
ferential equations associated with the exposed (E),                               population when R0 < 1.
infected (I), and hospitalized (H) compartments as stated
below, we compute a function (F) for the rate of new in-                           Data sources
fection terms entering, and another function (V) for the                           The epidemic data used in this study wacollected by
rate of transfer into and out of the exposed, infected,                            the WHO during the current outbreak; the data is avai-
and hospitalized compartments by all possible means                                lable at http://apps.who.int/ebola/en/current-situation/ebola-
depicted in Model 1.                                                               situation-report. The CDC analyzed this data and proposed
                                                                                   that there is under-reporting of the cases. They esti-
      E 0 ¼ λðS L þ ψ H S H Þ − ðα þ μÞE;                                          mate that the true number of cases is 2.5 times more
       0
      I ¼ αE − ðτ þ θI þ δ I þ μÞI                and                              than the ones reported [19]. We use the raw or uncor-
                                                                                   rected data from the WHO, and then the corrected
      H 0 ¼ τI − ðθH þ δ H þ μÞH:                                                  data from the CDC from May 1st, 2014 until October
  The matrices F (for the new infection terms) and V (of                           1st, 2014 to estimate R0 for Liberia and Sierra Leone.
the transition terms) are given by,
                                                                                   Parameter values
        2                3
           0 βΩ βηΩ                                                                Based on previous studies, the infection period for EVD
    F ¼ 40 0          0 5       and                                                is six days. The latent period of EVD is between two and
           0 0        0                                                            seventeen days with a mean of ten days. The generation
                                                                                   time of the disease is about 16.6 days. So, the values are
            "                                           #                          1/θI = 6 and 1/α = 10. The parameter η is the relative
                αþμ        0        βηΩ                                            transmissibility of hospitalized individuals compared to
      V ¼        −α τ þ θI þ δI þ μ  0 :                                           infected individuals. The value of η < 1 would indicate
                  0       −τ         K3                                            that isolation in hospitals is effective. The value η > 1
                                                                                   would indicate ineffectiveness of transmissibility in hos-
                                                                Πð1 − pÞþψ H p
where, K 3 ¼ θH þ δ H þ μ; and Ω ¼                                    μ        :   pitals. Such would be the situation in some developing
 Reproductive ratio R0 is then given as                                            countries. For West Africa, the value of η lies between
                                                                                 0.6 and 0.8. The parameter ψH accounts for infection that
   R0 ¼ ρ FV −1                                                                    arises from the individuals involved in burial processes as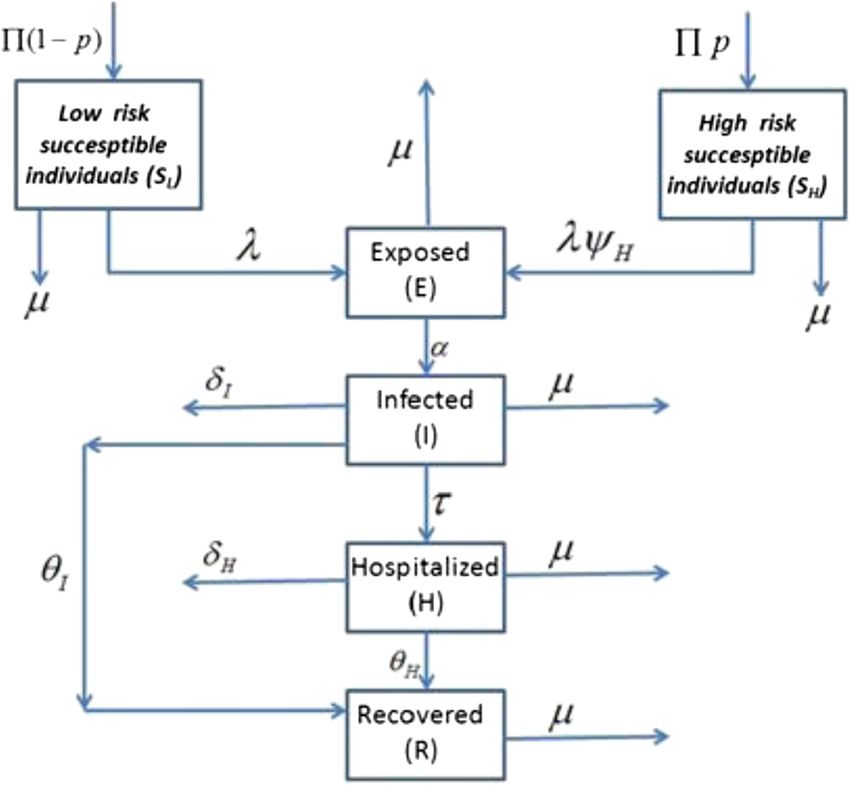
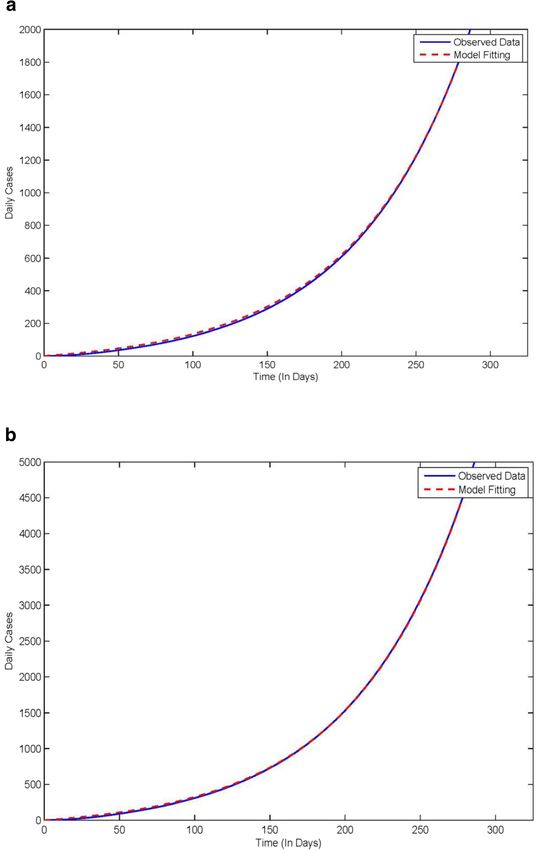
Khan et al. Infectious Diseases of Poverty (2015) 4:13                                                                     Page 5 of 8

well as health care workers. This indicates that high-risk               Moreover only 45% of the infected and 50% of hospital-
individuals are more likely to get infected as compared to               ized individuals recover from the disease. The death rates
low-risk individuals. Its value lies between 1.5 and 2. The              of the infected and hospitalized individuals, δI and δH, are
average time from hospitalization to recovery and from                   0.10 and 0.5, respectively. Of the infected individuals, 80%
infection to recovery is five and 10 days respectively.                  are hospitalized, and on average, hospitalization lasts four

 Figure 2 Shows data fitting using model for Ebola cases in Liberia. a: Uncorrected cases b: Corrected cases.
Khan et al. Infectious Diseases of Poverty (2015) 4:13 Page 6 of 8
to five days after getting infected. These parameter values susceptible individual occurs, and the probability that such
are taken from [11,12,20,21]. The assigned values are sum- contact will lead to an infection, is extremely difficult to
marized in Table 1 below. All rates are defined per day ex- determine directly. Therefore, we adopt an indirect ap-
cept for μ. proach, similar to previous studies such as [22] and [23],
by first finding the value of parameter β for which Model
Estimation scheme 1 has the best agreement with the epidemic data, and then
In order to calculate R0, we use parameter values for using the resultant parameter values to estimate R0.
Model 1 as stated in Table 1 in the previous section. The Furthermore, we require knowledge of the initial con-
estimates for several of the model parameters used in ditions to be used for simulation of the trajectories of
model (1) have been obtained from existing studies on Model 1. It is possible to consider the initial conditions
EVD. The effective contact rate β, which is a measure of (SL(0), SH(0), E(0), I(0) H(0),R(0)) as model parameters,
the rate at which contact between an infected and a along with the effective contact rate and estimate values
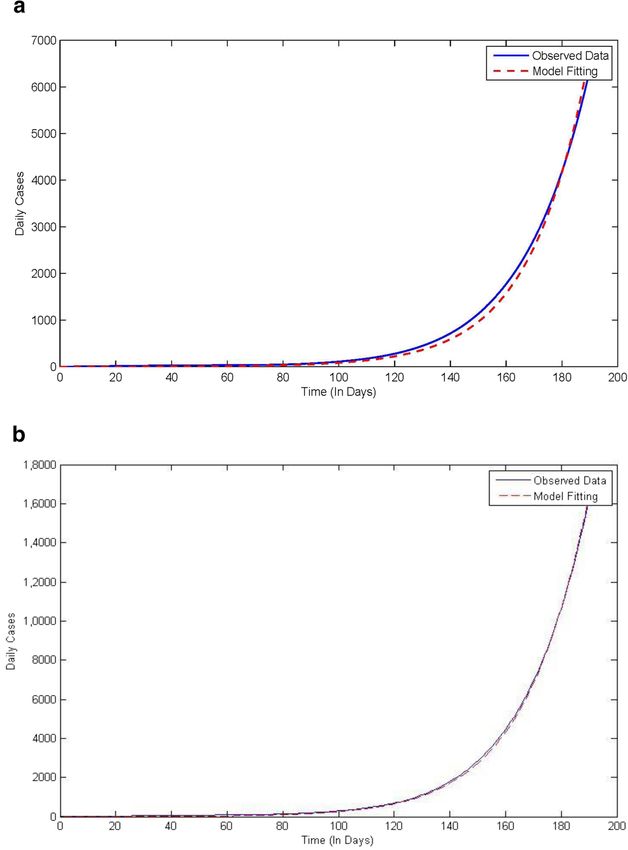
Figure 3 Shows data fitting using mathematical model for Sierra Leone. a: Uncorrected cases. b: Corrected cases.Khan et al. Infectious Diseases of Poverty (2015) 4:13 Page 7 of 8
for all parameters. Such a technique, however, produ-
ces slightly unreliable results. This is explained by the
fact that the available epidemic data is restricted to the
reported cumulative case number, while the optimiza-
tion scheme that we employ produces estimates for six
variables.
There are thus too many degrees of freedom and the
‘best-fit’ may result in unrealistic estimates for the initial
conditions used. We use the number of cases first re-
corded as the initial conditions and restrict ourselves to
optimizing only the effective contact rate. The following
initial conditions were used; SH(0) = 20000, SL(0) = one
million, E(0) = 15, I(0) = 10, H(0) = 0, and R(0) = 0. This
initial data is based on the fact that the total population in
the region that was under threat of Ebola was one million.
Among this population, 2% are at high-risk. Initially there Figure 4 Contour graph of the effectiveness of high-risk
were only a few exposed and infected individuals, and no individuals versus a fraction of individuals at high risk.
hospitalized or recovered individuals.
In the following section we employ ordinary least
squares (OLS) estimation to estimate the parameter β by Discussion and conclusion
minimizing the difference between predictions of Model We have developed a model for the transmission dyna-
1 and the epidemic data. This is implemented by using mics of EVD, incorporating the important factor of the
the fminsearch function in the built-in optimization tool- individuals who are at a much greater risk of contracting
box in MATLAB. The function fminsearch searches the the disease than the general population in the affected
minimum of a function of several variables. An initial areas. These include frontline health-care workers, family
guess of the variables is provided. Then, by using that members of EVD patients, and individuals involved in the
guess, it searches for the values that are local minimizers burial process of deceased EVD patients.
of the function. This allows us to estimate the parameter Using data from the WHO and CDC, we have calcu-
β in order to calculate R0. lated estimates for Liberia and Sierra Leone for the on-
going EVD outbreak. The values are significantly above
Results 1, indicating the severity of the disease. The estimated
As described in previous section, we fitted the two dif- values for Liberia are consistent with published estimates
ferent data sets, with and without correction for under for the current outbreak [11,20,24], while those for Sierra
reporting, for Liberia and Sierra Leone. Figure 2a shows Leone are consistent with Nishiura et al., however another
the fit for the uncorrected Liberia data until October 1st,
2014 for which β is 0.371 and R0 is 1.757. Figure 2b
shows the fit for the corrected Liberia data until October
1st, 2014 for which β is 0.3906 and R0 is 1.9.
For Sierra Leone, β is 0.361 and R0 is 1.492, as shown
in Figure 3a for the uncorrected case. After correcting
for under-reporting, β becomes 0.344 and R0 is 1.3682,
as shown in Figure 3b.
Finally, we study the variation in R0 with the relative
risk of the highly susceptible population group and its
percentage in the total susceptible population group. We
note that less than 10% of the susceptible population
should be in the high-risk group in order to bring R0 to
less than 1. This is shown in Figure 4 below.
We also use our model to study the effects of isolation
on R0. As shown in Figure 5 we note that not only does
isolation have to be very effective, reducing the infecti-
vity to less than 0.25, but at the same time around 45%
Figure 5 Contour graph of the hospitalization rate versus the
or more of the population has to be isolated in order to
effectiveness of isolation.
bring R0 to a value less than 1.Khan et al. Infectious Diseases of Poverty (2015) 4:13 Page 8 of 8
recent study [8] estimated that R0 in this country is 2.53, References
which is significantly greater. 1. Brief General History of Ebola, 29 Oct 2014 https://web.stanford.edu/group/
virus/filo/history.html.
We have also looked at the effect of interventions to 2. Haradhan M. The most fatal 2014 outbreak of ebola virus disease in Western
control the outbreak. In absence of any vaccine or medi- Africa. Am J Epidemiol Infect Dis. 2014;2(4).
cation for EVD, the only control measure available is 3. Derek G. The 2014 Ebola virus disease outbreak in West Africa. J Gene
Virolog. 2014;95:1919–24.
isolation. Ideally during isolation strict control should be 4. Moran KI. What do we really fear? The epidemiological characteristics of
in place so that the isolated individuals do not transmit Ebola and our preparedness. Epidemiol Health KAMJE, 2014;36.
the disease. However, in practice, there is a non-zero risk 5. Ebola mapping the outbreak, BBC News Africa, BBC Web 29 Oct 2014.
http://www.bbc.com/news/world-africa-28755033.
of transmission from isolated individuals. Our analysis 6. Ebola (Ebola virus disease) Transmission. Cent Dis Contr Prev, 20 Nov 2014.
suggests that in order for R0 to reduce to less than 1, the http://www.cdc.gov/vhf/ebola/transmission/index.html.
transmission rate of the isolated individuals should be 7. Thomas S: Mathematical analysis of the West Africa Ebola outbreak. Res
Gate. Oct 2014. doi:10.13140/2.1.2295.5527.
less than one quarter of that for the non-isolated. This 8. Camachoa A, Kucharski J, Funka S, Bremanb J, Piot P, Edmunds WJ. Potential
means that strict protocols should be followed at treat- for large outbreaks of Ebola virus disease. Epedemics. 2014;154:70–8.
ment facilities. Further analysis of the model also leads 9. Lekone PE, Finkenstdt BF. Statistical inference in a stochastic epidemic
SEIR model with control intervention: Ebola as a case study. Biometrics.
to the conclusion that the fraction of high-risk individuals 2006;62(4):1170–7.
has to be controlled and must be brought to less than 10% 10. Chowell G, Hengartner NW, Castillo-Chavez C, Fenimore PW, Hyman JM. The
of the overall susceptible population in order to bring R0 basic reproductive number of ebola and the effects of public health measures:
the cases Of Congo and Uganda. J Theor Biol. 2004;229(1):119–26.
to less than 1 and hence control the outbreak. 11. Chowell G, Nishiura H. Transmission dynamics and control of Ebola virus
Our model is an attempt to capture the most impor- disease (EVD): a review. BMC Med. 2014;12(196):1–12.
tant features of the transmission dynamics of EVD. As 12. Legrand J, Gais RF, Boelle PY, Valleron AJ, Flahault A. Understanding the
dynamics of Ebola epidemics. Epidemiol Infect. 2007;135(4):610–21.
an extension of this work, optimal, time-dependent stra- 13. Tambo E, Xiao-Nong Z. Acquired immunity and asymptomatic reservoir
tegies should be developed and advised to public health impact on frontline and airport ebola outbreak syndromic surveillance and
authorities in order to control the disease. response. Infect Dis Pov. 2014;3(41):1–10.
14. KY Lai, WYG Ng, FF Cheng: Human Ebola virus infection in West Africa: a
review of available therapeutic agents that target different steps of the life
cycle of Ebola virus. Infect Dis Pov. 2014;3(43).
Additional file 15. E Tambo, EC Ugwu, JY Ngogang. Need of surveillance response systems to
combat Ebola outbreaks and other emerging infectious diseases in African
Additional file 1: Translation of the abstract into the six official countries. Infect Dis Pov. 2014;3(29).
working languages of the United Nations. 16. E Tambo. Non-conventional humanitarian interventions on Ebola outbreak
crisis in West Africa: health, ethics and legal implications. Infect Dis Pov.
2014;3(42).
17. Diekmann O, Heesterbeek JAP, Metz JAJ. On the definition and the
Abbreviations
computation of the basic reproduction ratio R0 in models for infectious
EVD: Ebola virus disease; CDC: Centers for disease control and prevention;
diseases. J Math Biol. 1990;35:503–22.
WHO: World Health Organization; SEIR: Susceptible-exposed-infected-
18. Heffernan JM, Smith RJ, Wahl LM. Perspectives on the basic reproductive
recovered; ODE: Ordinary differential equation; OLS: Oordinary least squares.
ratio. R Soc Pub. 2005;2(4):281–93.
19. Meltzer NI, Atkins CY, Santibanez S, Knust B, Petersen BW, Ervin ED, et al.
Competing interests Estimating the future number of cases in the Ebola epidemic – Liberia and
The authors declare that they have no competing interests. Sierra Leone. MMWR Surveill Summ. 2014;6.
20. Nishiura H, Chowell G. Early transmission dynmaics of eboal virus disease
(EVD), West Africa, March to August 2014. Eurosurveillance. 2014;19(36).
Authors’ contributions 21. Althaus CL. Estimating the reproduction number of Zaire ebolavirus (EBOV)
MI, AK and DA initiated and directed the research study. MI and AK during the 2014 outbreak in West Africa. PLOS Curr Outbr. 2014.
implemented algorithms, conducted programming and drafted the 22. Cintron A, Castillo-Chavez C, Bettencourt LM, Llyod AL Banks T. The
manuscript. MN wrote introduction, collected parameters, ran simulations, estimation of the effective reproductive Number from Disease outbreak
analyzed results, compared results with findings of other authors, and edited Data. Mathematical Biosciences and Engineering. 2009;6(2).
the manuscript. All authors read and approved the final version of the 23. Adnan K, Muhammad H, Imran M. Estimating the basic reproduction
manuscript. number for single-strain dengue fever epidemics. J Infect Dis Pov. 2014;3(1).
24. David F, Edwin K, Ashleigh T: Early epidemic dynamics of the West African
2014 Ebola outbreak: estimates derived with a simple two-parameter model.
Acknowledgements PLoS. 2014.
The authors would like to acknowledge CDC for providing case data used in
this research article.
Author details
1
Department of Mathematics, Lahore University of Management Sciences,
Lahore, Pakistan. 2Department of Mathematics, State University of New York
at Plattsburgh, Plattsburgh, NY, USA. 3Department of Mathematics, Waterloo
University, Waterloo, ON, Canada. 4Department of Mathematics and Natural
Sciences, GULF University for Science and Technology, Mubarak Al-Abdullah,
West Mishref, Kuwait.
Received: 14 December 2014 Accepted: 3 February 2015You can also read