A Well-Funded Canadian Developer and Explorer - Building a Copper Mining Company in the Largest VMS District in the World CSE:RCLF Summer 2019
←
→
Page content transcription
If your browser does not render page correctly, please read the page content below
Snow Lake, Manitoba, Canada

A Well-Funded Canadian Developer and Explorer
Building a Copper Mining Company in the Largest VMS District in the World

                                                                       CSE:RCLF

                                                                Summer 2019
Disclaimer
           This Presentation includes certain "forward-looking statements" which are not comprised of historical facts. Forward-looking statements include estimates
           and statements that describe Rockcliff Metals Corporation’s future plans, objectives or goals, including words to the effect that Rockcliff Metals Corporation
           or management expects a stated condition or result to occur. Forward-looking statements may be identified by such terms as “believes”, “anticipates”,
           “expects”, “estimates”, “may”, “could”, “would”, “will”, or “plan”. Since forward-looking statements are based on assumptions and address future events and
           conditions, by their very nature they involve inherent risks and uncertainties. Although these statements are based on information currently available to
           Rockcliff Metals Corporation, Rockcliff Metals Corporation provides no assurance that actual results will meet management’s expectations. Risks,
           uncertainties and other factors involved with forward-looking information could cause actual events, results, performance, prospects and opportunities to
           differ materially from those expressed or implied by such forward-looking information. Forward looking information in this Presentation includes, but is not
           limited to, Rockcliff Metals Corporation’s objectives, goals or future plans, statements, exploration results, potential mineralization, the estimation of mineral
           resources, exploration and mine development plans, successful exploration results, successful categorization of mineral resources into mineral reserves,
           successful development of a feasibility study, timing of the commencement of operations and estimates of market conditions. Factors that could cause actual
           results to differ materially from such forward-looking information include, but are not limited to failure to identify mineral resources, failure to convert
           estimated mineral resources to reserves, the inability to complete a feasibility study which recommends a production decision, the preliminary nature of
           metallurgical test results, delays in obtaining or failures to obtain required governmental, environmental or other project approvals, political risks, inability to
CSE:RCLF

           fulfill the duty to accommodate First Nations and other indigenous peoples if potential issues arise, uncertainties relating to the availability and costs of
           financing needed in the future, changes in equity markets, inflation, changes in exchange rates, fluctuations in commodity prices, delays in the development
           of projects, capital and operating costs varying significantly from estimates and the other risks involved in the mineral exploration and development industry,
           and those risks set out in Rockcliff Metals Corp.’s public documents filed on SEDAR. Although Rockcliff Metals Corporation believes that the assumptions and
           factors used in preparing the forward-looking information in this Presentation are reasonable, undue reliance should not be placed on such information,
           which only applies as of the date of this presentation and no assurance can be given that such events will occur in the disclosed time frames or at all. Rockcliff
           Metals Corporation disclaims any intention or obligation to update or revise any forward-looking information, whether as a result of new information, future
           events or otherwise, other than as required by law.

           Cautionary Note to Investors Concerning Estimates of Historical, Inferred and Indicated Resources

           This presentation uses the terms Historical, Inferred and Indicated Resources. Investors (Canadian and U.S.) are advised that while such terms are recognized
           and required by Canadian regulations, the Securities and Exchange Commission does not recognize them. Historical and Inferred Resources have a great
           amount of uncertainty as to their existence, and great uncertainty as to their economic and legal feasibility. It cannot be assumed that all or any part of an
           historical or Inferred Resource will ever be upgraded to a higher category. Under Canadian rules, estimates of Historical and Inferred Resources may not form
           the basis of feasibility or other economic studies. Both U.S. and Canadian investors are cautioned not to assume that all or any part of Historical, Inferred or
           Indicated Resources will ever be converted into Reserves and will become upgraded into an economically or legally mineable deposit. Neither Rockcliff Metals
           Corporation nor its Qualified Persons have done sufficient work to classify the historic estimates in this presentation as current mineral resources under
           current mineral resource or mineral reserve terminology and are not treating the historic estimates as current mineral resources. The historical resources in
           this presentation should not be relied upon.

           Ken Lapierre P.Geo., VP Exploration of Rockcliff Metals Corporation, a Qualified Person in accordance with Canadian regulatory requirements as set out in NI
           43-101, has read and approved the scientific and technical information that forms the basis for the disclosure contained in this presentation.
  2
Investment Thesis
           Why Rockcliff?

              A well-funded junior explorer and emerging copper producer with the largest land
                             position in the prolific Snow Lake camp in Manitoba

                        Significant land package in prolific Snow Lake district
                        • >4,250 km2 of highly prospective land
                  1     • Advanced exploration assets with a focus on copper and zinc
                        • Blue sky exploration potential in underexplored Snow Lake South
CSE:RCLF

                        Established resource base with clear plan for growth
                        • Eight high-grade VMS deposits with substantial upside potential
                  2     • Near-term production potential following two PFSs in 2020
                        • Fully permitted mill with large bulk sample planned in 2021

                        Team well-funded with established private equity backing
                        • Proven mine builders and finders
                  3     • ~C$28 million in cash
                        • >100,000 m, minimum 5-rig drill program underway

  3
Corporate Timeline
           Creation of New Rockcliff

                                   Building a quality portfolio and attracting strong partners
            2006 to 2018 – Rockcliff is
            focused in Flin Flon / Snow
            Lake Mining Camp
            completing ~90,000 m of                                    February 2019 – announces
            drilling and establishing 3                                up to $30M financing
            VMS deposit resource                                       package led by Greenstone;
            estimates                                                  acquisition of Tower and
                                          September 2018 – acquires    Talbot projects and 1,000+   June 2019 – acquires
                                          115,000+ ha in Snow Lake     tpd Bucko Mill lease from    25,000+ ha in Snow Lake
CSE:RCLF

                                          South (SLS#1 and SLS#2)      Norvista Capital             South (SLS#5)

               April 2018 – options Laguna         January 2019 – acquires      May 2019 – Rockcliff          2019 to 2020 – >100,000 m
               and Lucky Jack gold                 174,000+ ha in Snow Lake     resumes trading; welcomes     drilling planned, split between
               properties to Kinross Gold          South (SLS#3 and SLS#4);     Alistair Ross as CEO          resource development and
               with Rockcliff as operator          acquires VMS Ventures                                      exploration with goal to advance
                                                   property portfolio in Snow                                 2 projects to production decision
                                                   Lake from RNC Minerals                                     stage, supported by 1,000 tpd
                                                   including significant                                      mill lease to fast-track to
                                                   assessment credits                                         production, while still targeting
                                                                                                              potential new large discoveries in
                                                                                                              an underexplored part of the
                                                                                                              Snow Lake camp
  4
Capital Markets Profile
           Substantial Cash Position and Cornerstone Investor
           Capital Structure                                                         Share Ownership
           Ticker                                                        CSE:RCLF
           Share Price (as of July 31, 2019)                               C$0.11
                                                                                                                               Norvista
           52-Week Range                                           C$0.07 – C$0.19                    Retail & Other           Capital
                                                                                                          28.1%                 27.4%
           Basic Shares Outstanding                                       307.6M Management
                                                                                   & Other
              Options (weighted avg. strike price of ~C$0.15)              12.3M
                                                                                   Insiders                       Greenstone
              Warrants (weighted avg. strike price of ~C$0.21)             26.3M     1.4%                          Resources
                                                                                                                     43.1%
           Fully Diluted Shares Outstanding                               346.2M
CSE:RCLF

           Market Capitalization (Basic)                                 C$32.3M
           Cash                                                         ~C$28.0M
           Enterprise Value                                              ~C$4.3M

                                                    Share Price Performance (Last 12 Months)

                                                                                              Trading Halt

                                                     Greenstone
                                                    Investment /
                                                       Norvista
                                                     Transaction
                                                     Announced

  5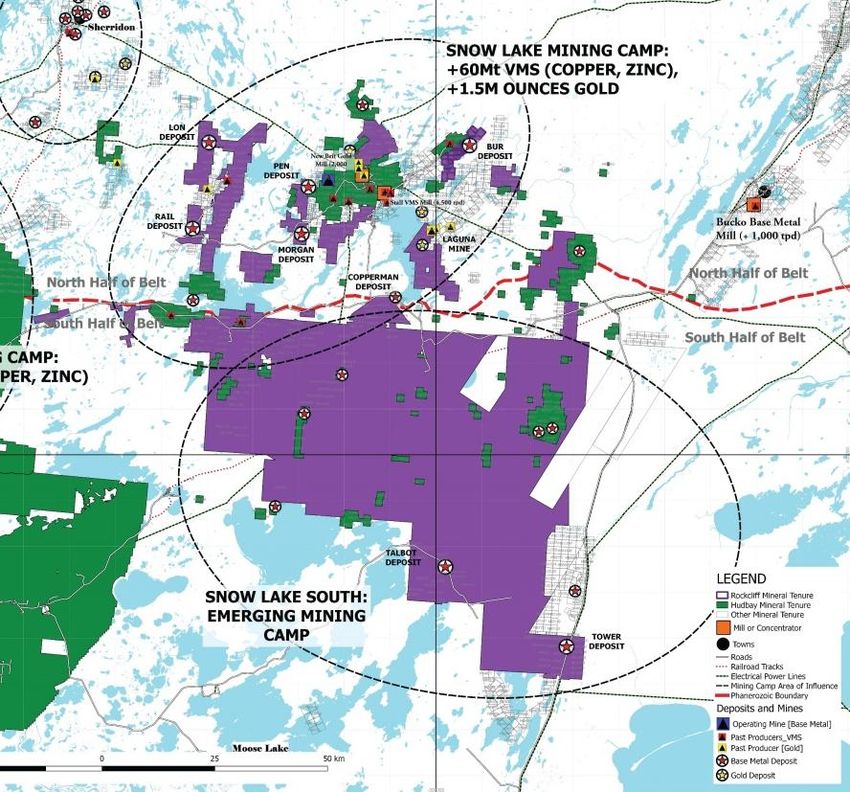
Key Personnel
           New Team to Drive Growth

                      Alistair Ross           Kenneth Lapierre
                                                                          Aamer Siddiqui          William Johnstone
                    President & CEO,          VP Exploration &
                                                                           Interim CFO            Corporate Secretary
                        Director                  Director

                   Seasoned leader in                                   Chartered Professional
                                             Professional Geologist
                 technological advances,                                 Accountant providing
                                            and Founder of Rockcliff                                  Over 30 years
                  operations and human                                      CFO, accounting,
                                              Metals with over 30                                 experience in Canadian
                    resources. Former                                   regulatory compliance,
                                               years in the junior                               securities and corporate
                 Director of Mining, Vale                                  and management
                                               resource business                                 law, partner at Gardiner
                     Canada. Former                                       advisory services to
CSE:RCLF

                                               focusing on metal                                  Roberts LLP since 2005
                 President of Lonmin plc,                              issuers on the Canadian
                                             discovery and finance
                       South Africa                                        and US exchanges

                     Mark Sawyer              Donald Christie              Petra Decher            Mike Romanuik
                      Director               Chairman, Director        Independent Director      Independent Director

                      Co-founder of                                    Director of Coro Mining
                                              President & CEO of                                 Mining, milling, smelting
                 Greenstone Resources; a                                    and Ascendant
                                              Norvista Capital and                                specialist. Operations
                   Tier-1 Private Equity                                Resources, former VP
                                                Former CFO of                                       Lead and Project
                    Mining and Metals                                    Finance with Franco
                                               Continental Gold                                  Manager at Stantec Inc.
                         Company                                             Nevada Corp

  6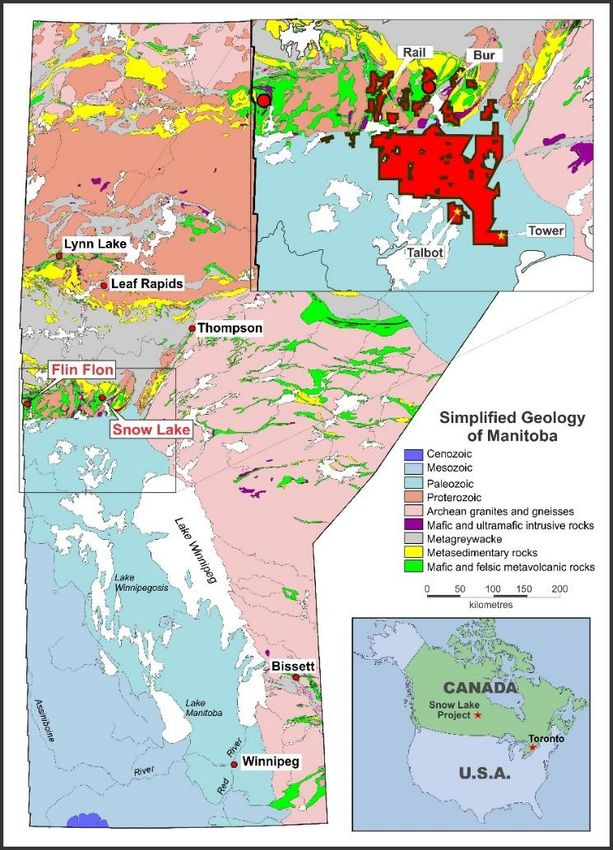
Flin Flon – Snow Lake Greenstone Belt
           Rockcliff is a ‘New’ Significant Player
CSE:RCLF

                 Hudbay Minerals                         Rockcliff Metals
              >5,000 km2 in Flin Flon                >4,250 km2 in Snow Lake
                      Camp                                   Camp

  7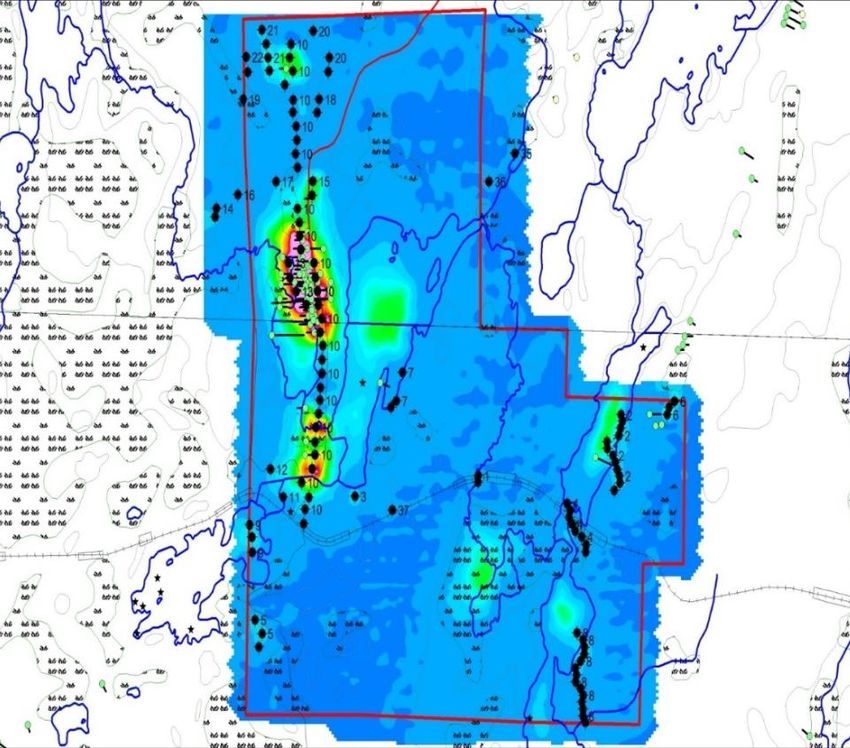
Flin Flon – Snow Lake Greenstone Belt
           History of Exponential Mine Growth Throughout the Belt
                   Belt has delivered additional tonnage well beyond initial reserves (and resources)

                               Mineral Reserves in the Flin Flon – Snow Lake Camp
CSE:RCLF

                                                                           *RCLF’s Talbot Property
                                                                          Resource stands at 4.2Mt:
                                                                         represents 3rd largest initial
                                                                        resource prior to a production
                                                                        decision (Flin Flon#1, Lalor#2)

  8        Source: Hudbay Minerals Investor Presentation (June 2019)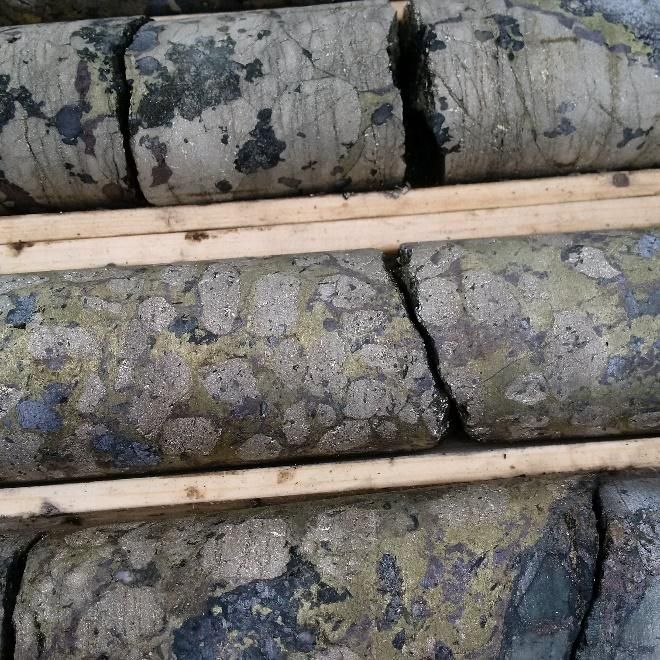
Flin Flon – Snow Lake Greenstone Belt
Production Growth in Belt to Come from Snow Lake
Hudbay shifting focus from Flin Flon to Snow Lake driven by Lalor Mine
2007: Lalor discovered Acquired Wim deposit
2010: Copper smelter at Flin Flon Reed Mine closure 2018
closes 2019: New Lalor mine plan out to
2012: First production at Lalor (Snow 2028, doubling of annual gold
Lake) production with refurbishment of New
2014: Lalor phase 2 mine construction Britannia Mill (spending C$124M for
CSE:RCLF
complete; Snow Lake concentrator 2022 start); satellite deposits being
refurbished (Stall Mill) (now 3,000 tpd targeted (Wim, Pen II)
for Zn and Cu concentrates) Zone 1901 deposit discovered
2015: Purchased New Britannia mine 2022: 777 Mine reserves in Flin Flon
and mill (for Au/Cu-Au feed from Lalor will be depleted, Flin Flon Mill to be
rather than transporting to Flin Flon) – placed on care and maintenance
Kinross a former operator
2018: Test mining of Lalor gold zone
begins
C$14 million spent on airborne and
ground geophysics
9 Source: Hudbay Minerals Snow Lake Site Visit Presentation (April 2019)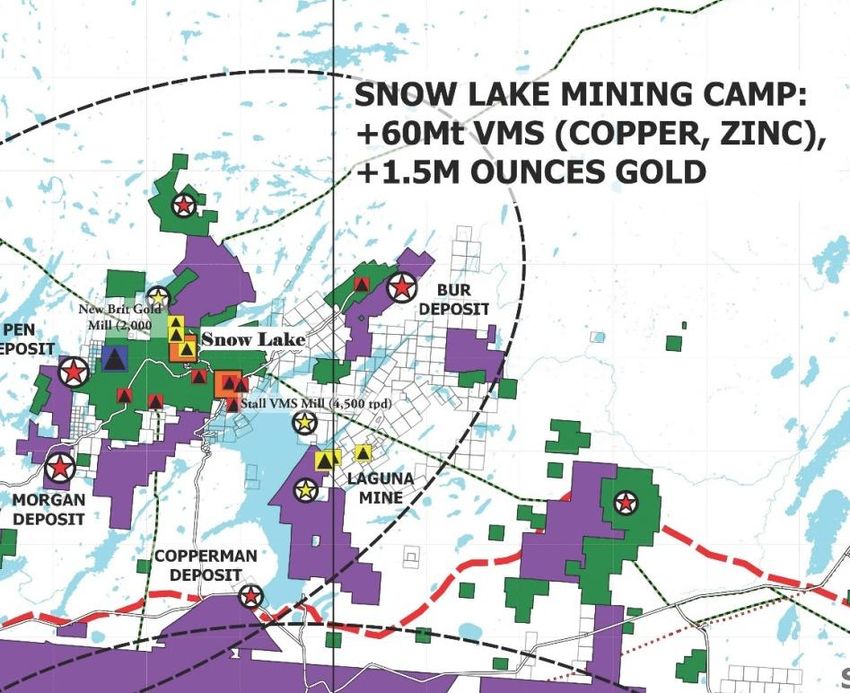
Base Metal Portfolio
           Key Areas for Value Creation

                                       To increase                                                     Advancing
            To discover the           resources and                      Rail not far                  Tower and
              next +20Mt                completed                       behind Tower                 Talbot toward             Bucko Mill Key
            deposit in Camp           43-101 studies                     and Talbot                   production                 to Growth
                                                                                                                                  Strategy
                                                                                  PROJECT
                            BLUE SKY                   RESOURCE                  DEFINITION              HUB & SPOKE
                          EXPLORATION                   GROWTH                                           PRODUCTION
                         ~20,000 m budgeted        ~40,000 m budgeted          ~40,000 m budgeted
CSE:RCLF

                                                            Rail                Tower (Production
                                                                                 decision H1/20)             Bucko Mill
                                 SLS #1                                                                      1,000+ tpd
                                 SLS #2                     Bur
                                 SLS #3                                                                     Mine site ore
                                 SLS #4                  Copperman              Talbot (Production
                                                                                 decision H1/20)          sorting to be used
                                 SLS #5                                                                      to minimize
                              Last Harrah               Lon / DC Zone
                                                                                                         transportation and
                               Tramping                      Pen
                                                                                                             milling costs
                                                           Morgan
                                                          Freebeth

                                                       Base Metal
                                                       Properties
 10
Hub and Spoke / Project Definition
Advanced Base Metal Deposits and Mill
Hudbay Minerals Tower Copper Deposit (100%)
>5,000 km2 in Flin Flon Rockcliff Metals • Planned drilling and production
Camp >4,250 km2 in Snow decision to be made by Q1/20
Lake Camp • Fully permitted by Q4/19 for 50,000
tonne bulk sample
• Target of 3.5 Mt @ 4.0% CuEq
Talbot Copper Deposit (earning
51%)
• Earning interest from Hudbay
CSE:RCLF
• Planned drilling and production
decision to be made by Q2/20
• Target of 4.0 Mt @ 3.5% CuEq
Rail Copper Deposit (100%)
• Drilling planned by Q3/19
• Potential to catch up to Tower and
Talbot in production sequencing
• Target of 3.0 Mt @ 4.0% CuEq
Bur Zinc-Copper Deposit
(earning 100%)
• Drilling planned by Q3/19
Bucko +1,000 tpd Processing Facility • Target of 5.0 Mt at
• Leased, fully permitted world-class zinc-copper grades
• Replacement cost ~ $50M
11Tower Property
Asset Summary
Ownership • 100% owned by Rockcliff Bucko Mill
125 km
Location • 9,530 ha property
• Southeast extent of known Snow Lake camp
• Located 125 km from Bucko Mill
Tower • Sulphide Cu-Zn-Au-Ag deposit
Deposit • Extends over ~800 m length, ~2 m average width
and to depth of ~570 m
• Remains open at depth and along strike
CSE:RCLF
Current • 2019 drill program of 16,600 m
Work Plan • Fully permitted by Q4/19 Tower Deposit
• Bulk sample in 2020
• Production decision to be made by Q1/20
• Target of 3.5 Mt @ 4.0% CuEq
T-1 Deposit Tonnes Grade Contained Au+Ag
Zn 10%
100% owned (Mt) (CuEq %)* (M lbs CuEq)* 11%
Indicated 1.08 4.55 108.8
Inferred 1.25 2.55 70.47
*In-situ Copper-equivalent (CuEq) calculations based on US$3.63/lb Cu,
US$1.15/lb Zn, US$1,300/oz Au and US$20.00/oz Ag
Source: NI 43-101 Technical Report, Tower Property – Manitoba, Canada Cu
(March 18, 2019) 79%
12Tower Property
High-Grade Copper Deposit with Upside
Tower deposit hosted within ~12 km long copper corridor
• NI 43-101 compliant
resource completed in 2013 Tower Deposit
• Significant Tower copper
corridor – ~12 km strike
virtually untested by drilling
CSE:RCLF
• Potential expansion
opportunities: present
resource, within corridor
and additional nearby Tower Copper Corridor
anomalies
• 16,600 m drill program
planned for 2019
• Conceptual target: >3.5 Mt
at +4.0% CuEq Indicated & Inferred resource: ~2.3 Mt @ 3.6% CuEq*
*Please refer to the cautionary information on current resource estimates in Appendix
13Talbot Property
Asset Summary
Ownership • Rockcliff can earn a 51% interest from Hudbay by
Bucko Mill 165 km
spending ~C$6.1M over six years (~C$4.0M spent
to date)
Location • 12,045 ha property
• Southeast extent of known Snow Lake camp
• Located ~40 km northwest of Tower and ~165 km
from 1,000+ tpd Bucko Mill
Talbot • Gold rich Copper VMS deposit
Deposit • One main lens – average thickness of over 7 m Talbot Deposit
CSE:RCLF
• Open in all directions and is located proximal to
numerous untested pulse and bore hole
geophysical anomalies
Current • Planned drilling to earn 51% complete Q4 2019
Work Plan and production decision to be made by Q2/20
• Target of 4.0 Mt @ 3.5% CuEq
Zn
Talbot Deposit Tonnes Grade Contained 15%
100% basis (Mt) (CuEq %)* (M lbs CuEq)* Cu
Inferred 4.23 3.67 342.6 46%
*Copper-equivalent (CuEq) calculations based on US$3.00/lb Cu, US$1.15/lb
Zn, US$1,350/oz Au and US$15.00/oz Ag. Recoveries of 90% copper, 90% zinc,
70% gold, 70% silver used
Source: Independent Technical Report for the Talbot Polymetallic Project, Au+Ag
Manitoba, Canada (January 19, 2018) 39%
14Talbot Property
Rare High-Grade Gold Tenor Copper VMS Deposit
• Deposit hosts high-grade High-grade lens near surface (looking west)
copper core averaging
5.0 m thick
Talbot Deposit
• Only 2 of the 30 VMS mines
in belt had an initial
CSE:RCLF
resource greater than the
Talbot deposit
• ~20,000 m drill program
planned Q3-2019 followed
by PFS and planned to be
fully permitted by Q4/20
• Remains open for expansion
with multiple untested
conductive plates Inferred Resource: ~4.2 Mt @ 3.5% CuEq*
*Please refer to the cautionary information on current resource estimates in the appendix for the Talbot Deposit
15Talbot Property
Cross Section and Drill Results
Talbot property hosts continuous, thick and predictable VMS mineralization
Talbot Deposit Significant Intervals and Grades
Drill
Copper Gold Zinc Silver
Width
(%) (g/t) (%) (g/t)
(m)
CSE:RCLF
14.1 2.4 1.1 3.5 36.0
6.3 2.7 1.1 3.5 41.7
9.3 6.1 8.4 5.0 112.1
13.8 2.6 1.6 1.5 30.9
18.4 1.7 1.1 1.7 25.1
16.1 0.9 2.7 0.7 15.2
24.6 5.4 4.6 1.5 77.5
Talbot
Deposit 5.6 2.6 2.9 1.7 23.0
7.3 2.1 1.1 0.4 22.5
16Rail Property
Asset Summary
Ownership • 100% owned by Rockcliff Metals Corp. VTEM anomaly
• Property subject to a 2.0% NSR
~5 km long
Location • ~2,000 ha property located ~40 km by road SW of copper corridor
Snow Lake, Manitoba
• Close to major mining centers of Flin Flon, Snow
Lake and Thompson Rail Deposit
• ~160 km from Bucko Mill
Rail Deposit • Stratabound Cu-Zn-Au-Ag VMS deposit
• Single lens, near-surface
CSE:RCLF
VTEM anomalies
• Numerous additional underexplored and untested
geophysical pulse and bore hole anomalies
• Open in all directions
Current • 10-12,000 meters of drilling planned by end 2019
Work Plan • Target of 3.0 Mt @ 4.0% CuEq
Rail Deposit Tonnes Grade Contained Zn
Au+Ag 9%
100% owned (Mt) (CuEq %)* (M lbs CuEq)*
13%
Indicated 0.82 3.89 70.5
Cu
78%
Copper-Equivalent (CuEq) grade based on US$3.00/lb, $1.15 Zn, $1300 Au,
$20 Ag Cu Recovery of 80% copper used
Source: Mineral Resource Evaluation, Rail Polymetallic Sulphide Deposit, Snow
Lake, Manitoba (December 19, 2010)
17Rail Property
Potential for Growth and Discovery
High-grade mineralization sub-cropping (looking west)
• Excellent potential for
resource expansion
and discovery Rail Deposit
• Historic drilling below
CSE:RCLF
deposit intersected
high-grade copper
associated with DPEM
anomaly
• Untested DPEM anomaly
continues below deposit to Deepest historic hole
minimum 1,000 m vertical @525m vertical:
2.1m @ 5.9% Cu
• 10,000 m drill program
planned for 2019 Indicated resource: ~0.8 Mt @ 3.89% CuEq*
*Please refer to the cautionary information on current resource estimates in the appendix for the Rail Deposit
18Bur Property
Asset Summary
Ownership • Option agreement with Hudbay Minerals whereby
Rockcliff can earn a 100% interest by spending
~C$3M over four years (~C$1M spent to date)
Location • 3,979 ha property strategically located ~22 km NE
of Hudbay's Snow Lake copper-zinc concentrator
Bur Deposit
and ~28 km from the town of Snow Lake
Bur Deposit • High-grade, zinc-copper rich, stratiform VMS
deposit
• Historical deposit thickness ranging from 0.3 m to
CSE:RCLF
5.0 m thick
• Open in multiple directions, ~800 m along strike
and to depths of ~1,000 m below surface
Current • 11,000 meters of drilling planned by Q3/19
Work Plan • Target of 5.0 Mt at world-class zinc-copper grades
Au+Ag
• Assess copper-rich zone within deposit 2%
Bur Deposit Tonnes Grade Contained
Cu
100% basis (Mt) (ZnEq %)* (M lbs ZnEq)* 34%
TOTAL 1.35 13.67 308.9
Zn
*In-situ Zinc-Equivalent (ZnEq) calculations based on US$2.35/lb Cu, 64%
US$1.15/lb Zn, US$1,300/oz Au and US$20.00/oz Ag.
Source: Bur Project, Snow Lake Manitoba, Canada NI 43-101
Technical Report (October 1, 2007) not filed on Sedar
19Bur Property
High-Grade Zinc and Copper Deposit
• Portal completed in 2007 High-grade zone at surface (looking north-west)
• Recently completed drill
highlights include: Surface
‒ 18.0% ZnEq over 5.7 m
CSE:RCLF
‒ 20.1% ZnEq over 2.7 m Cu rich
‒ 15.0% ZnEq over 4.4 m area
Cu rich
• High grade mineralization area
extends over 800 m along
strike immediately south of
deposit within an ~8 km
long mineralized horizon
Scale 1:2500
• 10,000 m planned in Q3/19 Cu rich
area
• Conceptual target: >5.0 Mt
at +13% ZnEq (+5% CuEq) Historic resource: ~1.4 Mt @ 12.8% ZnEq (4.9% CuEq)*
*Please refer to the cautionary information on current resource estimates in the appendix for the Bur Deposit
20Bucko Lake Mill
Overview
Fully permitted +1,000 tpd base metals mill and tailings ponds
• Located near Wabowden, Manitoba
• +1,000 tpd milling and tailings storage
facility commissioned in 2008 for nickel
sulphide concentrate
• Grinding circuit consists of rod mill / ball
CSE:RCLF
mill combination
New Photo (one)?
• Flotation circuit consists of five DR style Add standard map,
rougher cells (300 ft3 capacity) and five suggest road
DR style cleaners (100 ft3 capacity) network being more
prominent
• 7-year processing lease in place with
CaNickel Mining Ltd.
• Estimated replacement cost of C$50M
21Bulk Sample Permitting Process / Timeline
Environmental Stakeholder Advanced
CSE:RCLF
Baseline sampling
Assessments Engagement Exploration Permit
performed
Tower Completed Tower Planned (Bulk Sample)
springtime
2019 Q2 2020 Tower Q2 2020
Tower 2018
Talbot and Rail to be Talbot and Rail Talbot and Rail
Talbot and Rail 2019
completed 2020 Q3 2020 targeted Q4 2020
22Potential Target Size and Resource Growth
Adding Resources Through the Drill Bit
Aiming to more than double current high-grade resources
Potential
Historical Size Current Size Grade Planned 2019-
Deposit Target Size*
(tonnes) (tonnes) (CuEq %) 20 Drilling (m)
(tonnes)
1,084,186 (Indicated) 4.5%
Tower (T-1) n.a. 15,000 3,500,000
1,253,522 (Inferred) 2.5%
Talbot 1,200,000 4,234,000 (Inferred) 3.5% 20,000 4,000,000
Rail 250,000 822,000 (Indicated) 3.9% 10,000 3,000,000
CSE:RCLF
Bur 1,352,000 1,352,000 (Historical) 4.9% 10,000 5,000,000
Copperman 250,000 250,000 (Historical) 4.3% 5,000 1,500,000
Morgan 272,000 272,000 (Historical) 7.9% 5,000 1,000,000
1,000,000 (Historical) 2,000,000
Pen n.a. 3.5% 5,000
(above 350 m) (below 350 m)
Lon 250,000 250,000 (Historical) 5.2% 5,000 2,000,000
1,906,186 (Indicated) 4.2%
22,000,000
Total 3,574,000 5,487,522 (Inferred) 3.3% ~100,000 m
(conceptual)
3,124,000 (Historical) 4.7%
Freebeth
Additional
Tramping n.a. n.a. n.a 20,000
upside
SLS Properties
*The potential target quantity is conceptual in nature and could require additional drilling to hit potential target thresholds. There has been insufficient
exploration to date to define a mineral resource and it is uncertain if further exploration will result in the target size being delineated as a mineral
23 resource. Statistically, in the camp, initial mine resources grow on average 2.5 times by the end of a mine life. Please refer to the cautionary information
in the appendix.Snow Lake South
Underexplored Below Limestone Cover
• Property portfolio
of >4,250 km2
• ~3,000 km2 under
cover
• Volumetrically
2/3rds of VMS
belt southward
buried by thin
CSE:RCLF
cover of
limestone
• Vastly
underexplored,
with the geology
under limestone
cover the same
as geology that
hosts mines
above limestone
cover
• 20,000 m planned
to test
undercover
targets
24Snow Lake South
Underexplored Below Limestone Cover
SNOW LAKE SNOW LAKE SOUTH (“SLS”)
New Britannia
Anderson
Chisel
Rod
Laguna
Spruce Pt.
Lalor
Harmin
Fenton
Talbot
Tower
Watts
Reed
CSE:RCLF
PHANEROZOIC COVER
• +60,000,000 tonnes mined (Copper, • +4,000,000 tonnes mined (Copper, Zinc, Gold Silver)
Zinc, Gold Silver) • Volumetrically more favorable VMS rocks below cover
• +2,000,000 Gold (Iode) • +20,000,000 tonnes in deposits under cover
- Mines - Deposits
25Investment Summary
Scratching the Surface of the Prolific Snow Lake Camp
✔ >4,250 km2 of highly prospective land in Snow Lake
✔ Largest ever +100,000 m drilling program underway
CSE:RCLF
✔ Eight high-grade VMS deposits with upside potential
✔ Planning to more than double current resources
✔ Near-term production potential at Tower/Talbot/Rail
✔ Fully cashed up with ~C$28 million in the treasury
26141 Adelaide Street West Alistair Ross Cathy Hume Suite 1660 President & CEO CEO, CHF Capital Markets Toronto, Ontario Email: aross@rockcliffmetals.com Email: cathy@chfir.com M5H 3L5 Mobile: (705) 507-4251 Main: (416) 868-1079 x231
CSE:RCLF

           Appendix

 28
Copper
An Essential “Green Energy” Metal
“Copper connects and delivers clean energy to a growing world for a renewable future”
Copper is the superior metal for solar, Breakdown of end uses of copper in the
wind, storage and EV technology United States (2018)
• Highly conductive, resistant to corrosion, 6%
100% recyclable 11%
44%
• 80% of copper ever mined still in use
CSE:RCLF
19%
• Average North American home contains
~500 lbs of copper
20%
• One wind turbine uses ~4.0 t of copper
• An additional ~860,000 t of copper will
be required to power 862 GW of new
solar installations to 2027 Building Construction
Transportation Equipment
• Average electric vehicle contains ~183 Electrical and Electronics
lbs of copper, which is four times greater Consumer Products
than a combustion vehicle
Industrial Machinery
Source: U.S. Geological Survey Mineral Commodity Summaries (2019 report)
29Copper
The Looming Supply Gap
Significant supply is required to meet demand – potentially significant crunch looming
Low risk appetite to build new mines Global copper production and primary demand
• Existing copper mines are expected to
come close to satisfying ‘primary
demand’ up until 2022
• A significant deficit opens up from 2023
CSE:RCLF
onwards unless projects in the
‘probable’ and ‘possible’ categories are
developed
• By 2028, the shortage is estimated at
~4.3 Mt assuming 70% of probable
brownfield projects and 50% of probable
greenfield projects are developed
• Long lead times required to bring new
mines into production means sustained
higher copper prices are needed
Source: Wood Mackenzie (December 2018)
30Flin Flon – Snow Lake Greenstone Belt
Home to World-Class VMS Mines
• Pro-mining jurisdiction – one of the top
rated jurisdictions in the world for
exploration and mining (Fraser Institute)
Rockcliff’s Snow
Lake Package
• High-grade mines – global CuEq grade is (red claim outline)
well below 1.0%, but averages well
above 3.0% CuEq in the Snow Lake belt
CSE:RCLF
• Elephant country – most prolific VMS
mining camp in Canada with +400 Mt of
total resources in 30 high-grade mines
and dozens of unmined deposits
• Longevity – over 100 years of
continuous production (on average a
new mine is discovered every 3 years)
• Infrastructure – low cost electrical
power, experienced mining workforce,
roads, rail, etc.
31Resource Summary
Global NI 43-101 & Historical Resources
Global NI 43-101 Compliant Indicated and Inferred Resources and Historical Resources*
Contained Grade (100% basis)
Category Tonnes Copper (%) Zinc (%) Gold (g/t) Silver (g/t)
Indicated (NI 43-101) 1,906,186 3.4 1.0 0.6 13.8
Inferred (NI 43-101) 5,487,522 1.7 1.3 1.4 23.8
Historical (Non NI 43-101) 3,917,055 1.1 8.4 0.4 7.2
Contained Metal (100% basis)
CSE:RCLF
Category Tonnes Copper (lbs) Zinc (lbs) Gold (oz) Silver (oz)
Indicated (NI 43-101) 1,906,186 142,802,705 42,601,790 39,414 848,812
Inferred (NI 43-101) 5,487,522 205,233,333 156,943,129 264,642 4,181,342
Historical (Non NI 43-101) 3,917,055 100,410,963 719,230,159 44,754 914,308
*Mineral and historical resources are not mineral reserves and have not demonstrated economic viability and should not be relied upon. The estimate of mineral and historical resources may
also be materially effected by other relevant factors or issues. There has been insufficient exploration to define these resources as reserves and further exploration may not upgrade any of
the individual deposits to a reserve. The resources above are an aggregate of resources controlled by the Company from nine deposits (Talbot, Tower, Rail, Bur, Morgan, Lon, MacBride,
Copperman and Pen) in central Manitoba where the Company’s ownership interests ranges from earning 51% up to 100% and owning 100%. The Talbot, Tower and Rail deposits are NI 43-101
Compliant and the Bur, MacBride, Morgan, Copperman and Lon deposits are historical. Please refer to the specific deposit resources in the appendix of this presentation. Copper and zinc
equivalent grades were estimated for historical resources using US$2.35/lb copper, US$1,300/oz gold, US$1.15/lb zinc and US$20.00/oz silver for the Bur deposit and US$2.50/lb copper,
US$1,300/oz gold, US$1.15/lb zinc and US$20.00/oz silver for the Lon, Morgan and MacBride deposits.
32Resource Summary
NI 43-101 & Historical Resources by Deposit
NI 43-101 Compliant Resources – CIM Standards Used (100% basis)
Deposit Ownership Tonnes Copper (%) Zinc (%) Gold (g/t) Silver (g/t)
Tower (T-1) – Indicated1 1,084,186 3.7 1.0 0.5 17.3
100%
Tower (T-1) – Inferred1 1,253,522 2.0 1.0 0.3 9.8
Talbot – Inferred2 51% earn-in 4,234,000 1.6 1.4 1.8 28.0
Rail – Indicated3 100% 822,000 3.0 0.9 0.7 9.3
Historical Resources (100% basis)4
Deposit Ownership Tonnes Copper (%) Zinc (%) Gold (g/t) Silver (g/t)
Morgan 100% 272,000 - 15.0 3.4 -
CSE:RCLF
Lon 100% 250,000 3.2 5.2 0.3 18.8
Copperman 100% 250,000 3.1 3.1 - -
Bur – Indicated 1,050,000 1.9 8.6 0.1 12.1
100% earn-in
Bur – Inferred 302,000 1.4 9.0 0.1 9.6
MacBride 100% 1,802,055 0.3 8.8 0.1 -
Pen 100% Unknown - - - -
1The Tower (T-1) deposit report completed by CCIC Inc. dated January 20, 2013 and press released December 6, 2012. CIM definitions were followed, 0.5% copper cut-off was used using
US$3.63/lb copper. Mineral Resources are not Mineral Reserves and do not have demonstrated economic value.
2 TheTalbot update resource memo completed by SRK dated December 1, 2017 and press released December 6, 2017. CIM definitions were followed, 2.0% copper cut-off was used with
US$3.00/lb copper, US$1,400/oz gold, US$1.20/lb zinc and US$20.00/oz silver. Metal recovery for copper was 90%, gold at 70%, zinc at 90% and silver at 70%. Mineral Resources are not Mineral
Reserves and do not have demonstrated economic value.
3The Rail deposit report completed by SRK Consulting dated December 19, 2010 and press released December 21, 2010. CIM definitions were followed, 2.0% copper cut-off was used with
US$3.00/lb copper and a metal recovery of 80% without considering revenues from other metals. Mineral Resources are not Mineral Reserves and do not demonstrate economic viability.
4 The Lon, Bur, Morgan, Copperman and MacBride deposits are historical deposits. The reader may refer to the Lon deposit press released October 31, 2007 and the Bur deposit press released
September 29, 2016 and the Morgan deposit press released November 22, 2016 and the MacBride deposit press released December 1, 2016. An internal report was completed by Granges Inc.
in 1993 for the Lon deposit, Manitoba Government reports in the 1990s for the Morgan and Copperman deposits and an internal report by Knobby Lake Mines in 1977 for the MacBride deposit,
however not all of the parameters used, assumptions made and methods used to prepare the historic estimates are known at this time. A public report was completed by Hudbay in 2007 and
filed on SEDAR for the Bur deposit. Its parameters are known. Additional drilling would be required to upgrade all historical resources to a current Mineral Resource as the historic information
does not satisfy the requirements set out by NI 43-101. Neither Rockcliff Metals nor its Qualified Persons have done sufficient work to classify the historic estimates as current Mineral
Resources and are not treating the historical estimates as a current Mineral Resource. The reader is cautioned that the Lon, Bur, Morgan, Copperman and MacBride historical resources should
not be relied upon as they do not satisfy current Mineral Resource or Mineral Reserve terminology.
33Gold Prospects
In the Middle of a World-Class VMS Camp
Laguna and Lucky Jack (Kinross
earning 70%)
DSN SLG • Laguna is a historic mine with over
60koz produced at 20.5 g/t Au
• Lucky Jack has high-grade gold on
surface and in drill holes
Laguna/Lucky Jack • Trucking distance to Hudbay’s mill
Berry Creek • Kinross spending $5.5M over 6 years
CSE:RCLF
SLG (100%)
• Located north and adjacent to New
Britannia Mill
• Gold zones adjacent to 3 mines with
production totaling 1.4 million ounces
Berry Creek (100%)
• Located south of Hudbay’s core Snow
Lake ground including Lalor
• More high-grade showings
DSN Gold Property (100%)
• Located east of Lon deposit
• Extensive gold bearing fault
• High-grade gold at surface
• Underexplored
34You can also read


