Corporate Presentation - February 2021 - American ...
←
→
Page content transcription
If your browser does not render page correctly, please read the page content below

Corporate Presentation

February 2021
Important Information
The release, publication or distribution of this presentation in certain jurisdictions may be restricted by law and therefore persons in such jurisdictions into
which this presentation is released, published or distributed should inform themselves about and observe such restrictions.

DISCLAIMER
This presentation is for informational purposes only and does not constitute an offer to sell, or solicitation to purchase, any securities. Such Offer can be
made only through proper subscription documentation and only to investors meeting strict suitability requirements. Any failure to comply with these
restrictions may constitute a violation of applicable securities laws. In providing this presentation American Pacific Borates Limited ACN 615 606 114
and its subsidiaries (“ABR”) has not considered the financial position or needs of the recipient. Persons needing advice should consult their stockbroker,
bank manager, solicitor, attorney, accountant or other independent financial and legal advisors.

FORWARD LOOKING STATEMENTS
Various statements in this presentation constitute statements relating to intentions, future acts and events. Such statements are generally classified as
“forward looking statements” and involve known and unknown risks, uncertainties and other important factors that could cause those future acts, events and
circumstances to differ materially from what is presented or implicitly portrayed herein. Words such as “anticipates”, “expects”, “intends”, “plans”, “believes”,
“seeks”, “estimates” and similar expressions are intended to identify forward-looking statements. ABR caution shareholders and prospective shareholders not to place
undue reliance on these forward-looking statements, which reflect the view of ABR only as of the date of this presentation. The forward-looking statements made in this
presentation relate only to events as of the date on which the statements are made.

COMPETENT PERSON – FORT CADY
The information in this release that relates to Exploration Results and Mineral Resource Estimates is based on information prepared by Mr Louis Fourie, P.Geo of Terra Modelling Services. Mr
Fourie is a licensed Professional Geoscientist registered with APEGS (Association of Professional Engineers and Geoscientists of Saskatchewan) in the Province of Saskatchewan, Canada and a
Professional Natural Scientist (Geological Science) with SACNASP (South African Council for Natural Scientific Professions). APEGS and SACNASP are a Joint Ore Reserves Committee (JORC) Code
‘Recognized Professional Organization’ (RPO). An RPO is an accredited organization to which the Competent Person (CP) under JORC Code Reporting Standards must belong in order to report
Exploration Results, Mineral Resources, or Ore Reserves through the ASX. Mr Fourie has sufficient experience which is relevant to the style of mineralisation and type of deposit under
consideration and to the activity which they are undertaking to qualify as a CP as defined in the 2012 Edition of the JORC Australasian Code for Reporting of Exploration Results, Mineral
Resources and Ore Reserves. Mr Fourie consents to the inclusion in this presentation of the matters based on their information in the form and context in which it appears.

The information in this release that relates to the conversion of Mineral Resources to Ore Reserves has been prepared by Tabetha A. Stirrett of RESPEC Consulting Inc. Mrs. Tabetha A. Stirrett, P.
Geo of RESPEC Consulting Inc. is a member in good standing of the Association of Professional Engineers and Geoscientists of Saskatchewan (Member #10699) and a member of the American
Institute of Professional Geologists (CPG) (#11581). APEGS and CPG are a Joint Ore Reserves Committee (JORC) ‘Recognised Professional Organization’ (RPO). Mrs. Stirrett has sufficient
Experience which is relevant to the style of mineralisation and type of deposit under consideration and to the activity which they are undertaking to qualify as a CP as defined in the 2012 Edition
of the JORC Australasian Code for Reporting of Exploration Results, Mineral Resource and Ore Reserves. Mrs. Stirrett consents to the inclusion in the release of the matters based on their
information in the form and context in which it appears.

COMPETENT PERSON – SALT WELLS
The information in this release that relates to Exploration Targets, Exploration Results, Mineral Resources or Ore Reserves is based on information prepared by Richard Kern, Certified
Professional Geologist (#11494). Richard Kern is a licensed Professional Geoscientist registered with AIPG (American Institute of Professional Geologists) in the United States. AIPGis a Joint Ore
Reserves Committee (JORC) Code ‘Recognized Professional Organization’ (RPO). An RPO is an accredited organization to which the Competent Person (CP) under JORC Code Reporting
Standards must belong in order to report Exploration Results, Mineral Resources, or Ore Reserves through the ASX.
Richard Kern has sufficient experience which is relevant to the style of mineralisation and type of deposit under consideration and to the activity which they are undertaking to qualify as a CP as
defined in the 2012 Edition of the JORC Australasian Code for Reporting of Exploration Results, Mineral Resources and Ore Reserves. Richard Kern consents to the inclusion in the release of the
matters based on their information in the form and context in which it appears.

                                                                                                                                                                                                       2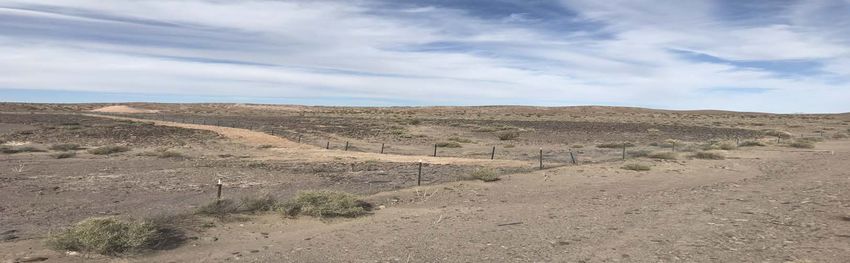
Table of Contents

                   Investment Highlights     1

                     Company Overview        2

                                  Borates    3

                                     SOP     4

                      Customer Markets       5

         Fort Cady Borate Mine Overview      6

           Fort Cady February 2021 eDFS      7

                   Market Entry Strategy     8

                  Visible Initial Revenues   9

            What Does Success Look Like      10

Fort Cady February 2021 eDFS Key Metrics     11

                                Summary      12

                                                  3
1. Investment Highlights

      American Pacific Borates Limited is an ASX listed company
      focused on becoming a globally significant specialty fertiliser producer.

   Exceptional Project Metrics*                                Low Upfront         Low Technical            Very High
                                                                  Capex                Risk                  Margin
  Post-tax, unlevered NPV8 US$2.02bn                           Phase 1A with           Ore body         Underpinned with
                                                             US$50m capex fully    previously mined     by-product credits,
     Post-tax, unlevered IRR                      40.6%          financed         and proven off the     logistics and high
                                                                                  shelf process route   priced markets on
                     Annual EBITDA             US$453M                                                       door step

         Multi Revenue                       Visible            Significant            Multi                 Globally
           Streams                          Revenues          Strategic Value       generational            Significant
           Two major                         Production       Very few sources      Life of mine at      Targeted annual
        revenue streams                  targeted for CY21      of additional       over 20 years         EBITDA in full
        reduces reliance                 with construction       supply into        with additional       production of
         on one product                       activities      growing markets      Resource upside          US$453m
                                            commenced

                                                                                                                              4
* refer ASX release of 4 February 2021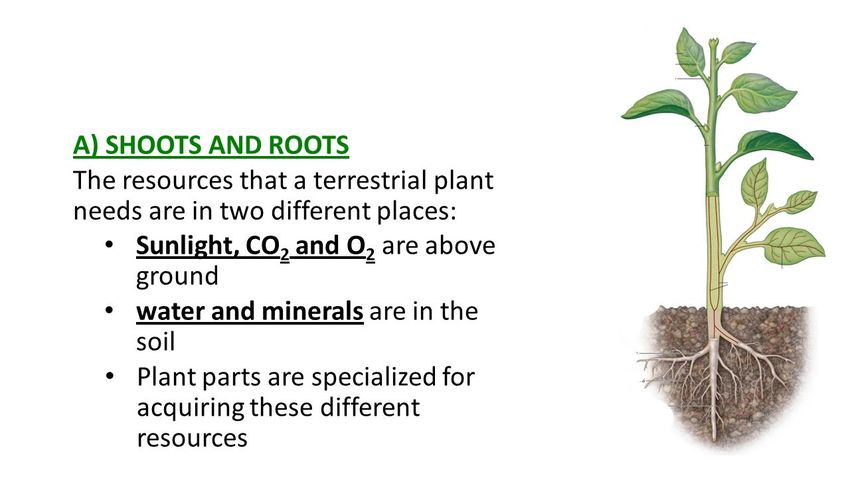
2. American Pacific Borates Limited
Corporate Information Share Price
$4,000,000 $2.00
ASX Ticker ABR $1.80
$3,500,000
Share Price at 3 February 2021 A$1.62 $1.60
$3,000,000
$1.40
Shares on Issue 375.1m $2,500,000
$1.20
Options (20c - $1.60 strike range) 61.1m $2,000,000 $1.00
Fully Diluted Shares 436.2m $0.80
$1,500,000
Undiluted Market Cap. A$596m $0.60
$1,000,000
$0.40
Cash at Bank – 31 January 2021 A$64.3m
$500,000
$0.20
Major shareholders: ABR Management (total) 13%
$0 $0.00
(fully diluted)
15/10/20
22/10/20
29/10/20
12/11/20
19/11/20
26/11/20
10/12/20
17/12/20
24/12/20
31/12/20
16/1/20
23/1/20
30/1/20
13/2/20
20/2/20
27/2/20
12/3/20
19/3/20
26/3/20
16/4/20
23/4/20
30/4/20
14/5/20
21/5/20
28/5/20
11/6/20
18/6/20
25/6/20
16/7/20
23/7/20
30/7/20
13/8/20
20/8/20
27/8/20
10/9/20
17/9/20
24/9/20
1/10/20
8/10/20
5/11/20
3/12/20
14/1/21
21/1/21
28/1/21
Virtova Capital 12%
2/1/20
9/1/20
6/2/20
5/3/20
2/4/20
9/4/20
7/5/20
4/6/20
2/7/20
9/7/20
6/8/20
3/9/20
7/1/21
Atlas Precious Metals 11% Volume Price
Key Executives
David J Salisbury Michael X. Schlumpberger Anthony Hall
Chairman, B.Sc (Electrical Engineering), MBA Managing Director and CEO, BEng (Mining), MBA Executive Director, LLB(Hons), BBus, AGIA
David is a qualified electrical engineer with over 40 Mike is a qualified mining engineer with over 30 years’ Anthony is a qualified lawyer with 20 years´ commercial
years’ experience in the global mining industry. He is experience in industrial minerals. His background experience in venture capital, risk management,
US based and a former Rio Tinto executive who was includes management, operations, and maintenance in strategy and business development. He was Managing
President and CEO of Resolution Copper Company, all aspects of mining, processing, reclamation, and Director of ASX listed Highfield Resources Ltd from
Kennecott Minerals Company and Rössing Uranium permitting. He has held senior roles with Potash 2011 to 2016. During his tenure the company´s market
Limited. He has been directly responsible for the Corporation of Saskatchewan, Passport Potash, and cap grew from $10m to $500m & over $140m was
development, construction and production of four Highfield Resources, and has worked in the United raised to progress potash projects in Spain.
mines. States, Canada, and Europe.
5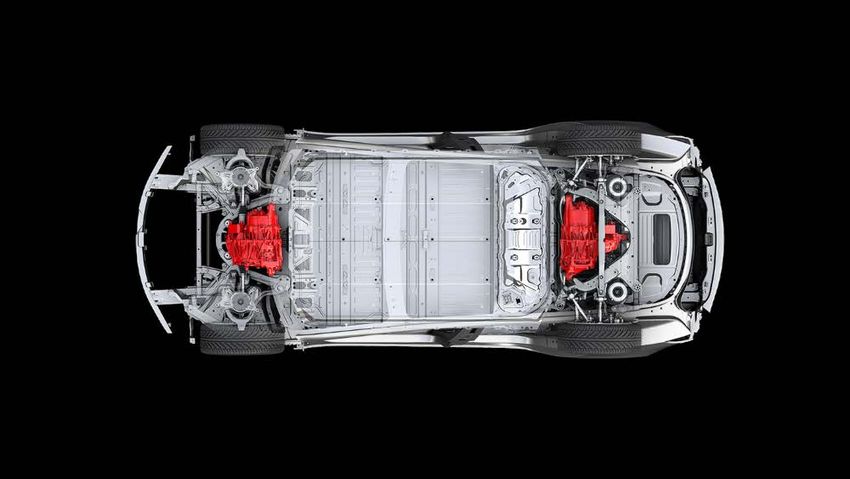
3. Borates

Borates are essential for everyday living

• Borates are naturally-occurring minerals containing                               Production of Borates
    boron, the fifth element on the Periodic Table. Boron            •    Most global production of borates comes
    exists all around us, plants need boron to grow. People               from mining and processing colemanite,
    need borates too, in our diet as well as in many                      borax or kernite ores.
    products necessary as part of our daily lives.                   •    Some production comes from borate rich
•   Boron is classed as a strategic commodity in many                     brines.
    countries including the US.                                      •    Fort Cady is a colemanite ore body.

                         Sources of Boron                                                         Demand for Boron

         Over 80% of global supply comes from Turkey or California

                                                                      Gypsum           Ceramics    Wind Turbines       Cosmetics    Nuclear Reactors   Detergents

                                                                     Fertilisers         Glass     Electric Vehicles   Magnets      Wood Treatment Flre Retardents

                                                                                   Industrialisation     Food Security             Electrification
                                                                                                                                    of Transport
                                                                                                                                                                     6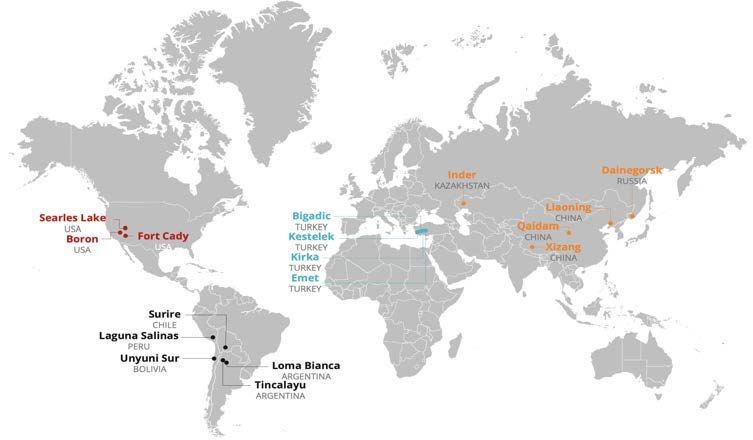
3. Borates
                                 Borates play into a number of new growth Thematics

                                                                                              CLEAN &
             FOOD SECURITY                               ELECTRIFICATION
                                                                                             EFFICIENT
                                                          OF TRANSORT
                                                                                              ENERGY

   Boron is one of the six essential            Used in the permanent magnet              Wind turbines
   micronutrients or trace elements              (NdFeB) drivetrain in Electric          Solar PV modules
         required by plants.                               Vehicles                      Nuclear reactors
                                                                                       Fibreglass Insulation

      Crops with boron sensitivity            Boron is also used in all modern cars:
       include: broccoli, cabbage,                         Steel chassis
   cauliflower, turnips, rice, beetroot,            Airbag firing mechanism
      spinach, asparagus, carrots,                     Ceramic brake pads
     eggplants, leeks, okra, onions,                       Windscreen
    parsnips, radishes, strawberries,                     Touchscreens
  sweet corn, tomatoes, and potatoes                   Acoustic insulation
                                                  and in Cleaning detergents

                                                                                                               7
3. Borates

                                                               Functions of Boron in Plants

                                           Flower production

                                                                                          Cell wall and structure

                                           Fruit quality and
             FOOD SECURITY                 shelf life

                                                                                          Photosynthessis

   Boron is one of the six essential
   micronutrients or trace elements        Lateral root
         required by plants.               development

      Crops with boron sensitivity
       include: broccoli, cabbage,
   cauliflower, turnips, rice, beetroot,
      spinach, asparagus, carrots,
     eggplants, leeks, okra, onions,
    parsnips, radishes, strawberries,
  sweet corn, tomatoes, and potatoes

                                                                                                                    8
3. Borates
Neodymium magnets (NdFeB) were
invented in the early 1980s by General
Motors and Sumitomo Special Metals.
The companies discovered that by
combining neodymium with iron and
boron, they were able to produce a
ELECTRIFICATION powerful magnet.
OF TRANSORT
Neodymium magnets are the strongest
type of permanent magnet available
commercially and continue to be the
Used in the permanent magnet most widely used type of rare-earth
(NdFeB) drivetrain in Electric
Vehicles
magnet today.
Permanent magnets
Boron is also used in all modern cars:
Steel chassis
Airbag firing mechanism
Ceramic brake pads
Windscreen
Touchscreens
Acoustic insulation
and in Cleaning detergents
8
93. Borates
Boron is playing an
important part in the
global transition to clean
and efficient energy.
Renewal energy technologies such as
wind turbines and solar PV modules
CLEAN &
EFFICIENT
cannot be built without Boron.
ENERGY
Similarly, insulation use in domestic
homes is now standard building practice
for thermal and acoustic purposes.
Wind turbines Boron is used in the production of
Solar PV modules
Nuclear reactors insulation rolls, batts and loose fill
Fibreglass Insulation products, which all play an important
role in reducing energy use and
ultimately emissions.
103. Borates
Cleaning Chassis Brakes Glass Airbag Insulation Battery Drivetrain Clean Energy
Detergents Steel Ceramic Borosilicate Firing Acoustic Anode Permanent magnet Wind turbine/Solar
mechanism
Electric Vehicles need Borates
114. SOP
SOP is primarily used as a specialty fertiliser
• SOP, potassium sulfate or K2SO4 is a high value Production of SOP
specialty fertiliser that combines both potash and • SOP is generally produced from Mannheim
sulfur. process that converts MOP and Sulfuric Acid
• It is applied to crops that are either sensitive to into SOP and HCl, or from near surface
chlorides making MOP or KCl problematic, or in areas aquifer units that contain potassium salts.
where there is minimal rainfall and the build-up of • Fort Cady is using the Mannheim process as
chlorides in the soil is problematic. it requires the HCl for its borate processing.
Global SOP Capacity* Demand for SOP in the USA*
Compass Minerals is the only producer of SOP in the USA
20%
15%
5%
60%
North America China Europe Rest of W orld
12
* Compass Minerals 2019 Annual Report (March 2020)5. Customer Markets
BORATES – Duopoly market with very few SOP – Growing demand in the North America
global sources of borates specialty fertiliser market
• The global boric acid equivalent market is around 4.5m • The global SOP market is around 7m tonnes per annum –
tonnes per annum. Around 20% of this market is for fertiliser all of which is used in the specialty fertiliser market.
application with boron being the second most consumed • The US is a net importer of SOP with the market growing at
micro nutrient in North America by value. around 5% CAGR. The Californian market is over 120ktpa.
• Turkish Government owned Eti Maden controls the marginal • Compass Minerals is the only US producer of SOP and is
unit of supply and will continue to meet demand. one of the highest cost producers in the world, with
• Eti Maden appears to be the only borate producer with average operating costs of past five years over US$630 /
meaningful additional capacity capable of meeting additional tonne.
supply requirements. • There is sufficient increase in demand forecasted to enable
• Rio Tinto Borates (majority of US production) appears to be ABR and Compass to jointly supply the North American
operating at full capacity with flat supply for over eight years. market with ABR’s production profile.
Borate Supply Curve * California, Broader US and Mexico SOP Estimated Demand vs ABR Supply to 2030 ^
8,000 700
Thousand tonnes of Boric Acid equivalent
7,000 600
6,000
Tonnes per annum 500
5,000
400
4,000
300
3,000
200
2,000
ROW ABR Producti on
1,000 ABR
100 Me xico
US A - e x ABR Rest of US
California
- Turke y
0
2013 2014 2015 2016 2017 2018 2019 2020 2021 2022 2023 2024 2025 2026 2027 2028 2016 2017 2018 2019 2020 2021 2022 2023 2024 2025 2026 2027 2028 2029 2030
13
* ABR analysis based on Roskill, Rio Tinto and Eti Maden Presentations. ^ US Based fertiliser market consultant, Context6. Fort Cady Borate Mine Overview
All Products Generated From Well-Established Processing Methods
Boric Acid production: SoP production:
• High purity product (+99.9%). • Mannheim Process (used globally in over 50% of SOP
• Standard industrial chemical processing methods production).
including solvent extraction and crystallization. • Well understood, widely used process facility.
• Zero liquid discharge circuit = no tailings. • “Off the shelf” equipment.
• Process optimisation works completed January • Production of hydrochloric acid for use in Boric Acid
2021. mining.
Simplified Fort Cady Flowsheet
147. Fort Cady February 2021 eDFS*
American Pacific Borates Limited released its enhanced DFS updated in
February 2021, with exceptional project metrics:
Fort Cady Borate Mine (Boric Acid and SOP Production) Production Targets Enhanced DFS (updated February 2021)
Phase 1A Only Boric Acid SOP
Capex US$54.2 million (US tons) (US tons)
Phase 1A 9,000 20,000
NPV8 US$138.5 million
Phase 1B - 60,000
IRR 24.4%
Phase 1C 81,000 -
EBITDA in first full year of production US$12.6 million
Phase 2 180,000 160,000
Phase 1A & 1B Only
Phase 3 180,000 160,000
Capex (Phase 1B only) US$34.6 million
Total
NPV8 US$597.9 million 450,000 400,000
(All 3 Phases)
IRR 46.1%
EBITDA in first full year of production US$49.6 million
Phase 1A, 1B & 1C Only
Capex (Phase 1C only) US$122.0 million
NPV8 US$885.2 million
IRR 36.4%
EBITDA in first full year of production US$81.1 million
Phase 1 & 2 Only
Capex (Phase 2 only) US$313.0 million
NPV8 US$1.889 billion
IRR 40.2%
EBITDA in first full year of production US$257.3 million
Full Project (Phases 1, 2, & 3)
Capex (Phase 3 only) US$318.7 million
NPV8 US$2.021 billion
IRR 40.6%
EBITDA in first full year of production US$452.7 million
ABR confirms all material assumptions underpinning the production target and corresponding financial information continue to apply and have not materially changed as per Listing Rule 5.19.2. ABR
confirms all material assumptions and technical parameters underpinning the Resource Estimate and Reserve continue to apply and have not materially changed as per Listing Rule 5.23.2
15
* refer ASX release of 4 February 2021.7. Fort Cady February 2021 eDFS*
Fort Cady Borate Mine
Sensitivity analysis based
on US peer operating costs BA Received Price Assumption
(based on Rio Tinto 5 year average operating costs)
US$569 / metric tonne
• Project still has a Post-tax, unlevered SOP Received Price Assumption
(based on Compass 5 year average operating costs)
US$633 / metric tonne
NPV8 of over US$1.32bn if operating
costs of US peers are used as selling Base Case enhanced DFS (updated February 2021)
price assumptions. NPV8 US$1.323 billion
IRR 31.1%
2015 2016 2017 2018 2019 AVERAGE
US$/tonne
Rio Tinto Borates
Operating Cost/tonne 634 568 565 551 526 569
BA equiv
Annual Production/tonne 822 886 893 884 898 877
BA equiv
(source: Rio Tinto Annual Reports)
Compass Minerals
Operating Cost/tonne 638 640 614 634 639 633
SOP*
Annual Production/tonne 282 284 297 328 288 296
SOP*
(source: Compass Annual Reports)
* Compass Minerals reports operating costs for all North American fertilisers. The significant majority of specialty fertiliser production is SOP. As a result, it is
assumed that the reported operating costs are a reasonable proxy for SOP production.
167. Fort Cady February 2021 eDFS
Additional new drivers of value to the Project
Higher Growth Rate Market Segment ^
Seed Market Crop Protection Market Micronutrients Market
CAGR: 5.6% ↑ CAGR: 5.0% ↑ CAGR: 8.4% ↑
86.0 77.3 9.8
62.1 57.7
6.1
$ Bn
$ Bn
$ Bn
2017 2023 2017 2023 2017 2023
Options to bring Targeted total cash costs Multiple revenue Potential upside with
forward production in full production of streams with revenue focus on high value
and potentially deliver negative US$83.61 per split in full production specialty fertiliser mix of
additional phases ton of boric acid after by- estimated to be: boron and SOP.
concurrently. product credits. • 52.6% boric acid;
• 44.7% SOP; and
• 2.7% gypsum.
17
^ Compass Minerals’ market growth assumptions (May 2019 Farm to Market Conference presentation)8. Market Entry Strategy
Right sized, structured and phased project
Modest Initial BA Phased Approach Partners established Product Mix
Initial production Growth plan with Globally significant Complementary
of boric acid only a pathway to partnerships product mix
9kstpa to be used over 450kstpa of established with which delivers a
as an enabler for boric acid and Chinese Majors diversified
larger contracts. 400kstpa of SOP. and with US revenue stream.
markets.
188. Brand Strategy Development
Early alignment of product branding
with customer markets
• Company is expecting to sell five key products
• Boric acid for industrial use Product Sales
• Boric acid for agricultural use
• SOP
• “boron-enriched” SOP
• gypsum
• Branding strategy completed, with Fort Cady
California Corp created as ABR’s sales and
marketing business
• Corporate presence work commenced
• Crop trials for Boron-enriched SOP delivered a
doubling of yield in Broccoli
• Initial target market is the Californian
speciality fertilizer market
Customer Markets
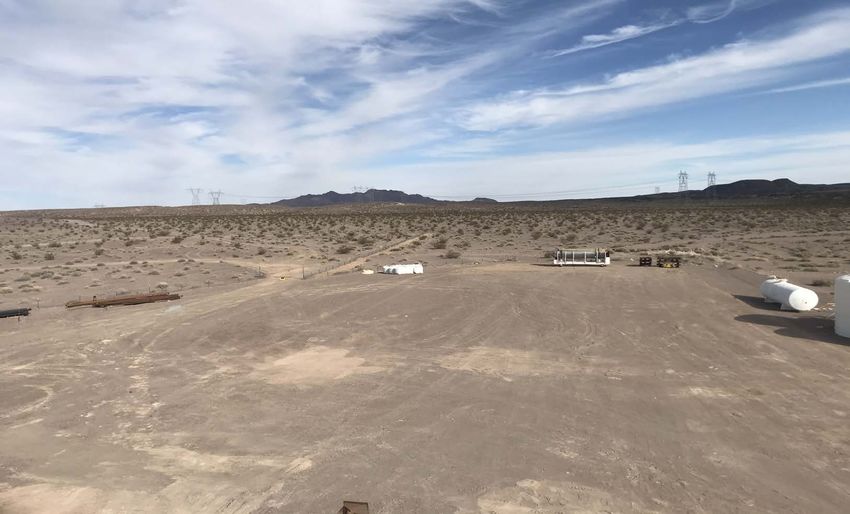
199. Visible Initial Revenues
Phase 1A fully funded with construction underway
Organisational Capability Construction Ramping Up
• Philosophy continues to be modest • First production remains on track for Q3,
owners’ team to manage construction CY2021
managers • Water and energy infrastructure in place First Production
• Ongoing recruitment of key staff with a • Equipment continues to arrive on site targeted Q3 CY21
focus on operational readiness
2010. What does success look like ?
EV / EBITDA ‘19, ‘20, ’21E of US Listed Producers
as at 4 February 2021
20x
18x
16x
14x CY21
12x 11.5x avg
10x
8x
Potential Future Valuations
6x 7,000 A$6.64bn
4x
2x 6,000
0x
ALB US SQM US CMP US NTR US MOS US 5,000
EV/ EBITDA '19 EV/ EBITDA '20 EV/ EBITDA '21 4,000
A$3.77bn
$A
3,000 A$2.52bn A$2.70bn
PE RATIO ‘19, ‘20, ’21E of US Listed Producers
as at 4 February 2021 2,000
70x
60x 1,000
50x -
CY21 NPV8 OF PHASE 2 NPV8 OF PHASE 3 11X EBITDA TARGET 11X EBITDA TARGET
40x
34x avg OF PHASE 2 OF PHASE 3
30x
20x
10x
0x
ALB US SQM US CMP US NTR US MOS US
P/E '19 P/E '20 P/E '21
ABR confirms all material assumptions underpinning the production target and corresponding financial information continue to apply and have not materially changed as per Listing Rule 5.19.2. ABR
confirms all material assumptions and technical parameters underpinning the Resource Estimate and Reserve continue to apply and have not materially changed as per Listing Rule 5.23.
21
Source: Capital IQ at 4 February 2021. Exchange rate of US$75c assumed.11. Fort Cady February 2021 eDFS (Key Metrics)*
Key Financial Metrics for the Fort Cady Borate Mine by Phase Summary of Production by Phase for the Fort Cady Borate Mine
Fort Cady Borate Mine (Boric Acid and SOP Production)1 Production Targets Enhanced DFS (updated February 2021)
Boric Acid SOP
Phase 1A Only
(US tons) (US tons)
Capex US$54.2 million Phase 1A 9,000 20,000
NPV8 US$138.5 million Phase 1B - 60,000
Phase 1C 81,000 -
IRR 24.4%
Phase 2 180,000 160,000
EBITDA in first full year of production US$12.6 million Phase 3 180,000 160,000
Phase 1A & 1B Only Total (3 Phases) 450,000 400,000
Capex (Phase 1B only) US$34.6 million
NPV8 US$597.9 million
Operating Cost Estimates BA Operating Cost Estimates SOP
Phase 3 Phase 3
IRR 46.1%
US$ per metric tonne of BA US$ per metric tonne of SOP
EBITDA in first full year of production US$49.6 million C1 Costs C1 Costs
Phase 1A, 1B & 1C Only Utilities 80.76 Utilities 90.85
Consumables 320.49 Consumables 360.55
Capex (Phase 1C only) US$122.0 million
Labour 43.53 Labour 48.97
NPV8 US$885.2 million Maintenance 33.21 Maintenance 37.36
Sustaining Capex 12.00 Sustaining Capex 13.50
IRR 36.4%
Wellfield Development 25.00 Wellfield Development 28.13
EBITDA in first full year of production US$81.1 million Other 10.82 Other 12.18
Phase 1 & 2 Only (SOP by-product credit) - 577.78 (BA by-product credit) - 765.44
(HCl by-product credit) - 3.74 (HCl by-product credit) - 4.20
Capex (Phase 2 only) US$313.0 million
(Gypsum by-product credit) - 35.30 (Gypsum by-product credit) - 39.71
NPV8 US$1.889 billion Total C1 Costs - 91.01 Total C1 Costs - 217.82
C2 Costs C2 Costs
IRR 40.2%
Licensing and Royalties 6.26 Licensing and Royalties 7.04
EBITDA in first full year of production US$257.3 million Depreciation 93.63 Depreciation 105.33
Full Project (Phases 1, 2, & 3) Total C2 Costs 99.89 Total C2 Costs 112.37
C3 Costs C3 Costs
Capex (Phase 3 only) US$318.7 million
G&A 8.90 G&A 10.01
NPV8 US$2.021 billion Total C3 Costs 8.90 Total C3 Costs 10.01
IRR 40.6% Total Opex 17.78 Total Opex - 95.44
Cash Costs Cash Costs
EBITDA in first full year of production US$452.7 million Total Cash Costs - 75.85 Total Cash Costs - 200.77
1
ABR confirms all material assumptions underpinning the production target and corresponding financial information continue to apply and have not materially changed as per ASX Listing Rule 5.19.2.
22
* Refer ASX Release of 4 February 202112. Summary
American Pacific Borates Limited is an ASX listed company
focused on becoming a globally significant specialty fertiliser producer.
Exceptional Project Metrics* Low Upfront Low Technical Very High
Capex Risk Margin
Post-tax, unlevered NPV8 US$2.02bn Phase 1A with Ore body Underpinned with
US$50m capex fully previously mined by-product credits,
Post-tax, unlevered IRR 40.6% financed and proven off the logistics and high
shelf process route priced markets on
Annual EBITDA US$453M door step
Multi Revenue Visible Significant Multi Globally
Streams Revenues Strategic Value generational Significant
Two major Production Very few sources Life of mine at Targeted annual
revenue streams targeted for CY21 of additional over 20 years EBITDA in full
reduces reliance with construction supply into with additional production of
on one product activities growing markets Resource upside US$453m
commenced
23
* refer ASX release of 4 February 2021Michael X. Schlumpberger Anthony Hall Elvis Jurcevic
Managing Director Executive Director Investor Relations
+1 419 371 3331 +61 417 466 039 +61 408 268 271
mxschlumpberger@americanpacificborates.com ahall@americanpacificborates.com ej@irxadvisors.comYou can also read