1H FY2021 Results Briefing - 19th August 2021 - Straits Trading
←
→
Page content transcription
If your browser does not render page correctly, please read the page content below

1H FY2021 Results Briefing

        19th August 2021

                             1
WELCOME

          2
P ro g ra m m e O u t l i n e

Time       Programme                               Presenter
10.00 am   Opening Address                         Ms Selina Ho, Head, Investors’ Relations & Corporate Secretariat
                                                                 Head, Corporate Communications
10.05 am   Key 1H FY2021 Highlights                Dr Allen Tan, Head, Portfolio Management
           Business Highlights (SRE)
           Business Highlights (ARA, Hospitality   Mr James Kwie, Portfolio Manager, Portfolio Management
           & Real Estate Portfolio)
           Business Highlights (Resources)
           Financial Highlights                    Ms Joyce Tan, Group Financial Controller

10.30 am   Q&A Session                             Key Management Team

11.15 am   Closing Comments                        Ms Selina Ho

                                                                                                                                       3

                                                                                © Copyright 2021. The Straits Trading Company Limited.
                                                                                                                     All rights reserved.
KEY 1H FY2021
    HIGHLIGHTS

By Dr Allen Tan
                    4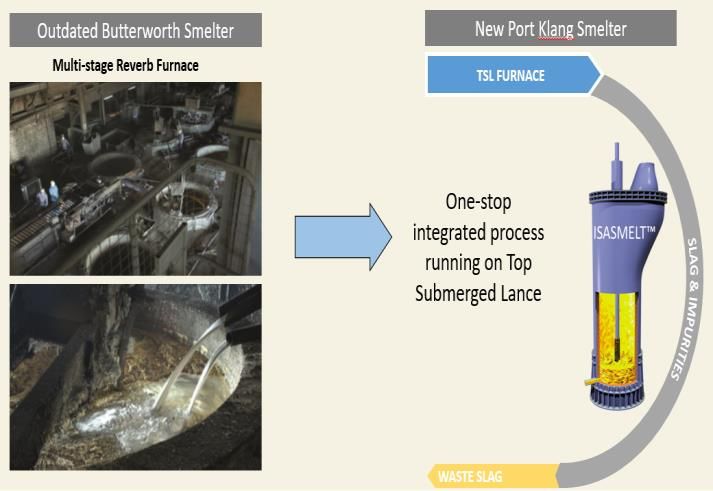
1H FY2021 KEY HIGHLIGHTS

• Robust half year performance demonstrates resilience of our strategy as a conglomerate-investment company
• EBITDA of S$186.9 million in 1H2021, compared to EBITDA of S$27.7 million in 1H2020
     •   Real Estate performed strongly with EBITDA of $168.9 million in 1H2021 (vs. $36.6 million in 1H2020).
     •   Resources recorded EBITDA of $15.5 million in 1H2021 (vs. $0.5 million in 1H2020)
     •   Hospitality continued to be affected by COVID-19
•   Divested two Good Class Bungalows above valuation, with total gross proceeds of S$65.3 million
•   Launched The Straits Trading Shareholders’ Club: members enjoy preferential benefits and opportunities to grow
    and co-invest with the Group

•    Real estate portfolio continues to bolster position and drives future earnings
•    Prudent capital management to maintain financial flexibility and seize opportunities

                                                                                                                                             5

                                                                                      © Copyright 2021. The Straits Trading Company Limited.
                                                                                                                           All rights reserved.
1H FY2021 KEY HIGHLIGHTS

    Straits Real Estate                        ARA                            Hospitality                                Resources
• Became wholly-owned             • Straits Trading’s stake is         • Taking opportunity to              • Tin prices at 10-year high
  subsidiary in April 2021          valued at S$1.14 billion in          enhance efficiency &                 supported by sustainable
  (acquired JL Family Office’s      both cash and shares                 productivity, and                    demand for consumer
  10.5% stake for $105 million)     following ESR-ARA merger             reposition for eventual              electronics
                                                                         recovery
• PATNCI grew to S$101.9          • The merger will create the                                              • 1HFY21 PAT of RM25.1
  million from recurring rental     largest Asia-Pacific real estate                                          million vs a net loss of
  incomes and valuation gains,      asset manager and the third-                                              RM12.3 million in 1HFY20
  primarily from Australian and     largest listed real estate                                                from higher tin prices and
  South Korean logistics            manager globally                                                          production quantity
  portfolio
                                                                                                            • Operations temporarily
                                                                                                              disrupted by MCO 3.0 but
                                                                                                              have gradually ramped up
                                                                                                              in line with the lifting of
                                                                                                              the workforce capacity
                                                                                                              restrictions

                                                                                                                                                          6

                                                                                                   © Copyright 2021. The Straits Trading Company Limited.
                                                                                                                                        All rights reserved.
BUSINESS
    HIGHLIGHTS

Property: SRE
By Dr Allen Tan
                  7
PROPERTY
                                                                                               SRE             ARA             FEHH
                                                                                                                                                PORTFOLIO

   S R E ’ S G ROW I N G I N V EST E D A S S E T S
   A growing global real estate private equity investor

Nurturing Platforms
                                                                    INVESTED ASSETS (S$MIL)
                                                                                                                                   3,000
• To grow from current S$2.0
  billion to S$3.0 billion target
  Invested Assets in near term                                                                                     2,015
                                                                                                     1,861            79
                                                                                       1,669         151
• S$967 million                                                            1,405
                                                               1,217                    318
                                                                             113
  capital realised and                     984     955          109
  re-deployed to date                      159      93                                                               1,936
                                                                                                     1,710
                                                                            1,292      1,351
                                    358                        1,108
                                           825     862
• S$886 million                     106
                                    252
  Net capital invested                             -172         -193        -234        -104         -264
  as of June 2021
                                    2014   2015    2016         2017        2018        2019         2020         HY2021          TARGET
                                                  Assets Invested      Committed Investment     Assets Divested

                                                                                                                                                      8

                                                                                                © Copyright 2021. The Straits Trading Company Limited
                                                                                                                                     All rights reserved
PROPERTY
                                                                                                                                    SRE             ARA             FEHH
                                                                                                                                                                                     PORTFOLIO

RO B U ST RO E T R AC K R ECO R D
Laser-focused on capital efficiency

                                                                                                         ROE TRACK RECORD
Delivering Returns
                                                         2014              2015              2016              2017          2018            2019               2020             2021H1

• Consistently growing ROE(1)
  via active divestment and
  re-deployment

• Credible ROE in 2021H1                                                                    12.5%
                                                                                                                                            11.0%
                                                                                                                                                                                 12.2%
  despite disruptions from                                                                                                   8.0%                              8.9%
                                                                                                              7.2%
  COVID-19

• Average ROE: 10.0%(2)                                                   -1.6%          Divested          Divested         Divested       Divested           Divested
                                                        -3.0%                           114 William        Summit         Greater Tokyo     Osaka              Tokyo
                                                                                          Street         Development       Office Fund    Residential        Residential
                                                                                                             Fund                          Portfolio          Portfolio

                (1) ROE denotes return on equity and is computed based on SRE’s PATNCI over average shareholder’s funds                                                                    9
                (2) Average ROE from 2016 – 2021H1
                (3) 2021H1 ROE is based on 1H PATNCI, unannualized                                                                  © Copyright 2021. The Straits Trading Company Limited.
                                                                                                                                                                         All rights reserved.
PROPERTY
                                                                                                                                                SRE            ARA              FEHH
                                                                                                                                                                                                 PORTFOLIO

S R E I N V EST M E N T FO OT P R I N T
Focused diversification driven by secular growth trends
                                                                                                                                           Key Investment Themes
                                                           CHINA                                                                                      Modern logistics portfolio in Australia
                                                                                                     JAPAN                                  1
                                                                                                                                                      and Korea geared to fulfil secular
                                                                                                                                                      demand
                                                                                                                Japan Value Fund II
                                                                                                                                            2         Office properties with arbitrage/
                                                                                                 KOREA               S$82.4m
                   Suntec Place - Sanlin Mall Chongqing Retail Mall
                                                                                                                                                      value-add upside in key cities of Japan,
                          S$214.6m                 S$173.9m                                                                                           Australia and the UK

                                                                                                                                            3         Retail malls on sustainable domestic
                                                                                                 Anseong Logistics    Arenas Yeongjong                consumption in China and Malaysia
 UNITED KINGDOM                                                                                      S$26.1m*             Logistics
                                                                                                                         S$200.2m
                          MALAYSIA
                                                                                                                 AUSTRALIA

Bourne Business Park
     S$145.3m                              Malaysia Retail Portfolio
                                                 S$216.5m
                                                                                                                     Logistics Portfolio   45 St Georges         320 Pitt Street, Sydney
                                                                                                                        S$290.4m           Terrace, Perth               $338.3m
                                                                                                                                              S$67.8m

                           Figures represent SRE’s pro-rata share of property value as of 30 June 2021                                                                                                10
                           * Figure for Anseong Logistics denotes acquisition of development land at cost
                                                                                                                                                © Copyright 2021. The Straits Trading Company Limited.
                                                                                                                                                                                     All rights reserved.
PROPERTY
SRE ARA FEHH
PORTFOLIO
W E L L - D I V E RS I F I E D P RO P E RT Y P O RT FO L I O
Predominantly income -generating and geographically diverse portfolio
Development vs Income Allocation by Asset Class Allocation by Country
Generating
China
Development Others 29.2%
Retail
(Equity) 6.7%
33.6% Malaysia
5.9%
9.4%
Korea
Development Japan 9.5%
(Mezzanine) 8.4%
4.1%
Office/
Logistics Business Park UK
Income 8.3%
28.9% 30.8%
generating Australia
90.0% 35.2%
• ~90% income generating assets
• Increasing exposure to future-ready and resilient sectors: modern logistics and business parks
(1) Investment value weighted as of 30 June 2021
11
© Copyright 2021. The Straits Trading Company Limited.
All rights reserved.BUSINESS
HIGHLIGHTS
Property: ARA
By Mr James Kwie
12PROPERTY
SRE ARA FEHH
PORTFOLIO
A R A A S S E T M A N AG E M E N T
Accelerated expansion since privatisation
2017 (at Privatisation) Jun 2021 GROSS ASSETS (S$ BILLION) 128
~119
A premier real estate fund manager A leading APAC real assets fund manager
CAGR:~30%
~88
• AUM ~S$40 billion • Gross Assets ~S$128 billion ~80
• Asia Pacific presence • Asia Pacific, Europe and United States 59
• REITS, Private Funds, REMS(1) • REITS, Private Funds, REMS, New
Economy(2), Infrastructure, Credit and 36
26 29
• 1,200+ employees Real Estate Fintech
• 1,400+ employees
DEC 14 DEC 15 DEC 16 DEC 17 DEC 18 DEC-19 DEC-20 JUN-21
• Deal of the Year (Asia) at the PERE • Originates, underwrites and • 1st real estate manager in Asia to sign WorldGBC’s Net Zero Building
Global Awards 2020 invests in private debt Carbon Commitment & received over 120 ESG Awards and Accolades
• LOGOS participates in all aspects of opportunities
the New Economy asset lifecycle • AUM and active mandates:
• AUM: ~US$17 billion ~US$13 billion
(1) Real estate management services
(2) Logistics and data centers 13
© Copyright 2021. The Straits Trading Company Limited.
All rights reserved.PROPERTY
SRE ARA FEHH
PORTFOLIO
A R A A S S E T M A N AG E M E N T
Key developments in 1H FY2021
Kenedix
• Kenedix successfully delisted from the Tokyo Stock Exchange in March 2021
• Increased its strategic stake in Kenedix to 30.0% in May 2021, up from 20.3% previously
• In May 2021, ARA welcomed Sumitomo Mitsui Banking Corporation (“SMBC”) as a new strategic
investors via a US$500 million round of equity financing(1)
SMBC • SMBC is among the world’s premier financial institutions with US$2.25 trillion in assets as at 31
December 2020, and a global presence in 40 countries
• On 4th Aug 2021, ARA and ESR signed an agreement to merge
• The proposed transaction, when completed, will create APAC’s largest real estate and real asset manager, and the
third largest listed real estate asset manager globally with significant exposure to new economy real estate
14
Source: Press releases by ARA Asset Management.
(1) https://ara.listedcompany.com/newsroom/ARAPress_Release_SMBC0Joins-ARAasStrategicShareholder_17052021.pdf © Copyright 2021. The Straits Trading Company Limited.
All rights reserved.A R A A S S E T M A N A G E M E N T: P R O P O S E D M E R G E R W I T H E S R C AY M A N
R e a l i s a t i o n o f S t r a i t s Tr a d i n g ’s i n v e s t m e n t i n A R A
Straits Trading to roll-over its effective 19.0%(1) interest in ARA for total consideration of
S$1,140.4 million, comprising cash and securities of ESR
Cash Consideration Securities
S$134.8 million(2) S$1,005.7 million consideration securities comprising:
• 195.4 million ESR shares at a price of HK$27.00 per share (S$915.3 million(3))
• 19.3 million convertible vendor loan notes (“VLNs”) (S$90.4 million(3))
• The transaction is subject to ESR shareholders’ approval. 46.6% of ESR shareholders have provided irrevocable undertaking to vote in favor of the
transaction.
• Closing is expected by 4Q2021 or 1Q2022
1. This being the product of SE1’s shareholding in ARAH (22.06%), ARAH’s effective economic interest in ARAC (96.21%) and ARAC’s shareholding in ARAB (89.38%) = 18.97%
2. Based on an exchange rate of USD1.00:SGD1.349 15
3. Based on an exchange rate of SGD1.00:HKD5.764
© Copyright 2021. The Straits Trading Company Limited.
All rights reserved.BUSINESS
HIGHLIGHTS
Hospitality
By Mr James Kwie
16PROPERTY
SRE ARA FEHH
PORTFOLIO
FA R EA ST H O S P I TA L I T Y H O L D I N G S
A premier hotel owner and operator
Overview
• Joint venture with Far East Orchard
• Manages over 105 property assets with approximately
more than 18,000 keys across 9 countries
Key Developments in 1H FY2021
• Opened 4 hotels (986 keys) in Asia Pacific
• Strategic alliance agreement with the Artotel Group to tap
domestic tourism in Indonesia, Southeast Asia’s largest
market
Outlook
• Expectation for international air travel to not return to pre-
pandemic levels till 2023 or later
• Longer-term optimism that global tourism will recover
with increasing vaccination rollout
• Focus on the transformation of its brands and operations
as it grows its hospitality footprint
The Clan Hotel (Artist impression)
17
Source: Far East Orchard Limited website
© Copyright 2021. The Straits Trading Company Limited.
All rights reserved.BUSINESS
HIGHLIGHTS
Property: Real Estate Portfolio
By Mr James Kwie
18PROPERTY
SRE ARA FEHH
PORTFOLIO
P RO P E RT Y P O RT FO L I O
Unlocking value of prime land in Butterworth, Penang
Straits City – Phase 1 in progress
• Development of a 23-storey 4-star hotel expected to
be completed in 2022
• Target launch of Straits City Concept Centre by Q3
2023
• Prime location: 5 min drive to the newly launched
integrated transportation hub, Penang Sentral
• Penang Draft Master Plan 2030: Butterworth
earmarked as an extension of George Town
19
© Copyright 2021. The Straits Trading Company Limited.
All rights reserved.BUSINESS
HIGHLIGHTS
Resources: MSC
By Mr James Kwie
20M A L AYS I A S M E LT I N G CO R P
O n g o i n g d r i v e t o e n h a n c e s u s t a i n a b i l i t y, c o m p e t i t i v e n e s s & l o n g - t e r m g r o w t h
MSC GROUP
• Continued to be profitable in 1HFY21 despite disruptions arising from Covid-19
• Tin mining net profit up 5-fold to RM36.2 million in 1HFY21 (1HFY20: RM6.6 million), while tin smelting reported a lower net loss of
RM2.8 million (1HFY20: –RM19.9 million)
• Well positioned to capitalise on strong tin price fuelled by rising demand for tin solder in consumer electronics
• Raised gross proceeds of RM38 million via a private placement mainly for repayment of bank borrowings and working capital
purposes
TIN MINING - Ongoing initiatives to raise mining productivity TIN SMELTING – Pulau Indah smelter on track to be fully
commissioned by late 2021 or early 2022
• New initiatives have raised
daily mining output to 11 • Improve production
tonnes/day in 1H21 from yield and capacity
9.5 tonnes/day in 2020
• Smaller carbon
• Explore new deposits and footprint
JV mining arrangements
21
Source: MSC’s 1Q FY21 press release, regulatory announcements and press articles on its website
© Copyright 2021. The Straits Trading Company Limited.
All rights reserved.FINANCIAL
HIGHLIGHTS
1HFY2021
By Ms Joyce Tan
22G RO U P F I N A N C I A L H I G H L I G H T S
S$’m 1H2021 1H2020 % Change
EBITDA 186.9 27.7 574.8
Profit before tax 165.7 9.5 1,642.7
PATNCI 122.6 5.5 2,135.3
EPS (cents) 30.1 1.3 2,215.4
23
© Copyright 2021. The Straits Trading Company Limited.
All rights reserved.E B I T DA BY B U S I N ES S S EG M E N T S
Main drivers of profitability – Real Estate segment
EBITDA (S$ mil)
1H2020 1H2021 186.9
Real Estate
145.5
22.5 23.7 27.7
15.5 13.6
0.5 0.5 7.5
(0.2) (4.9) (5.1) (4.5)
Resources SRE ARA RE - Others Hospitality Corp. Expenses Total
24
© Copyright 2021. The Straits Trading Company Limited.
All rights reserved.PAT N C I BY B U S I N ES S S EG M E N T S
Main drivers of profitability – Real Estate segment
PATNCI (S$ mil)
1H2020 1H2021
122.6
101.9
23.7
8.5 13.6
4.6 5.5
(2.3) (0.3) (0.2) (5.0) (5.2) (2.2)
(9.0)
Resources SRE ARA RE - Others Hospitality Corp. Expenses Total
Real Estate
25
© Copyright 2021. The Straits Trading Company Limited.
All rights reserved.G RO U P F I N A N C I A L H I G H L I G H T S
Strong financial position and prudent financial metrics
S$m 30 Jun 2021 31 Dec 2020
Cash and short-term deposits 211.2 456.3
Total assets 3,055.6 3,085.9
Total borrowings 1,154.2 1,188.5
Total liabilities 1,292.8 1,359.0
Total equity 1,762.8 1,726.9
NAV/share (S$) 4.03 3.78
Net debt/Total equity 53.5% 42.4%
EBITDA/Interest expenses 10.82 4.50
26
© Copyright 2021. The Straits Trading Company Limited.
All rights reserved.K E Y S O U RC ES O F G RO U P C A S H F LOW
Cashflow from Multiple Sources (S$’m)
Operating cashflow before working capital Dividend from investment securities & associates Interest received Total
100 94.5
90 81.4 10.4
80
70 20.6
56.3 37.0
60 50.7
3.9 48.9
50 41.0
9.5 39.5 5.1
40 3.0 38.5 8.2 32.3
29.2
30 17.6 1.4
35.8 47.2 10.2
20 36.3 35.6
10 23.2 23.0 22.3 20.7
0 5.4 1.7
2014 2015 2016 2017 2018 2019 2020 1H2021
Sale of Osaka for Divestment of
Capital Sale of Straits Sale of SG Sale of 114 Divestment of Sale of SG
Divestment of S$83m, and SG Japan residential
Trading Building residentials for William Street for GTOF for residentials for
Recycled for S$450.0m S$95.3m S$171.8m
SDF for S$55.0m
S$126.6m
residentials for portfolio for
S$65.3m
S$24.0m S$244.2m
27
© Copyright 2021. The Straits Trading Company Limited.
All rights reserved.D I V I D E N D R ECO R D
Maintaining dividend of S$0.06/share
Dividend Per Share
Special Interim
160.0 7.0
Sale of investments and marketable
6.0 6.0 6.0 6.0 6.0
140.0 6.0
securities post strategic review
120.0
5.0
INTERIM (Cents)
SPECIAL (Cents)
100.0 4.0 4.0 4.0 4.0 4.0
4.0
80.0
3.0
60.0 2.0 2.0 2.0
2.0
40.0
Divested non-core Divested WBL
20.0 residential properties 1.0
150.0 100.0 50.0
0.0 0.0
FY08 FY09 FY10 FY11 FY12 FY13 FY14 FY15 FY16 FY17 FY18 FY19 FY20
28
© Copyright 2021. The Straits Trading Company Limited.
All rights reserved.TOTA L A S S E T S
S$3.06 billion in total assets as of 30 Jun 2021(Dec 2020: S$3.09 billion)
81% from real estate and hospitality segments
REAL ESTATE ASSETS BREAKDOWN (S$ MIL)
$217.3m, 7% 1,475.5
$2,304.3, 76% 72.5
$371.4m,
12%
781.1
430.2
$162.6m, As at
235.5
5% 30 June 2021 621.9 117.1
(S$’mil) 46.1
SRE ARA STC'S SUNTEC OTHER LIQUID
PROPERTY ASSETS
PORTFOLIO
Cash & Others
Chongqing Mall, 45 St Georges Terrace, Bourne Business Park & Logistics assets
Real Estate Hospitality Resources Others*
Harmony III, JVF II, 320 Pitt St, Logistics JV in Korea, Suntec Place JV & investment in secured notes
29
* Others comprise mainly Group-level cash, securities portfolio
© Copyright 2021. The Straits Trading Company Limited.
All rights reserved.Q&A Session
Reminders
1) Keep your devices on mute
2) When asking a question:
• Use the ‘Raise Hand’ function and wait for the Host to call you. Please state your 30
name and organisation before asking your question.
• Alternatively, you can type your question in the chat box.DISCLAIMER
The information contained in this presentation (the "Presentation") is for information purposes only. The Presentation This Presentation is directed only at persons which are neither resident in the United States nor “U.S. persons” as defined
does not constitute or form part of any offer or invitation to sell or the solicitation of an offer or invitation to purchase or under Regulation S of the U.S. Securities Act of 1933, as amended (the "Securities Act") and, in addition, which are lawfully
subscribe for, or any offer to underwrite or otherwise acquire any securities of The Straits Trading Company Limited (the able to receive this document under the laws of the jurisdictions in which they are located or other applicable laws.
“Company”) or any other securities, nor shall any part of the Presentation or the fact of its presentation or communication Securities of the Company have not been, and will not be, registered under the Securities Act, or the securities laws of any
form the basis of, or be relied on in connection with, any contract, commitment or investment decision in relation thereto. state of the United States or other jurisdiction, and may not be offered or sold within the United States unless registered
under the Securities Act or pursuant to an exemption from, or in a transaction not subject to, the registration
The information in this Presentation is based on the views of and certain assumptions held by the management of the requirements of the Securities Act and any applicable U.S. state or local securities laws. The Company assumes no
Company. While the Company has made reasonable efforts to ensure the accuracy of the information, the Company has responsibility in the event there is a violation by any person of such restrictions. Any other information and materials on
not independently verified such information. In addition, the Company does not make any representation or warranty as the Company’s website, any website directly or indirectly accessible by hyperlinks on the Company’s website and any
to the accuracy or completeness of the information contained in this Presentation or the reasonableness of any other website are not incorporated in, and do not form part of, this Presentation.
assumptions contained herein and any liability in respect therefore is expressly disclaimed. Further, nothing in this
Presentation should be construed as constituting legal, business, tax or financial advice and you should consult your own Neither this Presentation or any part thereof may be (a) used or relied upon by any other party or for any other purpose,
independent professional advisers. (b) copied, photocopied, duplicated or otherwise reproduced in any form or by any means, or (c) forwarded, published,
redistributed, passed on or otherwise disseminated or quoted, directly or indirectly, to any other person either in the
The information in this Presentation has been provided by the Company as of 13 August 2021 except as otherwise participants’ organisations or elsewhere. By attending this presentation, participants agree to be bound by the terms
indicated, and are subject to change without notice or update, and does not purport to be complete or comprehensive. above.
The Company does not make any representation or warranty that there have been changes in the affairs of the Company
after such date. This advertisement or publication has not been reviewed by the Monetary Authority of Singapore.
This Presentation may contain forward-looking statements. All statements that address expectations or projections about
the future, including, but not limited to, statements about the strategy for growth, expected performance, trends,
anticipated developments in the Company’s industries, market position, expenditures, and financial results, are forward-
looking statements. Forward-looking statements are based on certain assumptions and expectations of future events. The
Company does not guarantee that these assumptions and expectations are accurate or will be realised. Actual future
performance, outcomes and results may differ materially from those expressed in forward-looking statements as a result
of a number of risks, uncertainties and assumptions. Although the Company believes that such forward-looking statements
are based on reasonable assumptions, it can give no assurance that such expectations will be met.
These factors include, but are not limited to, (i) general global, regional and local political, social and economic conditions
(including, but not limited to, factors such as the political landscape, environmental conditions and viral epidemics such as
human avian flu and severe acute respiratory syndrome) that may result in reduced occupancy rates and room rates for
the hospitality investments of the Company or affect the other investments of the Company, (ii) the cyclical nature of the
property market and tourism industry in the countries in which the Company operates and fluctuations in tin prices, (iii)
the Company not being successful in the implementation of its business strategies or in managing its growth, (iv)
regulatory developments and changes in the industries in which the Company operates, the general economic condition
of, and changes in, the economy in Asia-Pacific and Europe, (v) competition in the hospitality industry and the hospitality-
related industry in the Asia-Pacific and Europe region, (vi) hostilities (including future terrorist attacks) or fear of hostilities
that affect travel in general, within or to the Asia-Pacific region or any other countries in which the hospitality investments
of the Company are located or have operations, (viii) changes in the supply and demand for tin metal, (vii) changes in the
price of tin as a result of speculation, (viii) changes in interest rates or inflation rates, (ix) wars or acts of international or
domestic terrorism, (x) occurrences of catastrophic events, natural disasters and acts of God that affect the business or
properties of the Company, and (xi) other factors beyond the control of the Company. You are cautioned not to place
undue reliance on these forward-looking statements, which are based on current view of the Company's management on
future events. The Company assumes no responsibility to amend, modify or revise any forward-looking statements, on the
basis of any subsequent developments, information or events, or otherwise.
This Presentation includes statistical data provided by us and various third parties and cites third party projections
regarding growth and performances of the industry and markets in which we operate. Such data is taken or derived from
information published by industry sources, various third parties and from our internal data. In each such case, the sources
are identified in this Presentation.
31
© Copyright 2021. The Straits Trading Company Limited.
All rights reserved.THANK YOU
You can also read