2018 half year results - Tower Limited investor presentation 29 May 2018 - Tower Insurance

Page created by Bruce Love
 
CONTINUE READING
2018 half year results - Tower Limited investor presentation 29 May 2018 - Tower Insurance
2018 half year
results
Tower Limited investor
presentation
29 May 2018
Introduction

Michael Stiassny
Chairman
Transformation is driving growth

Strong underlying performance through GWP growth and cost discipline
• Significant improvements achieved in policy and premium growth, claims control and management expense ratio
• Half year result impacted by one-offs: Peak Re settlement and severe weather events

Transformation of iconic NZ brand well underway
• Challenger brand positioning already delivering community and business benefits
• Decision made to invest in transformation to accelerate trajectory

Solid capital base and commitment to efficient capital management
• Tower’s Board and management team remain strongly committed to paying dividends
• The Board intends to recommence dividends at the 2018 Full Year, subject to financial performance

                                                                                                                3
Overview of
Tower

   First half performance
   overview
   Richard Harding
   Chief Executive Officer
Delivering strong underlying performance
Strong growth offset by unprecedented frequency and severity of
weather events
                                                                                                         Key metrics                                                                  H1 18                         H1 17
ACHIEVEMENTS
                                                                                                         Total GWP                                                                   $161.0m                        $145.8m

 Strong GWP growth of 15.6% achieved in                                                                 GWP growth in core NZ portfolio1                                              15.6%                         2.4%
  core NZ portfolio
                                                                                                         Growth in policies in core NZ portfolio1                                      9,634                         4,949

 Maintained claims discipline despite                                                                   Claims expenses                                                              $74.4m                        $64.7m
  exceptional weather events
                                                                                                         Claims expense ratio                                                          55.5%                         51.0%
 Management expense ratio improvement
                                                                                                         Claims expense ratio exc. severe weather                                      50.6%                         47.0%

 New approach to pricing implemented                                                                    Management expense ratio                                                      38.9%                         40.8%

 46% reduction in open Canterbury                                                                       Underlying profit after tax2                                                  $7.3m                         $8.1m

  earthquake claims in the 12 months since                                                               Reported loss after tax3                                                     $11.6m                        $8.2m
  31 March 2017
                                                                                                         Open Canterbury earthquake claims                                              253                           474
1.   Core portfolio is the NZ business and excludes ANZ legacy portfolio
2.   “Underlying profit” does not have a standardised meaning prescribed by Generally Accepted Accounting Practice (GAAP) and may not be comparable to similar measures presented by other entities. While
     Tower has applied a consistent approach to measuring underlying profit in the current and comparative periods, it is not subject to audit or independent review. Tower uses underlying profit as an internal
     reporting measure as management believes it provides a better measure of Tower’s underlying performance than reported profit, as it excludes large or non-recurring items that may obscure trends in the          5
     underlying performance of the Tower group. Tower considers that underlying profit is useful to investors as it makes it easier to compare the underlying financial performance of Tower between periods.
3.   “Reported loss after tax” is calculated and presented in accordance with GAAP and is taken from Tower Limited’s unaudited interim financial statements for the half-year ended 31 March 2018.
Focus on customers leads to growth
Core book growing as a result of digital growth and strong retention

ACHIEVEMENTS                                                                     CORE1 NEW ZEALAND GWP GROWTH
                                                                                                                                                  15.6%

                                                                                                                                     8.7%                       160.0
 Strong GWP growth of 15.6% in core book, due to a
                                                                                                                                                                140.0
  combination of pricing (10.0%) and volume growth (5.6%)            1.6%                 2.1%                  2.4%
                                                                                                                                                                120.0
 Policy growth almost doubled on first half of FY17 in core                                                                                                    100.0
  NZ book                                                                                 107.2                                     116.6         111.3
                                                                     93.9                                       96.2                                            80.0

 New approach to pricing combined with simple and easy                                                                                                         60.0
                                                                     H1 16               H2 16                 H1 17                H2 17         H1 18
  products driving impressive customer growth and                              Core GWP ($m)1               GWP growth % on same period last year
  improved mix
                                                                    POLICY GROWTH IN CORE1 NEW ZEALAND PORTFOLIO
 Tower Direct retention levels remaining steady
                                                                                                                                                    9,634
INVESTMENT WILL ACCELERATE TRAJECTORY                                                                                                     7,492
                                                                                                                  4,949
                                                                       1,285                 1,224
• Unique customer experience

• Leverage new and existing partnerships to drive retention
                                                                       H1 16                H2 16                 H1 17                   H2 17     H1 18

• Innovative new offerings delivered through partners                                                    Core Policy Movement                               6
                                                               1.   Core portfolio is the NZ business and excludes ANZ legacy portfolio
Digital: a stand-out performer
Continued focus on digital capability and partnerships sees growth
above industry norms achieved

ACHIEVEMENTS                                                              QUARTERLY NEW BUSINESS GWP
                                                                              - DIGITAL CHANNELS
 39% of new business sales online in March 2018, compared to
  24% in March 2017
                                                                                                                                    $4.9m

 Tailored, targeted insurance offers available for customers                         CAGR = 171%                           $4.4m

  using digital channels
                                                                                                               $3.3m
 Trade Me Insurance platform continues to contribute to                                            $2.9m

  positive result
                                                                                           $2.1m
INVESTMENT WILL ACCELERATE TRAJECTORY                                        $1.7m

                                                                  $1.1m
• Online conversion rate optimisation and improvement

• Digital self-service, policy management and claims lodgement
                                                                 Jul-Sep16 Oct-Dec16 Jan-Mar17 Apr-Jun17 Jul-Sep17 Oct-Dec17 Jan-Mar18

                                                                                      Trade Me Insurance    Tower Digital
                                                                  New Tower direct
                                                                   digital platform
                                                                      launched                                                         7
Claims and underwriting update
Improvements in pricing and underwriting is controlling claims costs despite
industry wide inflation and severe weather

ACHIEVEMENTS
                                                                                       TOWER CLAIMS EXPENSES ($m)
 New approach to weather events helps set things right for
                                                                                                                                                       60%
    customers faster and more efficiently                               95.0                                                              55%
                                                                                     52%                                     51%                       55%
                                                                        85.0                                    51%
 New approach to pricing enabling targeted underwriting and                               50%
                                                                                                  48%
                                                                                                                                   50%           51%   50%
                                                                        75.0                         48%
    risk attraction                                                                                                   47%                  6.5
                                                                                                                             2.4                       45%
                                                                        65.0         3.3
                                                                                                                5.1
                                                                                                  0.5
 Supply chain and preferred supplier initiatives continue              55.0                                                                           40%
                                                                                                                             64.6         67.9
                                                                                     62.9         61.0
    delivering savings                                                  45.0                                   59.6                                    35%

                                                                        35.0                                                                           30%
INVESTMENT WILL ACCELERATE TRAJECTORY                                               H1 16        H2 16         H1 17        H2 17        H1 18
                                                                                  BAU Claims                           Large Events
•   Sophisticated pricing and underwriting to offset claims inflation
                                                                                  Loss Ratio excl Large Events         Loss Ratio
    and improve long-term profitability
                                                                               Note: Claims costs includes BAU and large storm events, but excludes
•   Advanced rating algorithms and address based pricing                       Christchurch and Kaikoura movements

•   Improved supply chain management and focus on fraud and
                                                                                                                                            8
    claims leakage
Severe weather and storm events
    Unprecedented frequency and severity of large weather events have
    resulted in impacts that already exceed full 2017 financial year
WEATHER EVENTS
                                                                                                                                           Estimated
                                                                                                                    Ultimate   Estimated
•   FY17 was the worst year for weather impacts in 25 years and                                      Incurred                             Impact Net
                                                                      Event                Date                    Estimate + Reinsurance
                                                                                                      to Date                                  of
    seven months into FY18, weather and storm impacts are already                                                 Risk Margin Recoveries
                                                                                                                                          Reinsurance
    higher than the full prior year                                   H1 18 Events
                                                                      NZ - New Year
                                                                                          Jan-18       $1.4m         $1.8m               -          $1.8m
•   Industry experts reporting that these weather conditions are      Storm
    one-off                                                           NZ - Ex-
                                                                                          Feb-18      $2.6m          $3.7m               -          $3.7m
                                                                      Cyclone Fehi
                                                                      Pacific -
•   Initial estimates of losses for April events is $9.0m, with a     Cyclone Gita
                                                                                          Feb-18      $4.0m          $7.7m            $6.2m         $1.5m
    before-tax, and after reinsurance impact, expected to be around   NZ - Ex-
                                                                                          Feb-18       $1.1m         $1.8m            $1.8m           -
    $3.8 million                                                      Cyclone Gita
                                                                      Total Storms                    $9.1m         $15.0m           $8.0m          $7.0m
•   Tower expects its non-catastrophe aggregate reinsurance
                                                                      H2 18 Events – impact not included in reported loss to 31 March 2018
    programme to be fully utilised this financial year
                                                                      Auckland Storm Apr-18             N/a          $7.2m            $5.0m         $2.2m
•   Tower is currently pricing further aggregate reinsurance cover    North Island
                                                                                          Apr-18        N/a          $1.8m           $0.2m          $1.6m
    for the remaining 4 months of the year, to manage further         Storm
    volatility driven by multiple weather events                       Note: Estimated reinsurance recoveries includes amounts received under
                                                                       aggregate and proportional treaties                                      9
Underwriting profit growing
Transformation is driving improved underwriting profit

           NZ UNDERLYING PROFIT TREND (NZ$m)
                                                                             •   Underwriting profit increased
                                                                     2.9
                                                                                 $2.3m vs. H1 17, before tax and
                                  1.9                  2.6
            2.5                                                                  excluding large loss events
3.2                                                                  12.7    •   Improvements reflect:
            9.3                  10.4                 10.2
5.4                                                                               •   new approach to pricing
                                                      (2.4)
                                  (5.1)                              (5.2)        •   actively targeting profitable
                                                                                      market segments
H1 16      H2 16                 H1 17                H2 17          H1 18
                                                                                  •   better control of claims costs
                  Investment income less financing costs
                  Large loss events
                  Underwriting profit, excluding large loss events

                                                                                                              10
Focus on costs
Cost saving initiatives delivering sustainable cost base

ACHIEVEMENTS

 Maintained focus on efficiency and productivity                                          MANAGEMENT EXPENSE
                                                                                  42.2%
 Investment made to deliver ongoing and sustainable cost                                      41.6%
                                                                        59.0                                40.8%                                 42.0%
    management
                                                                        57.0                                              38.9%           38.9%   40.0%
 Continued review of existing supplier contracts and close             55.0
                                                                                                                                                  38.0%
    management of all contract negotiations                             53.0
                                                                                                                                                  36.0%
                                                                        51.0
INVESTMENT WILL ACCELERATE TRAJECTORY                                   49.0       53.6                                                           34.0%
                                                                                                52.8                                      52.1
                                                                                                              51.8
                                                                                                                           50.6                   32.0%
                                                                        47.0
•   IT simplification will deliver significant productivity gains and
                                                                        45.0                                                                      30.0%
    step-change in expense reduction
                                                                                  H1 16        H2 16         H1 17        H2 17           H1 18

•   In shorter term, additional spend is required for legacy system                           Management Expenses         Expense Ratio

    stabilisation and changing compliance requirements                  Note: Management expenses include commission cost, depreciation and
                                                                        amortisation and excludes corporate transaction costs.

                                                                                                                                            11
Financial performance

Jeff Wright
Chief Financial Officer
Financial performance
Business turnaround well underway, as evidenced by strong growth and
contained expenses
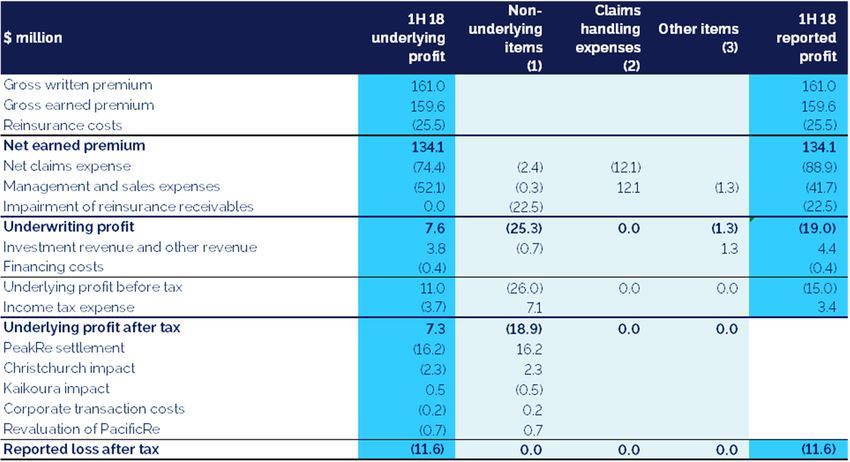
GROUP PROFIT SUMMARY (NZ$m)
$ million                              H1 18      H1 17       •   Significant growth in GWP of $15.2m
Gross written premium                   161.0      145.8
Gross earned premium                   159.6      150.5       •   Underlying profit of $7.3m after tax, was
Reinsurance costs                      (25.5)     (23.8)
Net earned premium                     134.1      126.8           affected by severe and unprecedented
Net claims expense                     (67.9)     (59.6)          storm activity
Large events                             (6.5)        (5.1)
Management and sales expenses           (52.1)     (51.8)
Underwriting profit                        7.6      10.4          − A $15.0m gross loss due to storms was
Investment revenue and other revenue
Financing costs
                                           3.8         2.4          reduced to $7.0m by reinsurance
                                         (0.4)      (0.2)
Underlying profit before tax              11.0       12.6
Income tax expense                        (3.7)      (4.5)    •   Reported loss of $11.6m after tax driven by
Underlying profit after tax                7.3         8.1
PeakRe settlement                      (16.2)          0.0         $16.2m after-tax impact from resolution
Christchurch impact
Kaikoura impact
                                         (2.3)      (9.8)           of Peak Re dispute
                                           0.5       (7.2)
Corporate transaction costs              (0.2)       (1.0)
Revaluation of PacificRe                 (0.7)         0.0    •   Canterbury provisions continue to stabilise
Business in runoff
Reported loss after tax
                                           0.0
                                       (11.6)
                                                        1.7
                                                    (8.2)
                                                                  with $2.3m impact in first half

Key ratios
Loss ratio                             55.5%      51.0%
Expense ratio                          38.9%      40.8%
Combined ratio                         94.3%      91.8%                                                         13
Movement in underlying profit
         Growth in premiums and stable management expenses offset by
         weather events and large claims in the Pacific

                     MOVEMENT IN UNDERLYING PROFIT BEFORE TAX (NZ$m)

                                                                                                                                         • Net earned premium higher due to
                                                        0.3            0.4                                                                 growth in core book and new
                                       1.4
                                                                                        1.5                                                approach to pricing

                       7.4                                                                                                               • Improved investment income a result
                                                                                                          8.3
                                                                                                                                           of increased balances

                                                                                                                                         • Management expenses continue to
                                                                                                                                           be contained
     12.6
                                                                                                                          11.0
                                                                                                                                         • Increase in net incurred claims
                                                                                                                                           reflective of severe weather, a
                                                                                                                                           number of large house fires and large
H1 17 Underlying    Net earned      Investment    Financing costs   Management   Large event claims   Net incurred   H1 18 Underlying      claims in the Pacific
profit before tax    premium     income and other                    expenses                           claims       profit before tax
                                      revenue

                                                                                                                                                                            14
Premium remains stable across Pacific
Pacific business impacted by large commercial claims and Cyclone Gita

PACIFIC PROFIT SUMMARY (NZ$m)                                             MIX OF PACIFIC REVENUE – TOP FOUR
$ million                                   H1 18       H1 17                         COUNTRIES
Gross written premium                                                                      H1 FY18
                                             27.8       28.3
Gross earned premium                          28.1      28.4                               H1 FY17
                                                                                                        34%
Reinsurance costs                             (7.5)      (7.6)              30%            H1 FY16
                                                                                       32%
Net earned premium                           20.7       20.8              29%
Net claims expense                                                                    26%               24%   Fiji
                                             (9.8)      (7.0)
Large events                                                                                                  Papua New Guinea
                                              (1.3)       0.0
Management and sales expenses                                                                                 American Samoa
                                             (8.7)       (7.4)
Underwriting profit                                                         14%        14%              14%   Vanuatu
                                               0.9        6.4
Investment revenue and other revenue           0.4        0.3
                                                                                                        8%
Underlying profit before tax                    1.3       6.7                          6%
                                                                            5%
Income tax expense                           (1.0)      (2.3)
Underlying profit after tax                    0.2        4.4            1H16       1H17             1H18

 • Underlying result reflects changing country mix, a            • Growth in Fiji and Vanuatu offset by softening market
    number of large claims, Cyclone Gita, and investment           and tightened approach to risk in Papua New Guinea
    in a new Pacific hub
                                                                                                                        15
Canterbury update
        Solid progress continues to be made towards finalising Canterbury
        earthquake legacy
                           MOVEMENT IN PROPERTIES
                                                     23                                                          • Gross ultimate claims increased $0.7m
                                66                                       159

                                                                                                                 • Case estimates almost halved and risk margin significantly
          323                                                                                                      increased since September 2016
                                                                                               253
                                                                                                                 • Number of open Canterbury Earthquake claims reduced by 70
   Open properties         New properties         Reopened              Closed         Open properties 31
    30 September                                                                          March 2018             • 253 claims remain open
        2017

                                 RESERVING UPDATE                                                                       51 claims currently under litigation

                                      % of case            % of case           % of case             % of case
                                                                                                                        35 “Protocol 1” claims3
 (NZ$m)                     Mar‐18 estimates2     Sep‐17 estimates2 Mar‐17 estimates2      Sep‐16   estimates2
                                                                                                                        167 claims moving towards settlement

Case estimates                 48.0                 58.9                73.9                 93.2                • Decision made to close Christchurch office at conclusion of
                                                                                                                   Canterbury Earthquake recovery programme
IBNR/IBNER1                    22.0                 34.4                47.4                 44.0
Risk margin                    10.8                 13.9                18.2                 11.9
Additional risk margin         10.0                 10.0                   ‐                    ‐
Combined
                               42.8    89%          58.3     99%        65.6     89%         55.9      60%
IBNR/IBNER/risk margin
                                                                                                                 Notes:
Gross outstanding claims       90.8                117.2               139.5                149.1                1. IBNR / IBNER includes claims handling expenses
                                                                                                                 2. Ratio of IBNR / IBNER plus risk margin to case estimates
                                                                                                                                                                                                                   16
                                                                                                                 3. Protocol 1 claims are where EQC are managing repairs yet the total cost is over the EQC cap.
EQC receivables
    Tower continues to progress recovery programme and remains
    confident in its position
• EQC receivables are fundamentally different to Peak Re, which was a
  single issue with a binary outcome and recorded at 100% in financial             LAND $13.5M                     BUILDING $53.4M
  statements
                                                                                   COMPONENTS                            COMPONENTS
• EQC receivables has multiple dimensions, with alternative causes of          •   Land remediation     •   Apportionment of EQC liability for a
  action                                                                                                    variety of case types
                                                                               •   Foundation repair
                                                                                                                          PROGRESS
                                                                                     PROGRESS
• The value of EQC receivables recorded in financial statements is
                                                                               •   Recovery action      •   Significant resources dedicated to
  actuarially valued at $66.9m, significantly less than Tower’s estimates of                                building recovery programme
  the total amount due                                                             commenced on a
                                                                                   subset of land       •   Discussions with EQC commenced
                                                                                                            and Alternative Dispute Resolution
• If $66.9m is received from EQC, $18.5m will be payable to reinsurers         •   Further litigation
                                                                                   expected                 (ADR) process commenced
                                                                                                        •   Litigation will be pursued if outcome
• Resolution is unlikely to be a single event and will possibly occur over a       RECOVERY                 is not reached through ADR
  number of years                                                                  OPTIONS
                                                                                                                   RECOVERY OPTIONS
                                                                               •   Litigation
• Proceedings against EQC have been issued in regards to a subset of land                               •   Alternative dispute resolution
                                                                               •   Negotiated
  claims, with a court hearing expected in early 2019                              settlement           •   Negotiated settlement

• Tower continues applying significant resources to the EQC recovery                                    •   Litigation
  program and based on legal advice to date remains confident in its
  position                                                                                                                              17
Strong capital and solvency position
       Capital base allows investment in transformation

   TOWER INSURANCE LIMITED SOLVENCY POSITION                                CAPITAL RAISE COMPLETED
           PLUS CORPORATE CASH ($m)
                                                                            • Capital raise successfully completed with over 88% of
                                                                              shareholders taking up rights
                                              Net cash held in corporate
300%                                                                        • Strong capital base allows investment in future and
                         39
                                                                              acceleration of transformation into a challenger brand
            1                       39        TIL's solvency margin above
                         47                   RBNZ minimum
200%        38
                                    25                                      STRONG CAPITAL POSITION
180%                                          TIL's RBNZ minimum
                                              solvency margin
           50           50          50                                      • $75m of solvency margin held in Tower Insurance Limited (TIL);
                                              TIL's MSC                       $25m above RBNZ requirements
100%

            61          60          59        BNZ facility (drawndown)      • Additional $39m of cash held in Tower Limited’s corporate
                                                                              entities
           -30
                                                                            • As at 31 March, the combination of TIL’s solvency margin and
                                                                              corporate cash were $114m above TIL’s minimum solvency
        As at Sep-      Post     As at Mar-                                   capital, equivalent to 294% of MSC
            17         capital       18
                     raise as at
                       Dec-17

                                                                                                                                       18
FY18 outlook

   Strategy and outlook

   Richard Harding
   Chief Executive Officer
Clear strategic plan to grow Tower as the
  leading digital challenger brand
                                                                                                                  Challenger
                                                                              Customer
                                    Digital
                                                                                                                  brand
                                                                              experience
Traditional                         distribution                                                                         Personalised price,
insurance                                                                        Setting it right at the moment
                                                                                              of truth
                                                                                                                         cover, and service

                                       Digital self-service and
                                         engagement tools                                                           Power to choose when and
     Product and price                                                          Predictive modelling and data              how to pay
       transparency                                                                        analytics
                                    Partnerships through extended
                                              ecosystem                                                               Community of loyalists
     Simplification of                                                                                                 and vocal advocates
                                                                                Simple and easy underwriting
  policies and processes
                                                                                   and claims experiences
                                         Pacific operating
                                        model & growth plan                                                          Innovative leadership (i.e.
Underwriting refinement and                                                      Automation and technology                instant claims)
     capability build                                                               to accelerate claims
                                      Product and underwriting
                                          experimentation                                                          Challenger culture, capability,
      Claims process                                                            Sophisticated pricing and risk            and leadership
         efficiency                                                                    understanding
                                     Data-driven insights for risk
                                        and decision-making
  IT refresh, security, and
 regulatory requirements

       Solid foundations in place                                    To achieve high performance, investment is required                             20
Transformation is accelerating momentum
Transforming all aspects of our business is delivering improved
results and creating a unique offering for customers

      SIGNIFICANT BENEFITS                                       MEDIUM TERM TARGETS
       Simple, customer focussed products

       Easy product experimentation and development             Challenger brand delivering:
       Granular, automated pricing and underwriting
                                                                 • GWP growth of 4 – 6%
       Improved access and use of internal and external data
                                                                 • Expense ratio
IT simplification enables transformation
Decision made to invest $33.5m to accelerate transformation, with
amortisation in line with current levels
1 NEW CORE PLATFORM – APPROXIMATELY $24m
     Flexible, modern, integrated core insurance platform that will deliver the capability
      to drive and accelerate change

     New business to go live on new platform in first half of 2019 calendar year, with         $8m          Amortisation outlook
      product rationalisation and customer migration in the following 12 months

     Platform will allow improved use of internal and external data, enabling targeted and
      granular pricing                                                                          $6m

2 DIGITAL TRANSFORMATION – APPROXIMATELY $6m                                                    $4m
     Full digital integration will enable a truly self service, omni-channel offering for
      customers
                                                                                                $2m
     Online claims lodgement, tracking and management will revolutionise the way
      customers manage their claim

     Ability to offer specialised and targeted offers to highly profitable customer segments   $0m
                                                                                                      FY17                FY18          FY19            FY20
      based on individual needs and wants
                                                                                                      IT Simplification          Other capitalised software
3 ADDITIONAL OPERATIONAL INVESTMENT – APPROXIMATELY $3.5m
     Improved business processes and systems delivering significant efficiencies and
      enabling dynamic and flexible workforce

     Simpler, improved customer communications management system to support and                                                                  22
      enhance unique experience
Implementation plan
Staged implementation to protect and enhance value

                                          FY18                                                          FY19

Getting ready to   Scoping
launch                       Roadmap

                                   Mobilisation

Delivering the                                    Configuration of platform                       New business on sale
new platform                                                      Digital integration and development

                                                                  Product rationalisation

Realising                                                                                         Customer migration (12 months)
benefits                                                                                          Full omni-channel service (ongoing)

                                                                                                  Improved pricing and rating (ongoing)

                                        Current progress

                                                                                                                          23
Driving growth and quality in the Pacific
A new operating model to better meet the needs of our customers,
drive sales growth and realise potential

 •   NZ based manufacturer to leverage
     underwriting, data and pricing capability
     and experience
 •   Local distribution teams to maximise
     individual relationships and local area
     knowledge
 •   Centralised Pacific hub to process high
     volume transactions enabling local teams
     to focus on growth and retention initiatives
 •   Improved underwriting, compliance, pricing
     and product optimisation will ensure long-
     term sustainability

                                                                   24
Tower outlook for FY18
                                       •   Ongoing development and delivery of unique customer value proposition
Accelerate brand transformation        •   Brand transformation activity to enable Tower’s transition into challenger brand territory
and develop unique customer
experience                             •   Continued improvement of digital channels to improve acquisition and conversion

                                       •   Risk based pricing will deliver equitable pricing and continue driving growth
                                       •   Current marketing activity resulting in strong lead enquiry
Expect continuing gross written
premium growth in NZ core book         •   Positive momentum in digital distribution channel
                                       •   Continued pricing and product refinement to offset claims inflation and improve profitability

                                       •   Industry wide claims inflation expected to be offset by product updates, targeted rate/pricing changes and
                                           supply chain initiatives
                                       •   Aggregate reinsurance cover fully utilised.
Claims expenses to be controlled
                                       •   Tower is currently pricing further aggregate reinsurance cover for the remaining 4 months of the year, to
                                           manage further volatility driven by multiple weather events

                                       •   Maintain current expense level
Management expenses
                                       •   Investment is being made to deliver IT change and growth
maintained

                                       •   New operating model to improve risk management and underwriting discipline in key Pacific markets
Pacific offers significant potential   •   Repricing of portfolios to improve profitability

                                       •   Significant management focus will go into IT simplification and EIS implementation in FY18
Investment in simplification will
accelerate improvements in FY19        •   Step-change in expense reduction and productivity gains to be realised following implementation of new
and beyond                                 technology systems which is expected to yield benefits from FY19
                                                                                                                                                        25
Appendices
New Zealand business improving
Improvements in key focus areas offset by storm activity and
large events

NEW ZEALAND PROFIT SUMMARY (NZ$m)

$ million                                H1 18      H1 17
Gross written premium                     133.2        117.5    •   Improvements in underlying
Gross earned premium                       131.5     122.2          business offset by natural events
Reinsurance costs                         (18.0)      (16.2)
Net earned premium                        113.5     106.0       •   Increase in GWP on back of new
Net claims expense                       (58.0)      (52.6)         pricing approach, customer growth
Large events                                (5.2)       (5.1)       and retention initiatives
Management and sales expenses            (42.8)     (42.9)
Underwriting profit                           7.5        5.3
                                                                •   Claims costs increase due to
Investment revenue and other revenue         2.9         1.9
                                                                    unusually large number of weather
Underlying profit before tax                10.4         7.3
                                                                    events and industry wide inflation
Income tax expense                          (2.8)      (2.6)
                                                                •   Management expenses contained
Underlying profit after tax                   7.6        4.7

                                                                                                  27
Balance sheet
Tower Group
$ million                        31 March 18 30 September 17 Movement $ Movement %

Cash & call deposits                  142.6          102.9         39.8      38.6%
Investment assets                      157.3         167.9        (10.7)     (6.4%)
Deferred acquisition costs              21.2          21.0          0.2         1.1%
Intangible assets                       31.6          31.3          0.2       0.8%
Other operational assets              310.3          334.1       (23.8)       (7.1%)
Total assets                          662.9          657.2          5.7       0.9%
Policy liabilities & insurance
                                      320.2          336.0       (15.8)       (4.7%)
provisions
External debt                           0.0           29.9       (29.9)     100.0%
Other operational liabilities           74.7          75.5         (0.8)      (1.0%)
Total liabilities                     394.9          441.4       (46.5)     (10.5%)
Total equity                          268.0          215.7         52.3       24.2%

                                                                                       28
Reconciliation between underlying profit
after tax and net profit after tax

1.   Non-underlying items are shown separately in Tower’s management reporting, yet included within ‘net claims expense’, ‘management and sales expenses’ and ‘tax expense’ (depending on the nature of the item) in
     the financial statements.
2.   In Tower’s management reporting, claims handling expenses are reported within ‘management and sales expenses’. In the financial statements, claims handling expenses are reclassified to ‘net claims expense’.       29
3.   Certain items of revenue are netted off ‘management and sales expenses’ in Tower’s management reporting, and are reclassified to ‘other revenue’ in the financial statements. This primarily relates to commission
     received by Tower.
Reinsurance structure overview
The excess on the aggregate cover has increased to $7m
and the limit on catastrophe cover increased to $790m
STRUCTURE OVERVIEW (per event)                        AGGREGATE COVER OVERVIEW FOR FY18
                                                  •    Minimum event size of $1m to qualify, max of $5m per event
                                                       coverage
                                                  •    $10m cover once $7m excess filled
             $790m
                                   Catastrophe    •    No coverage for earthquake in New Zealand
                                       Cover
                                    (including
                                   earthquakes)                                                     Max coverage of
                                                                                                     $5m per event
Event Size

                                   $10m excess            Excess of $7m -
                                   $790m limit              Tower cost                    7                                  $10m coverage
                                                                                                                               exceeded
              $10m
                                                                                          2

                                                         4               4                                                              4
                                                                         1                                              3
                                                                                          5             2                1
              $5m                                        4                                                                              4
                     Aggregate –                                         3
                                                                                                        2               2
                       $5m per
                      event (non                      Event 1         Event 2         Event 3        Event 4          Event 5         Event 6
                     earthquake)
                                                      Contribute to excess (Tower cost)   Covered by aggregate   Above coverage (Tower cost)
                                                                                                                                                30
Disclaimer
This presentation has been prepared by Tower Limited to provide shareholders with information on Tower’s business. This document is part of, and should be read in

conjunction with an oral briefing to be given by Tower. A copy of the webcast of the briefing is available at http://www.tower.co.nz/investor-centre/ It contains summary

information about Tower as at 31 March 2018, which is general in nature, and does not purport to contain all information a prospective investor should consider when evaluating

an investment. It is not an offer or invitation to buy Tower shares. Investors must rely on their own enquiries and seek appropriate professional advice in relation to the

information and statements in relation to the proposed prospects, business and operations of Tower. The data contained in this document is for illustrative purposes only. Past

performance is not a guarantee of future performance and must not be relied on as such. The information in this presentation does not constitute financial advice.

Forward looking statements

This document contains certain forward-looking statements. Such statements relate to events and depend on circumstances that will occur in the future and are subject to

risks, uncertainties and assumptions. There are a number of factors which could cause actual results and developments to differ materially from those expressed or implied by

such forward-looking statements, including, among others: the enactment of legislation or regulation that may impose costs or restrict activities; the re-negotiation of contracts;

fluctuations in demand and pricing in the industry; fluctuations in exchange controls; changes in government policy and taxation; industrial disputes; and war and terrorism.

These forward-looking statements speak only as at the date of this document. Solvency estimates contained herein are yet to be reviewed by the Reserve Bank of New

Zealand.

Disclaimer

Neither Tower nor any of its advisers or any of their respective affiliates, related bodies corporate, directors, officers, partners, employees and agents (other persons) makes any

representation or warranty as to the currency, accuracy, reliability or completeness of information in this presentation. To the maximum extent permitted by law, Tower and the

other persons expressly disclaim any liability incurred as a result of the information in this Presentation being inaccurate or incomplete in any way. The statements made in this

presentation are made only as at the date of this presentation. The accuracy of the information in this presentation remains subject to change without notice.
                                                                                                                                                                                 31
You can also read