CHARACTERIZATION OF STRAIN RATE DEPENDENCE IN THE MECHANICAL BEHAVIOR OF GOLD THIN FILMS
←
→
Page content transcription
If your browser does not render page correctly, please read the page content below
CHARACTERIZATION OF STRAIN RATE DEPENDENCE IN THE
         MECHANICAL BEHAVIOR OF GOLD THIN FILMS

                                             Colin P. Bateson
                                   Mechanical and Aerospace Engineering
                                          University of Virginia
                                      Charlottesville, Virginia 22904
                                      E-mail: bateson@virginia.edu

                                       Advisor: Dr. Ioannis Chasiotis
                                           Aerospace Engineering
                                 University of Illinois at Urbana-Champaign
                                           Urbana, Illinois 61801
                                         E-mail: chasioti@uiuc.edu
                                                       ABSTRACT
          The effect of strain rate on the mechanical behavior of gold thin-films for RF-MEMS applications was
examined. Microscale, free-standing, dog bone shaped specimens were subjected to uniaxial tension tests at strain
rates ranging between 10-6 s-1 and 10-3 s-1 via a custom built testing apparatus. The specimens, fabricated using e-
beam evaporation, had gage sections 1000 µm long and 200 µm wide, with thickness varying between 500 and 650
nm. The specimens were fabricated as 200 nm multi-layers with 100 nm average grain size. Force and
displacement data were collected and used to construct stress-strain curves. The specimens exhibited elastic-nearly
perfectly plastic behavior at all strain rates excluding the slowest (10-6 s-1) where local stress peaks were observed.
Material yield strength and peak stress, ranging from 120-300 MPa and 140-365 MPa respectively, both increased as
the strain rate increased. For high strain rates the ductility was measured to be about 1.9%, increasing to 4.5% for
the lowest strain rate. These values were found to be consistent with those published in literature. In general, the
material exhibited qualitative trends as expected for the variation in strain rate except, as mentioned before, at the
slowest strain rates.

                     INTRODUCTION                            studies on gold thin films since 2003 investigating size-
          Microelectromechanical Systems (MEMS)              effects on mechanical behavior using a Membrane
have the potential to revolutionize the space industry.      Deflection Experiment (MDE).[4] More recently in
Some of the space specific advantages of MEMS                2003, Li and Cima conducted bulge tests on gold thin
include the drastic reduction in mass, volume, and           films reporting values for bulk modulus and yield
power requirements.          This will directly impact       strength, the later of which were slightly higher than
spacecraft, test facilities, and most important, launch      those values measured by Espinosa and Prorok.[5] This
costs.[1] However, the utilization of MEMS in space          research project was designed to investigate the effects
applications has been limited due to concerns about          of strain rate on the mechanical behavior of gold thin
their reliability and survivability in the harsh space       films focusing specifically on the changes in ductility,
environment.[2] Only thorough testing of MEMS                yield stress, and strength as a function of strain rate.
devices and materials will ever abate these concerns.
          Gold has been identified as an ideal candidate                            MATERIALS
material for radio frequency (RF) MEMS due to its            Specimen Fabrication
chemical inertness, low processing temperature, and                   The specimens used for this research project
outstanding electrical conductivity. A literature survey     were freestanding evaporated gold thin films fabricated
showed that testing of gold thin films is a recent           in Univ. of Virginia’s Microfabrication Laboratory
development and much about the mechanical behavior           using modern photolithographic techniques. First, a
at the microscale is still uncertain. Gudlavalletti et al.   silicon wafer was covered with AZ4110 photoresist and
studied the stress-strain response of gold thin films as     spun up to 7000 RPM for 30 seconds. This resulted in
early as 2002, reporting values for ductility, yield and     a layer of photoresist 0.7 um thick. The wafer was then
maximum stress.[3] Espinosa and Prorok have done             allowed to sit for a few minutes before it was softbaked
to solidify the photoresist. Next, the anchor holes were     final stages of fabrication leaving the specimens
patterned and etched out of the photoresist. This            suspended in midair, hence the term freestanding. To
allowed the bimetallic layer of titanium (Ti) and gold       protect the specimens prior to testing, the paddle is
(Au) evaporated onto the wafer to adhere to the silicon      secured to the silicon wafer with tethers connected to
and form the anchor points, while the rest of the            anchor tabs that are firmly attached to the silicon
metallic layer was evaporated up on top of the               substrate just like the anchor. The paddle is filled with
photoresist. The layer of Ti is used to help the Au stick    etch holes to facilitate the removal of photoresist by
to the silicon wafer, something Au does not do well on       increasing the surface area exposed to the etchant, and
its own. After the initial 100 Å layer of Ti, subsequent     to facilitate glue adhesion between the test grip and the
layers of gold 2000 Å thick were deposited until the         specimen.
total desired specimen thickness was reached. This was
done to insure that the microstructure and grain size of
the specimens remained constant regardless of
specimen thickness. After the evaporation process, the
specimen outline and paddle etch holes were then
patterned and etched out of the gold. The removal of
the remaining photoresist resulted in a set of
                                                             Figure 2: Evaporated gold specimen with dimensions in meters
freestanding specimens. The wafer with freestanding
specimens was submersed in hydrofluoric (HF) acid to                   The gage section of the specimens is 1000 µm
remove the Ti layer, and then finally the specimens          long and 200 µm wide. Including the anchor and the
were released using a CO2 critical point dryer.              paddle, a specimen measures 2800 µm long overall.
                                                             The original intent was to manufacture specimens with
Specimen Geometry                                            three different thicknesses (200nm, 600nm, 800nm) to
          The specimens were fabricated into a classic       add an additional test variable to the experiments, but
tensile test dog bone shape. Their geometry is most          due to some fabrication difficulties with residual
easily described by dividing the specimens into specific     stresses in the material, the manufacturing process had
sections. These sections have been labeled in Figure 1.      to be optimized to minimize these stresses. As a result,
                       The anchor section is evaporated      the variation in thickness was much smaller than
       Anchor          directly     onto    the   silicon    anticipated (650nm, 530nm, 500nm).
                       substrate, and as the name
                       suggests, serves as the anchoring     Equipment
                       point for the test specimen. On                 As mentioned before, the specimens were
      Transition       the other side of the specimen is     manufactured with anchor tabs and tethers to protect the
                       the paddle. This is where the         freestanding portion of the specimen. This meant that
                       specimen is gripped and pulled.       prior to testing these tethers needed to be broken. This
                       The gage section in the middle        task was performed using a device termed a probing
                       of the specimen is the most           station. This probing station consisted of a small chuck
     Gage Section      critical component because this       mounted on four translation stages – one stage for each
                       is the region where failure           of the three directions and then a fourth that moved in
                       occurs and ideally it should be       line with the chuck. A very fine pointed wire was held
                       free of defects or flaws. The         in the chuck, and the translation stages were
                       long length and uniform width,        manipulated to move the wire and prepare the specimen
                       combined with the smooth              for testing.
      Transition
                       circular transition sections, are                The custom built tensile tester consisted of a
                       designed to ensure a uniform          piezoelectric linear actuator and a low force load cell.
                       stress distribution throughout the    Both the actuator and the load cell were mounted on
      Paddle w/
      Etch Holes       gage section. As mentioned            translation stages the combination of which allowed for
                       previously, the gage and paddle       movement in all three directions as well as rotation
                       sections are fabricated on top of     about the axis of travel of the actuator. The translation
     Tethers
                       a sacrificial layer of photoresist    stages were used to accurately align the specimen with
                       that is removed in one of the         the actuator and the load cell to ensure a truly uniaxial
                                                             tensile test. The actuator came with an independent
                        Figure 1: Evaporated gold specimen   controller, which was in turn controlled through a
                        with sections labeled
                                                             computer. The load cell output was connected to a

Bateson                                                                                                                     2
digital multimeter (DMM) that was attached to the setup was meticulously aligned. At this point, the
same computer. actuator was then removed from its translation stage
and UV adhesive was applied to the tip of the glass
METHODOLOGY grip. The actuator was then remounted and the
Specimen Preparation specimen was slowly moved up to meet the grip using a
The specimens were received from the translation stage attached to the load cell. After
fabrication lab in the form of one silicon wafer diced inspecting the connection between the specimen paddle
into four 1x1 cm squares of 20 specimens each. Two of and the glass grip for alignment, positioning, and glue
these four chips had specimens with uniform gage coverage, the adhesive was exposed to UV light and
sections of the type used in this experiment – ten permanently cured.
specimens on each of these two chips for a total of 20
uniform specimens. One of these silicon squares was Running the Test
then glued to a small aluminum square with super glue. After the UV light source was removed, the
The purpose of the aluminum square was to provide a specimen was very slightly buckled to remove any
surface to handle and secure in the test setup. The stress put on the specimen in the mounting process.
aluminum block with the specimens was then examined This also ensured that the entirety of the stress strain
under a microscope and detailed notes were made on response would be captured. At this point, the two data
the quality and appearance of the specimens. The best- collection computer programs were configured and
looking specimens were identified and marked for prepared for testing. The next step required waiting
testing. Digital images were taken of all the specimens patiently for the temperature of the room and the
prior to testing to allow for comparison to similar specimen to stabilize. The setup was considered stable
images taken after testing. Next, the specimens were when the load cell voltage fluctuated less than 1% of
secured for probing. the maximum voltage expected for the experiment over
The probing station, as described previously in a time period equal to the duration of the experiment.
chapter two, was used to prepare the specimens for When a stable condition was reached, the computer
testing. First, the anchor tethers had to be broken to programs were started and the test commenced.
free a single specimen. After the tethers were broken,
the aluminum block was turned 90 degrees, and the Data Collection
wire was worked all the way underneath the specimen The computer programs collected the load cell
to make sure that it was raised up off the silicon voltage values corresponding to the load on the test
substrate and truly freestanding. At this point, the setup, and the actuator voltage values corresponding to
specimen was ready to mount in the test setup. the location of the actuator, or more important, the
displacement imposed on the specimen. Computer time
Test Setup and Preparation stamp values were attached to both voltage readings to
The first step of preparation for testing allow for the independent data files to be matched
involved cutting very thin strips of glass out of together. This data was then stored in text files that
microscope slide covers. These “glass grips,” as they were later manipulated in MATLAB resulting in load
were called, were directly attached to the paddle section and displacement data arrays. These arrays were then
of the specimen, and it was through this grip that a plugged into Excel worksheets created to process the
displacement was imposed on the specimen. The grips data and graphically portray the results.
had to be examined under a microscope to verify that
the tip was extremely square. This was important to Calibration Tests
avoid creating asymmetric stress distributions or stress In order to quantify the accuracy of the data
concentrations in the specimen that would lead to collected, calibration experiments were conducted to
undesirable premature failure. Once an acceptable grip test various parts of the experimental setup. First, the
was decided upon, it was attached to a specially data collection capabilities of the computer and
fabricated “glass grip holder” that served as an interface concomitant hardware needed to be assessed. This was
between the actuator and the glass grip. The grip was done by connecting a function generator and an
secured with an ultraviolet-curable (UV) adhesive, and oscilloscope to the digital multimeter (DMM) and
special care was taken to make sure that cure times sampling various functions at increasing frequencies.
were consistent for all the experiments. Next, the From these tests it was concluded that accuracy
aluminum block with the probed specimen was dropped significantly when the computer was asked to
mounted onto the load cell, and after securing the glass sample at a rate slightly higher than 20Hz. As a result,
grip and grip holder onto the actuator, the entire test
Bateson 3all subsequent tests, including those included in this program designed to compare the two text files and
paper, were conducted at a data-sampling rate of 20 Hz. then match the corresponding voltage values based on
The second calibration test consisted of the computer time stamp associated with each data
quantifying the compliance of the load cell and the rest point. The voltage values were then written to new text
of the test setup. The load cell however was files and subsequently imported into Excel worksheets
significantly more compliant than any of the other created to automatically process the data.
components. Therefore this compliance factor is Worksheets for specimens of the same
referred to as the load cell compliance in the data thickness were combined and the stress-strain (σ−ε)
processing worksheets. Since the data collected from curves were plotted together on the same graph. These
the actuator represented to total displacement of the curves were then color coded according to strain rate to
entire test setup, it was necessary to know the help visualize any data trends. To determine the yield
compliance of setup without a test specimen so that this point and elastic limits, individual σ−ε plots were
displacement could be subtracted from the raw data. printed out and the values were measured by hand. All
This test was performed by setting up for a normal the data was collected and tabulated in a separate Excel
tensile test, but instead of curing the glass grip to a test file and then sorted by strain rate. Multiply sets of data
specimen, the grip was cured directly to the silicon with the same strain rate and specimen thickness were
substrate. This resulted in a calibration factor for the averaged and then added to the data table.
displacement of the test setup minus the test specimen
as a function of load cell voltage. It should be noted RESULTS
that the load cell compliance was accountable for Quantitative strain rate trends in the
approximately 10% of the total measured displacement mechanical properties of the thin films were not as
at the maximum load observed throughout the entirety prominent as they were expected to be. However,
of the experiments. qualitative trends did arise, and interesting results were
The third and final calibration test was observed at the slowest strain rate.
performed to assess the rate sensitivity of the test setup. Strong rate dependency was observed in the
For this calibration, tensile tests were conducted with yield and maximum strengths, as well as the ductility.
amorphous brittle specimens with a known elastic In general, yield and maximum strengths decreased
modulus and similar dimensions to those of the Au with decreasing strain rate while ductility increased,
specimens. The test results were very repeatable which was to be expected theoretically. The elastic
regardless of strain rate therefore showing that the limit was also measured as this property more
testing setup had negligible rate sensitivity. accurately describes the actual transition from elastic to
plastic deformation in the specimen. The numerical
Data Processing results are summarized in Table 1.
The data collection programs would output Examination of the stress-strain (σ−ε) curves
two text files, one for the load cell and one for the showed that the specimens exhibited elastic-nearly
actuator. These files were run through a MATLAB perfectly plastic behavior at all strain rates excluding
Table 1: Properties of Au films as a function of strain rate and film thickness
Specimen thickness Elastic Limit 0.2% Yield Strength Maximum Ductility Number of
(µm)/ (MPa) (MPa) Strength (MPa) (%) Specimens
Strain rate (s-1) Tested
0.5/ 10-3 125 240 300 2.0 3
0.5/ 10-4 90 200 275 2.4 2
0.5/ 10-5 95 210 200 2.4 1
0.5/ 10-6 95 155 175 4.5 2
0.53/ 10-3 220 300 340 1.9 1
0.53/ 10-4 145 255 315 2.5 1
0.53/ 10-5 140 260 315 3.3 2
0.53/ 10-6 95 125 150 4.2 2
0.65/ 10-3 170 300 365 2.2 1
0.65/ 10-4 140 280 335 2.8 1
0.65/ 10-5 120 235 290 2.3 2
0.65/ 10-6 100 180 230 4.7 1
Bateson 4the slowest (10-6 s-1) where local stress peaks were rate, resulting in a considerable contribution to the total
observed. However, these stress peaks failed to appear stress-strain behavior from diffusional creep.[7] The
in the thickest specimens (0.65um) at the 10-6 s-1 strain plots included on this page are grouped together by
rate. The peaks were attributed to the proximity of the specimen thickness.
material’s diffusional creep rate to the slowest strain The variation in the values for yield strength,
maximum strength, and ductility most likely was the
result of tiny flaws in the test specimens. Only
approximately half of the specimens tested were
completely free of visible defects. Defective specimens
were avoided whenever possible, but unfortunately
necessity forced exceptions to be made. Some of the
flaws observed were perfectly linear, extremely faint
scratches that sometimes continued across an entire
chip of specimens. Other flaws could be described as
similar to a small grain of sand squashed between a flat
surface and a thin sheet of paper. After each test, the
notes made prior to testing. Data from specimens that
obviously failed at the same location as a documented
flaw was not analyzed.
There were many other potential sources of
Figure 3: Stress-strain curves for 500nm thick specimens error inherent in the design of the tensile testing
apparatus. First, the specimens had to be aligned by
hand in all three directions, which was a difficult task.
The specimen gripping and curing processes both had
to be done manually. Inconsistencies could have
occurred in the placement of the grip on the paddle of
the specimen, as well as the amount of glue and time
used to cure the grip to the specimens. Lastly, the
probing process is not particularly gentle and the elastic
limit of the specimens may have been occasionally
breached resulting in plastic deformation and strain
hardening. Any of these sources of error could have
contributed to the uncertainty in the results.
CONCLUSION
The experimental results obtained in this
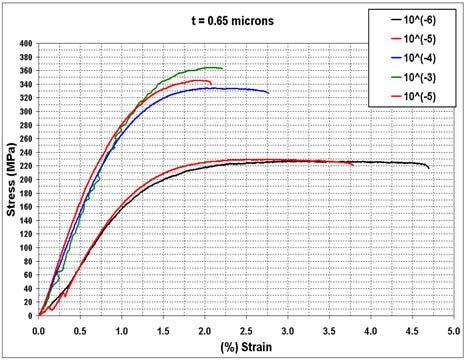
Figure 4: Stress-strain curves for 530nm thick specimens investigation were comparable to those published
previously for gold thin films.[3,4] In general, the stress
and ductility trends for rate dependency agreed with
predictions made based on current theory. Across a
range in strain rates three orders of magnitude
(10-3 s-1 – 10-6 s-1) the following was found:
(1) The 0.2% yield stress varied between 120-300 MPa,
and the elastic limit varied between 65-220 MPa,
for all thicknesses and strain rates. The lowest
stresses correspond to the slowest strain rate, and
vice versa.
(2) The peak stress varied between 140-365 MPa.
Again, the lowest stress corresponded to the
slowest strain rate, and vice versa.
Figure 5: Strain-strain curves for 650nm thick specimens
Bateson 5(3) The ductility was found to vary between 1.9-4.5%, [5] Li. 2003. Bulge test on free standing gold thin
with the highest ductility corresponding to the films. Materials Research Society Symposium -
slowest strain rate. Proceedings Thin Films - Stresses and Mechanical
Properties X 795: 437-442.
(4) Local peak stresses were observed in the thinnest
specimens (530nm, 500nm) at the 10-6 s-1 strain [6] Harris. 1998. Direct observation of diffusional
rate. These peaks were attributed to the proximity creep via TEM in polycrystalline thin films of gold.
of the material’s diffusional creep rate to the Acta Materialia 46, no. 17: 6195-6203.
slowest strain rate, resulting in a considerable
contribution to the total stress-strain behavior.
(5) A strong strain rate dependency was observed in
the material ductility, yield stress and peak stress.
Ductility was found to decrease with increasing
strain rate, while both the yield and peak stresses
increased as the strain rate increased.
ACKNOWLEDGMENTS
The author acknowledges the support provided
by the Virginia Space Grant Consortium that made this
research possible. Additionally, the author thanks the
National Science Foundation for their support under
REU grant CMS #0301584 as well as the University of
Virginia for their generous Harrison Undergraduate
Research Award. The author would especially like to
thank Katherine Timpano, James Stanec, Amanda
McCarty, Charlie Smith, Krishna Jonnalagadda, and
Sung Woo Cho for their contributions to this research.
Finally, the author expresses his deep appreciation for
the time and guidance provided by Dr. Ioannis
Chasiotis. Thank you for this tremendous opportunity.
WORKS CITED
[1] Benoit. 1998. Micro and nanotechnologies: A
challenge on the way forward to new markets.
Materials Science , no. 1-3: 254-257.
[2] Man. 1999. MEMS reliability for space
applications by elimination of potential failure
modes through testing and analysis. Proceedings of
SPIE - The International Society for Optical
Engineering 3880: 120-129.
[3] Gudlavalleti. 2002. Stress-strain response of free-
standing nano-crystalline gold thin-films. Materials
Research Society Symposium - Proceedings 695:
425-430.
[4] Espinosa. 2003. Size effects on the mechanical
behavior of gold thin films. Journal of Materials
Science 38, no. 20: 4125-4128.
Bateson 6You can also read