Status of LHC Kajari Mazumdar TIFR, Mumbai - WHEPPXI, PRL, Ahmedabad
←
→
Page content transcription
If your browser does not render page correctly, please read the page content below
Status of LHC
                      Kajari Mazumdar
                       TIFR, Mumbai

WHEPPXI, PRL, Ahmedabad                 January, 2010
Plan of the talk

•   Recent highlights of LHC machine operation
•   Status of experiments during LHC startup
•   Over all detector performance
•   Initial Physics plots: few examples from CMS, ATLAS
•   Expected Early Physics performance at 10 TeV: few examples from CMS
The LHC at CERN, Geneva
Proton-on-proton collision at LHC
(sx1x2) = (sx) [ “Hard scattering partons” ]
proton x1p x2p proton
proton beams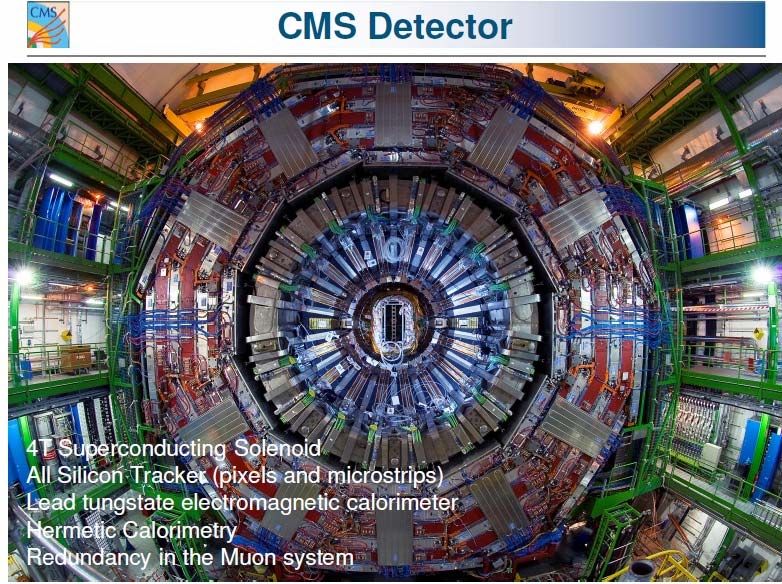
• Proton Beams started circulating in LHC ring in September 2008, beam energy
450 GeV from SPS celebrations everywhere.
• Subsequently, magnet currents ramped up to energize injection beams in LHC
ring accident! LHC delayed by one year!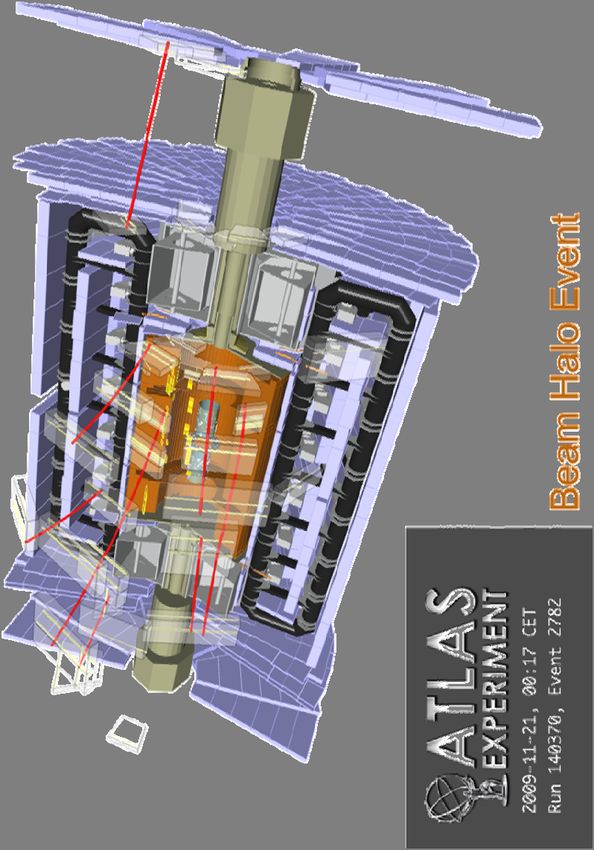
Main events towards start of LHC machine in 2009 • August , 2009: CERN announces LHC will deliver (only proton-on- proton) collisions at 7 TeV in 2009. • End-October, 2009: LHC machine is cold (27 km @ 4 Kelvin) • 20 November, 2009: proton beams in orbit, well-tuned • 21 November, quiet beam Beam size ~ 300 m in transverse, 10.5 cm in horizontal direction Impressively small dispersion, lifetime upto several hours. • Beam intensity < 5. 10 9 protons/bunch • Experiments observe beam halo muons, beam splashes during November 20,21, 22 • 23 November: first collisions at LHC at 900 GeV (Pilot Run) Nov.30: collisions at 2360 GeV LHC sets the world record in energy for hadron collision. Tevatron reach 1960 GeV.
Golden orbits, for 1.18 TeV beam on 1.12.2009
Horizontal position of beam, mm
It took only ~500 sec . to ramp up beam energy from 450 GeV to
1.18 TeV !
History in the making: 4x4 bunches higher luminosity
16 bunches/beam on 16 December.
CMS experiment is on twitter!
Beam is highly sensitive to stray fields, LEP tradition!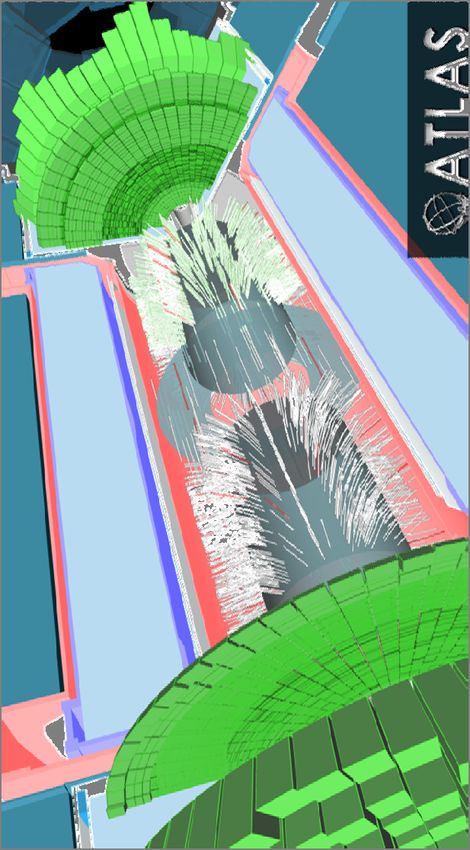
Deviation of beam from accelerator ring in horizontal and
vertical directions r ~ ± 30 m
CMS solenoid 3.8 Tesla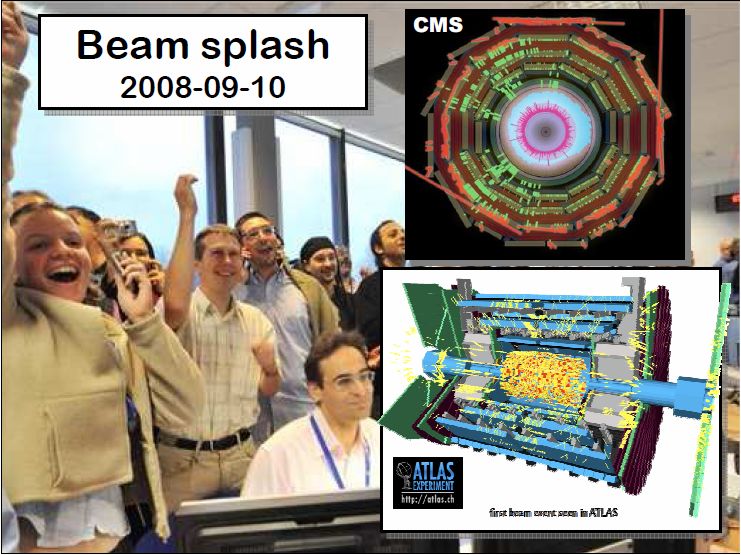
Highly precise beams ramped upto 1180 GeV

Beams affected
by earth’s tides!
Beam Intensity (10 10 protons/bunch), 6.12.2009
Long beam lifetimes

In all aspects LHC machine operations have been impressive
Steve Meyers on December 7, 2009

Expect collision to start with CM energy 7 TeV after mid‐Feb., 2010
Experiments at LHC
• ATLAS : 46m X 25m X 25 m
• CMS : 21m X 15 m X 15 m
• ALICE : 26m X 16 m X 16 m
• LHCb: 21m X 10m X 13m
• LHCf: 2x( 0.3m X 0.8 mX 0.1 m)
• Totem: 440m X 5m X 5m
• ATLAS and CMS are general purpose p-p experiment.
• ALICE is meant for study of quark-gluon plasma in heavy ion collisions.
• LHCb: CP violation studies, using forward spectrometer to detect B-decays and
measure the daughter particles.
• The LHCf experiment uses forward particles created inside the LHC p-p collision
as a source to calibrate cosmic ray interaction with earth’s atmosphere.
• Totem is meant for measurement of total cross-section, elastic scattering and
diffractive events, in effect also measures luminosity delivered (to CMS).Length : ~ 46 m
ATLAS cavern, October 2005 Radius : ~ 12 m
Weight : ~ 7000 tons
~108 electronic channels
14Prologue for physics from collision Main factors to achieve results within few hours of data taking: • Years of test beam activities • increasingly realistic simulations • commissioning with cosmic rays to understand and optimize the detector performance • validation of the software tools •… Experiments have been ready for data !
Status on the experimental front
• All the experiments collected collision data during December 2009.
• During pilot run, experiments had magnetic field turned off.
• The subdetector electronic channels are operational with > 99%
   efficiency.
• Data taking efficiency on average ~ 90% during stable beam conditions.
• Data can be analysed rapidly, using Grid computing facility .
• Detector performances are according to design.

ALICE put up on arXive first paper on charged multiplicity within 2 days of
first collision (pilot run) based on 284 events!

ATLAS, CMS have almost final versions of similar study, should be out
soon.

  Real Physics exploitation part will auger in 2010
Events at ATLAS experimental site: First beam circulates on November 20 See beam halo muons
Beam Splashes during Nov. 20,21, 22, 23 • Avalanche of scattered particles from beam-on-collimator hits 450 GeV protons, ~ 10K in number, hits heavy metal foil few 10s of m upstream of the detector. • Detectors fully lit, typically few hundred thousands hits in central detector. • About 3000 TeV energy recorded in calorimeter part of the detetctor.
Beams collide in ATLAS, Nov. 23, 14.22 CET
Background separation in ATLAS
• The ATLAS beam pickups showed a phase inconsistency of 900 ps
causing the primary vertex to be shifted by 13.5 cm in z
• Based on this information, at around 14:50, the LHC operators
performed an RF cogging to correct the z positioning of the beam
spot at IP1
Before RF cogging After RF cogging
Applied shift of 900 ps
providing vertex shift of +13.5 cm
Bunches stable within 20 ps (RMS) !
Beam pickup scope shots, beam 1 & 2The “ALICE fill” (ca 16:35) on 23.11.2009
• Sequence of events:
– beam 1 injected, captured, circulating
– data taking started
– at 16:38 beam 2 injected on “P2” bucket, captured, circulating
– as soon as beam 2 injected, the ALICE trigger rate jumps from a few 10‐3 s‐1
(with beam 1 bunch only) to ~ 10‐1 s‐1 no further adjustment needed
– within seconds, the first event popped up on the display
– at 17:21 the beams were dumped and the run closed with 284 events
– Estimated integrated luminosity ~ 8 mb‐1
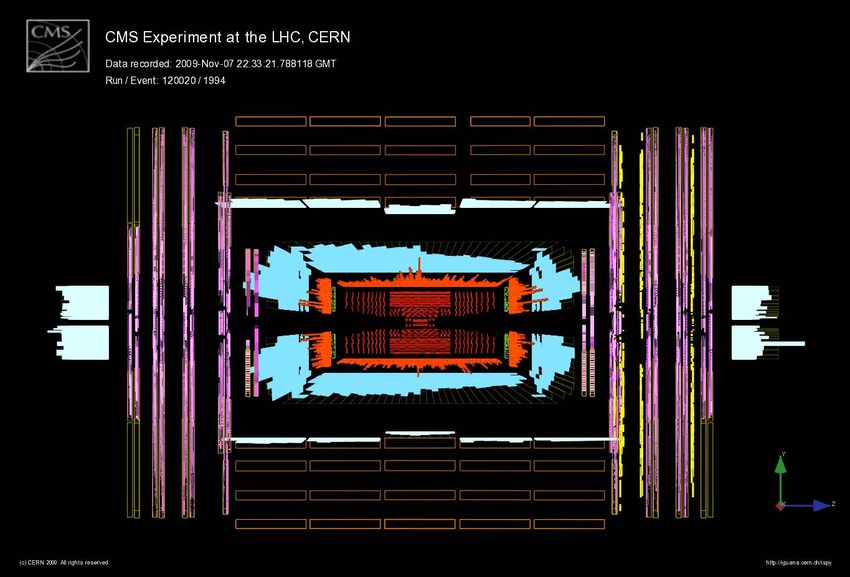
21“Splash” Event in CMS (calorimeter on, tracker, magnet off)
Beam circulating, Halo Muon in CMS
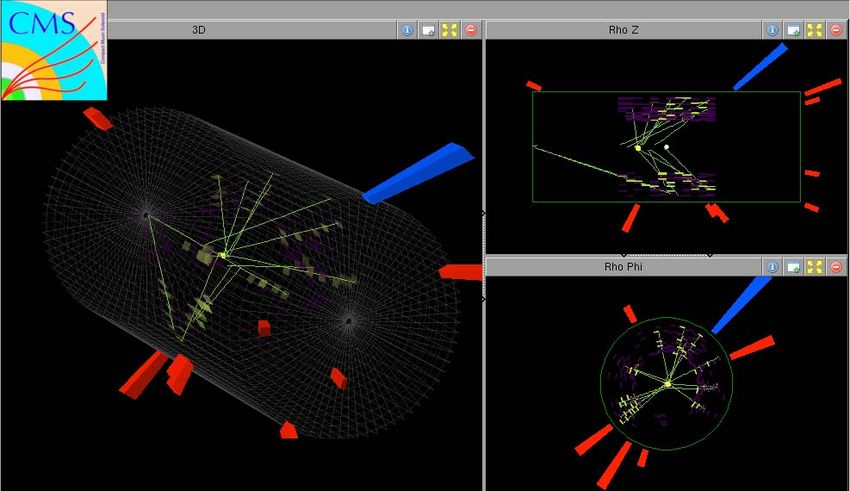
23.11.09 afternoon: While ATLAS and Alice started recording collisions at the
centre of their detector, beam2 needed better steering at CMS (straight charged
                      tracks seen without magnetic field on)

           Mon 23 Nov 14:46                   Apparent vertex at -60 cm

Difficult to conclude that
we see collisions
Main goals of 2009 collision data • Commission of various worksflows, like, Data quality monitor, Monte carlo tuning, .. • Retune selections and understanding of physics objects, like: jets , photons, electrons, muons, missing transverse energy,.. in minimum bias data. • Perform early physics analyses: charged hadron multiplicity, transverse moemntum spectrum, jet spectrum, underlying events, low mass resonances in muons, photons • Prepare for higher energy runs in 2010: study of fake rates, b‐ tagging,..
Total cross-section: Elastic, inelastic and diffractive.
Diffraction: one or both of beam particles excited to higher mass state

• Fraction of total events in pythia simulation: 22% SD + 12% DD + 78% NSD.

• Only the inelastic component of total cross-section is measured by CMS, ATLAS.
• CMS, ATLAS detectors are meant for physics with high momentum particles.
Rates of various processes in hadron collision Reduction in CM energy from 14 to 10 TeV degraded sensitivity for discoveries: 200 GeV Higgs down by 50% 2 TeV Z’ reduces by 30% New Physics with scale > 4 TeV reduced by order of magnitude! Sensitivity to un-explored physics reduces further for 7 TeV Uncertainty in measurement of various cross-sections is mostly dominated by that in Parton density function. Several measurements at LHC will estimate the pdfs accurately and consistently.
Event Trigger and analysis in CMS
Use beam monitoring systems
1. Beam Scintillator Counters @ ~ ± 11m from IP, 3.23 ≤|| ≤ 4.65
measure hit and coincidence rates, resolution 3 ns.
mip detection eff. ~ 96%
2. Beam pick‐up devices @ ± 175 m from IP
precise information on bunch structure and timing of incoming beams
Total triggered event ~ 240k
Primary vertex reconstruction: use tracks with P_T > 900 MeV/c
_xy : 0.5 mm
Prob. of multiple collision in same event ~ 10 ‐4
Event selection eff.: 16.5%, 30.6%, 79.5% for Single diffractive, Double and non-
single diffractive eventsLuminosity determination @ ATLAS
• 197 golden collision candidates from data of Nov 23, in 2 parts.
• From Monte Carlo (solenoid field on) , the selection efficiency, including
trigger, for inelastic and diffractive minimum bias events is about 70%
• Using as total minimum bias cross section of 58 mb
40 mb inelastic, 12 mb Single Diffractive (SD), 6 mb
DoubleDiffractive(DD)
L=N/
Sample Number of DAQ Average Average inst. Integrated
events duration rate luminosity luminosity
Sample Number DAQ Average Average inst. Integrated
of events duration rate luminosity luminosity1
A 61 54 mins 0.03 Hz 0.5 × 1024 cm2 s 1 1.5 mb
B 136 46 mins 0.07 Hz 1.2 × 1024 cm2 s1 3.4 mb1
Cross checks: • Assuming that =0% for SD and DD increases luminosity by 10%.
• change inelastic cross section to 34 mb increases luminosity by
15% .Data taken with no magnetic field in tracking
detector Track counting possible
No momentum measurement.
Paper has charged density
distribution based on 284 events.
dn(ch)/ d± 0.15 (stat.) ± 0.25(syst.)
• For NSD interactions,
• consistent with previous measurements in
p‐pbar experiment at the same energy.
CMS unpublished result :
dn(ch)/ d± 0.06 (stat.) ± 0.21(syst.),
Author list and associated
institutes run for 5.5 pages,
before the abstract!
Published in EPJCTransverse momentum distribution, higher tail hard part of collision Pseudorapidity distribution Dominated by softer part of collision Charged particle density increases by factor 1.7 to 1.9 for cm energy increase of 900 GeV to 7 TeV to 14 TeV Phenomenological models describe energy-dependence of total –cross- section and charged multiplicity distribution in terms of some parameters determined from lower energy experiments goes into the complete event simulation /generation Need to re-tune these parameters at new energies . Multiplicity in pp and p-pbar collisions differ at lower energies. At 900 GeV, difference ~ 0.1 %
ATLAS: π0
■ 2 photon candidates with ET (γ) > 300 MeV
■ ET (γγ) > 900 MeV
■ Shower shapes compatible with photons
■ No corrections for upstream material
Note: soft photons are
challenging because of
material in front of
EM calorimeter
(cryostat, coil):
~ 2.5 X0 at η=0
Data and MC normalised
to the same area
34Sunday 6 December: machine
protection system commissioned
stable (safe) beams for first time
full tracker at nominal voltage
whole ATLAS operational
36Rapid analysis in CMS, preliminary results Charged particle spectra Excellenet performance of CMS detector
Onia yield in CMS collision data

Most of the J/ψ in forward region, being with low pt, upto about 0.5 GeV!
Analyzed total minimum bias events: ~12k at 2360 GeV, 321,500 at 900 GeV

                                                 Expect in CMS, at 2360 GeV,
                                                 signal to background ratio~ 16:1,
                                                 after selection, in mass range
                                                 3.0 to 3.2 GeV

                                               Dimuon event in CMS, it is J/ψ !
First Dijet event in ATLAS 2 jets back-to-back in both with (uncalibrated ) ET ~ 10 GeV expect actual/calibrated energy ~ 20 GeV Probability of seeing such a event within a short while= 1 % They have been lucky! of 1.3 and 2.5, ~ no missing ET
3-jet event in CMS, all of reasonably high transverse energy
Photon + jet event at 2360 GeV
ATLAS Jet measurements

                                                  events with
                                                  2 jets pT> 7 GeV

                         Uncalibrated EM scale
                                   43
                         Monte Carlo normalized to number of jets or events in data
Missing transverse energy
■ Sensitive to calorimeter performance (noise, coherent noise, dead cells, mis‐calibrations,
cracks, etc.) and backgrounds from cosmics, beams, …
■ Measurement over full calorimeter coverage (3600 in φ, |η| < 5, ~ 200000 cells)
METx / METy indicate x/y
components of missing ET vector
METx
METx
METy
44NSD: non-single diffractive •Preliminary result: Average charged hadron transverse momentum = 0.46 ± 0.01 (stat) ± 0.02 (syst.) GeV/c
Physics prospect in LHC, near future
Large rates helps many QCD and EW studies
Involving W, Z.
Gluon density falls more rapidly at lower energy
in general signal rate is lower compared to
background at lower energy
signal to background ratio lower.
•Physics potentials at 7 TeV LHC energy are currently Need heavy quark contents of
being evaluated. proton at LHC energies
• Hope of 100 pb-1 of integrated luminosity at 7 TeV
during 2010.W,Z production Fundamental benchmark process at hadron collider. • Processes are well understood theoretically. • Luminosity reaction with potential accuracy of ~ 1%, finally • measure cross-section at new energy regime • Basic event signature: charged lepton, missing energy Starting point for detailed analysis: • Boson Pt spectrum • additional accompanying jets • asymmetries • W-mass and width At startup • Calibration source knowing Z mass • Validate lepton isolation criteria • evaluate reconstruction, trigger, selection efficiencies . • use tag-n-probe method on Z events Rediscovering Standard Model is high on the agenda instead of searches
Asymmetries provide constraint on
parton density function

Z-asymmetry at 10 TeV, electron channel

W-asymmetry at 10 TeV, muon channel

                                          100 pb-1

           10 pb-1
Early physics with leptons
Predicted jet yield: limited reach at lower energy

Many QCD analysis can be done early eg.,
Azimuthal decorrelation in dijet events,
Central transverse thrust, dijet mass
Distribution, dijet rates in two regions of
Pseduorapidity, etc.
Early Top studies at LHC
With few 10 pb-1
Top rediscovery,
Measurement of top-pair
production rate.
With 100 – 300 pb-1
Br(t Wb)/ Br(t Wq)
Light quark content in top,
Re-evidence of single top
First search for high mass
tt-resonance.
For 100 pb -1 and of
energy10 TeV, @ 95% CL
Br exclusion:
Allows direct measurement of Wtb 8.3 pb for M(tt) = 2TeV.LHCb early analysis Clean beam‐gas events ~ 1/min, as expected
Conclusions
All the experiments have successfully collected first LHC collision data.

■ The experiments operated efficiently and fast, from data taking       at
the pit, to data transfer worldwide, to the production of first results (on
a very short time scale … few hours to few days).

■ First LHC data indicate that the performance of the detector,
simulation and reconstruction (including the understanding of material
and control of instrumental effects) is far better than expected at this
(initial) stage of the experiment and in an energy regime ATLAS and
CMS was not optimized for.

This is only the beginning of an exciting physics phase and a major achievement
of the worldwide LHC Collaboration after > 20 years of efforts to build a machine
and detectors of unprecedented technology, complexity and performance.
                                         53
Backup
Search for resonance in ttbar pair (dimuon+x) 10 TeV, 100 pb -1 Many possibilities, Tevatron limit for lepto-phobic resonance > 700 GeV Assume simplest possibility of Z’ tt, width = 1% of mass experimental resolution dominates
Potential for Higgs discovery
With decreasing cm energy signal goes
down faster, since Higgs is mainly produced
via gg fusion, compared to background
• Standard Model Higgs boson can be
Discovered in the range 140-450 GeV, by
Both experiments with 5 fb -1.
Exclusion : with 1 fb -1 at 10 TeV, combining
H ZZ, H WW, channels mass range 150-190 GeV.Jet rate and contact interaction at high scale Jet reconstruction and higher order corrections Cone vs. recombination algorithms Discrepancies between theory and experiments using midpoint algorithm where more partons are allowed in the cone.
LHCf experiment • Dedicated for Astroparticle physics, aimed to operate upto 14 TeV • LHCf will be able to measure the flux of neutral particles (pions as well as neutrons) produced in p‐p collisions at LHC in the very forward region calibration of air‐shower Monte Carlo codes currently used for modeling cosmic rays interactions in the Earth atmosphere, and hence the primary energy of ultra‐high energy cosmic rays. capable of addressing the issue of constituents which contribute to knee region of energy spectra. • 2 small calorimeters, each placed 100 m away from the ATLAS IP. • Sampling and imaging calorimeters inserted inside neutral absorbers • Inside TAN, the 2 proton beam lines separate out LHCf measures particles produced upto pseudo‐rapidity = infinity • Capable of measuring photons upto few TeVs
LHCb is a heavy flavour precision experiment searching
for New Physics in CP Violation and Rare Decays
A program to do this has been developed and the methods,
including calibrations and systematic studies, are being worked out..
CP Violation: 2 fb‐1 (1 year)* Rare Decays: 2 fb‐1 (1 year)*
• from trees: 5o ‐ 10o • BsK* s0 : 0.5 GeV2
• from penguins: 10o • Bs Adir , Amix : 0.11
• Bs mixing phase: 0.023 A : 0.22
• seff from penguins: 0.11 • Bs BR.: 6 x 10‐9 at 5
59Flavour Tagging
Performance of flavour tagging: Efficiency Wrong tag w Tagging power
Tagging power: Bd ~50%
D 2 1 2w
2
Bs ~50% 33% ~6%Particle Identification in LHCb
Bs → Ds K, distinguish
from Bs Ds
,K
Bs K
Ds K
Primary vertex
btB‐Vertex Measurement in Vertex Locator (Velo)
LHCb Silicon strip detector with
Example: Bs → Ds K ~ 5 m hit resolution
30 m IP resolution
47 m 144 m K ) ~40 fs
Bs K Vertexing:
Ds K • Impact parameter trigger
Primary vertex
• Decay distance (time)
d 440 m
measurement
Decay time resolution = 40 fs
B‐mass Measurement m Bs = 5.37 GeV/c2
2
σBs = 13.8 MeV/c
2000 Bs→ Ds K
Bs →Ds
K 1500
Bs
K
Ds K 1000 2
m Bs= 5.42 GeV/c
σBs = 24.0 MeV/c2
Primary vertex
500
bt
0
5.3 5.35 5.4 5.45 5.5 2
Bs mass [GeV/c ]Bs K
Flavour Tagging in LHCb Ds
K
K
Primary vertex
Time‐dependent decays
Perfect reconstruction
1000
Perfect reconstruction
+ flavour tagging
btag
1000
800 • Flavour tagging: D2 = (1‐2w)2 6%
800
Events
600
Events
600
400 Perfect reconstruction
400
1000 + flavour tagging
200 + proper time resolution
200
+ background
0 800
0 0 1 2 3 4 5
+ acceptance
0 1 2 3 4 5
Proper time (ps)
Proper time (ps)
Events
600
Perfect reconstruction
Perfect reconstruction 1000 + flavour tagging 400
1000 + flavour tagging + proper time resolution
+ proper time resolution + background
800 200
800
Events
600
Events
600 0
0 1 2 3 4 5
400 Proper time (ps)
400
200
200
0 0
0 1 2 3 4 5 0 1 2 3 4 5
Proper time (ps) Proper time (ps)Max peak luminosity
seen by ATLAS :
~ 7 x 1026 cm‐2 s‐1
Recorded data samples Number of Integrated luminosity
events (< 30% uncertainty)
Total ~ 920k ~ 20 μb‐1
With stable beams ( tracker fully on) ~ 540k ~ 12 μb‐1
At √s=2.36 TeV (flat top) ~ 34k ≈ 1 μb‐1
Average data‐taking efficiency:
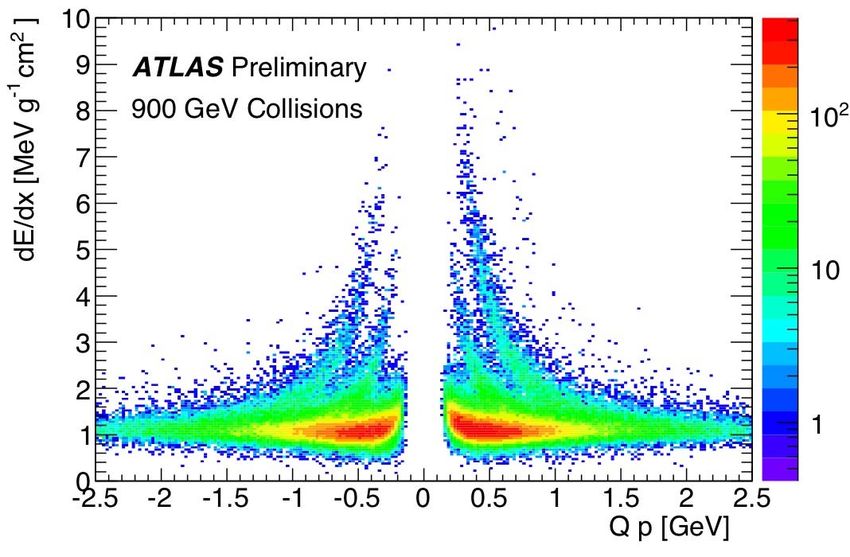
64 ~ 90%Inner Detector
Silicon strips
Pixels
p
180k tracks
K
π
Transition Radiation Tracker
Transition radiation intensity is proportional
to particle relativistic factor γ=E/mc2.
Onset for γ ~ 1000
65Background separation in ATLAS
• ATLAS has taken data before and after the RF cogging
• Must observe shift in z0 of tracks if indeed we select collision
events!
Track z0 distribution of
collision candidate
events taken before
and after RF cogging
Observed shift: +12 cmBeam injection,
record collision HLT active after Rejection factor of ~104
events. LHC declares looking for space points
HLT algos off. stable beam in the Inner Detector at
Level 2 trigger
~20
BPTX prescaled by x20
as input to L2Muon Spectrometer (||
3-jet event in CMS
K 0s + -, p , p + pT (track) > 100 MeV
MC signal and background normalized independently
K0S
Λ
71Measurement of electron and photon
Mass of is low in both data and MC, due to readout thresholds (100 MeV/crystal)
and conversions of g in the materialPerformance of CMS detector
LHCb Detector, ready aligned, mostly tested with cosmics
Higgs event in CMS            Operating conditions:
                     one “good” event (e.g Higgs in 4 muons )
                           + ~20 minimum bias events)

                          All charged tracks with pt > 2 GeV

                       Reconstructed tracks with pt > 25 GeV

                      Event size:                 ~1 MByte
                      Processing Power:           ~X TFlop

                        We have to wait for few years still for
                        this to become a reality
You can also read