Measuring incidence angle for throughthe-objective total internal reflection fluorescence microscopy
←
→
Page content transcription
If your browser does not render page correctly, please read the page content below
Measuring incidence angle for through-
                 the-objective total internal reflection
                 fluorescence microscopy

                 Thomas P. Burghardt

Downloaded From: https://www.spiedigitallibrary.org/journals/Journal-of-Biomedical-Optics on 09 Sep 2021
Terms of Use: https://www.spiedigitallibrary.org/terms-of-use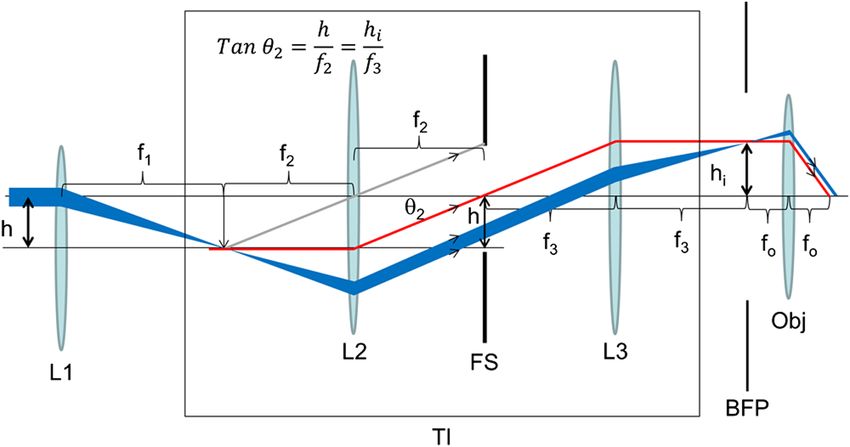
Journal of Biomedical Optics 17(12), 126007 (December 2012)

                Measuring incidence angle for through-the-objective
                total internal reflection fluorescence microscopy
                Thomas P. Burghardt
                Mayo Clinic Rochester, Department of Biochemistry and Molecular Biology, and Department of Physiology and Biomedical Engineering, Rochester,
                Minnesota 55905

                              Abstract. Total internal reflection fluorescence (TIRF) microscopy has the exciting laser beam incident beyond
                              critical angle from the glass side of a glass/aqueous interface formed by the coverslip and aqueous sample.
                              The aqueous side evanescent field decays exponentially with distance from the interface with penetration
                              depth depending on incidence angle. Through-the-objective TIRF has the exciting laser focused at the back
                              focal plane (BFP) creating a refracted parallel beam approaching the interface in the small gap between objective
                              and coverslip, making incidence angle challenging to measure. Objective axial scanning does not affect incidence
                              angle but translates beam and interface intersection detected by the fluorescence center of mass from fluorescent
                              spheres attached to the aqueous side of the interface. Center of mass translation divided by the axial translation is
                              the tangent of the incidence angle that is sampled repeatedly over objective trajectory to obtain a best estimate.
                              Incidence angle is measured for progressively larger radial positions of the focused beam on the BFP. A through-the-
                              objective TIRF microscope, utilizing a micrometer and relay lenses to position the focused beam at the BFP, is
                              calibrated for incidence angle. Calibration depends on microscope characteristics and TIRF objective and is applic-
                              able to any interface or sample. © 2012 Society of Photo-Optical Instrumentation Engineers (SPIE). [DOI: 10.1117/1.JBO.17.12.126007]
                              Keywords: total internal reflection fluorescence; incidence angle; fluorescence microscopy; back focal plane; evanescent excitation
                              profile.
                              Paper 12456 received Jul. 17, 2012; revised manuscript received Oct. 29, 2012; accepted for publication Nov. 1, 2012; published online
                              Dec. 3, 2012.

                1    Introduction                                                                  detection. Through-the-objective TIRF has the disadvantage that
                Illuminating volume shape and size in epi-illumination fluores-                    the exciting light impinges on glass elements internal to the
                cence microscopy is a critical parameter affecting resolution for                  objective, producing scattered and auto fluorescence light that
                scanning and widefield imaging methods. A smaller illumina-                        tends to decrease signal-to-noise ratio.4
                tion volume defines the more resolved imaging capability. Near-                        Prism-based TIRF utilizes a prism to couple the illuminating
                field excitation is nonpropagating and evanescent in one or more                   laser light to the TIR interface while sample fluorescence col-
                spatial dimensions. It is a widely used method with subdiffrac-                    lection is through a water immersion objective.5 This method
                tion limit illumination volume. Total internal reflection fluores-                 does not collect evanescent emission, but coupling the exciting
                cence (TIRF) microscopy is a near-field method that has the                        laser beam to the sample via a prism external to the objective
                exciting laser beam incident beyond critical angle, θc , from                      reduces contaminating background light compared to the
                the glass side of a glass/aqueous interface formed by the cover-                   through-the-objective TIRF method. Around-the-objective
                slip and aqueous sample. The evanescent field produced on the                      TIRF couples the exciting laser beam to the sample using an
                aqueous side decays exponentially with distance normal to the                      external prism and collects both propagating and evanescent
                interface having a penetration depth that depends on incidence                     emission, thereby combining positive features of prism based
                angle, excitation light wavelength, and refractive indices at the                  and through-the-objective TIRF.6
                                                                                                       Through-the-objective TIRF is simple to implement, avail-
                interface.1 Nominal depth is ∼100 nm for a glass/aqueous inter-
                                                                                                   able as an option to most inverted research microscopes, and
                face at visible wavelengths and a 66-deg incidence angle.
                    Through-the-objective TIRF uses a high numerical aperture                      widely used.7,8 Principal features of implementation are depicted
                (NA) objective to simultaneously refract incident light beyond                     schematically in Fig. 1, where lens L1, focusing the exciting
                                                                                                   beam at the objective back focal plane (BFP), directs the laser
                critical angle incidence and collect fluorescence emission over a
                                                                                                   to the lateral position on the BFP that sets incidence angle. Beam
                large solid angle.2 The high NA objective collects both propa-
                                                                                                   incidence angle determines penetration depth.1 Prism-dependent
                gating and evanescent emission due to the proximity of the TIR
                                                                                                   TIRF methods allow direct measurement of beam incidence
                interface to the power-normalized emitting dipole.3 Evanescent
                                                                                                   angle because the illuminating laser beam is external to the
                emission intensity depends on the dipole-to-interface distance
                                                                                                   microscope and user accessible. In through-the-objective TIRF,
                and is a substantial portion of the total emitted power for a
                                                                                                   the illuminating laser makes the final approach to the totally
                dipole on the interface. Its collection enhances the signal-to-
                                                                                                   reflecting interface in the small gap between the oil immersion
                noise ratio critical to modern applications like single molecule
                                                                                                   objective and coverslip, making it practically inaccessible. I
                                                                                                   describe here a method to measure incidence angle in a through-
                Address all correspondence to: Thomas P. Burghardt, Mayo Clinic Rochester,         the-objective TIRF microscope.
                Department of Biochemistry and Molecular Biology, and Department of Physiol-
                ogy and Biomedical Engineering, Rochester, Minnesota 55905; Tel: 507-284-
                8120; Fax: 507-284-9349 (FAX); E-mail: burghardt@mayo.edu                          0091-3286/2012/$25.00 © 2012 SPIE

                Journal of Biomedical Optics                                              126007-1                                      December 2012   •   Vol. 17(12)

Downloaded From: https://www.spiedigitallibrary.org/journals/Journal-of-Biomedical-Optics on 09 Sep 2021
Terms of Use: https://www.spiedigitallibrary.org/terms-of-use
Burghardt: Measuring incidence angle for through-the-objective total internal reflection . . .
Fig. 2 Optical train for excitation and emission pathways serving the
Olympus IX71 microscope. Double-edge arrows indicate translating
elements with the approximate spatial resolution and total travel (in
brackets) indicated where appropriate. The objective and camera
axial displacement sawtooth pattern is indicated in the insert. Abbrevia-
tions are: Glan-Taylor polarizer (P), polarization rotator (PR), activatable
shutter (S), mirror (M), beam expander (BE), lens (L1), TIRF illuminator
(TI), dichroic mirror (DM), and tube lens (TL).
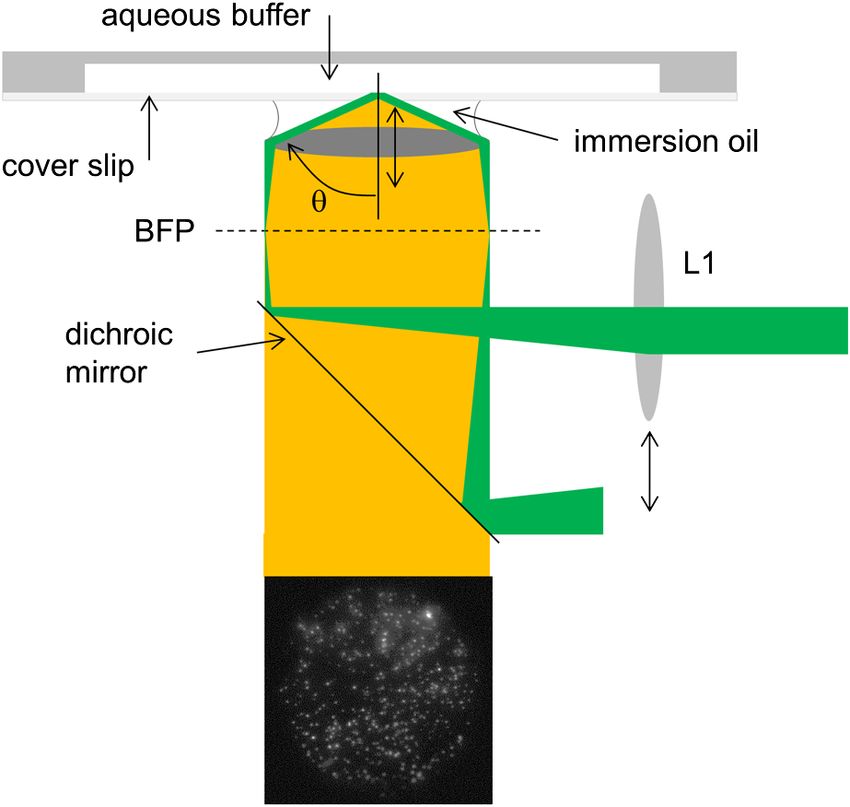
Fig. 1 Through-the-objective TIRF creates the evanescent field on the
aqueous side of the glass/aqueous interface with the illuminating laser
focused at the BFP then refracted by the objective at angles beyond θc . long-focal-length (250 mm) lens. Exciting laser light is focused
Lens L1 displaces the focused spot of the BFP to adjust θ. The objective by L1 and then enters the TIRF illuminator (TI), reflects at the
also collects fluorescence from 40-nm-diameter spherical beads dichroic mirror (DM), and is focused on the sample by the
attached to the aqueous side of the coverslip. Fluorescence transmits objective. Alternatively, illumination is accomplished with an
the dichroic mirror and is formed into a real image by the tube lens
onto the camera (tube lens and camera not shown) producing the
argon ion laser coupled directly to the TI through a fiber
image shown. Double-ended arrows indicate translating elements. optic. This option is not shown in Fig. 2 but is described in detail
below.
The objective (Olympus PlanApo 100X, 1.49 NA, 100 μm
2 Methods working distance, and using Olympus immersion oil with
refractive index 1.516 at 23°C) translates along the optical
2.1 Sample Preparation axis under manual control using the microscope focus and
Red-orange carboxylate-modified 40-nm-diameter fluorescent with nm precision using a piezo nanopositioner (C-Focus,
spheres having excitation/emission maxima at 565∕580 nm MCL). Emitted light is collected by the objective, transmitted
are from Molecular Probes (Life Technologies, Grand Island, by the dichroic mirror, then focused by the tube lens (TL) onto
New York). We diluted the stock 104 fold into distilled water, the camera (EMCCD, Hamamatsu C9100-13, Hamamatsu City,
giving sphere concentration of 1.4 × 10¹¹ spheres∕mL. Experi- Japan). A microscope stage with leadscrew drives and stepper
ments were conducted at room temperature. motors translate the EMCCD camera with submicron resolution
A water-tight chamber was constructed from three coverslips. (LEP, Hawthorne, New York). Computer control of the micro-
Two coverslips formed the top and bottom of the chamber, and scope is exercised through a custom written LabVIEW (National
the third was used to make 2 × 30 mm spacers separating the top Instruments, Austin, Texas) routine and drivers supplied by the
and bottom coverslips. The spacers were arranged along the manufacturers.
long edges of the coverslips. The spacers and coverslips formed Experiments were performed in two modes. In the moving
a 0.15-mm-thick rectangular solid volume with opposite ends objective/camera mode (mode 1), the objective and camera
open. Fluorescent spheres were flowed into one open end of are scanned axially and synchronously over the sawtooth pattern
the sample chamber and allowed to dry. Water was then flowed shown in the Fig. 2 insert. The camera translates over a distance
through the chamber, removing any loosely bound spheres. TIR given by objective travel multiplied by objective axial magnifi-
illumination produced fluorescence from the cover-slip surface cation (M2 for M the objective lateral magnification or 104 for
immobilized spheres. the 100× objective). The objective translates over 1.2 μm with a
step size of 24 nm, implying the camera translates synchro-
nously over 12 mm in steps of 240 μm. Synchronous movement
2.2 Microscopy
of objective and camera keep the sample in focus (albeit with
Figure 2 shows the inverted microscope (Olympus IX71) with aberration) in the sequence of images taken over the scan. In
excitation and emission detection pathways. Double-edge the second mode (mode 2), only the objective scans (1.2 μm
arrows indicate translating elements, with the approximate spa- total travel in steps of 24 nm), hence the image sequence shows
tial resolution and total travel (in brackets) indicated where the sample in and out of focus depending on the frame. In both
appropriate. The 514.5-nm line from the argon ion laser (Innova modes, the sample image sequence was aligned by computing
300, Coherent, Santa Clara, California) is linearly polarized by the intensity overlap of each frame relative to the main frame at
the Glan-Taylor (P) polarizer. The polarization rotator (PR) the center of the sawtooth curve (frame 51) as a function of rela-
rotates linear light polarization to the desired orientation. tive two-dimensional frame translation (main frame remains
The exciting light is shuttered at S. The beam expander (BE) fixed, no frame rotation). Optimized position maximizes overlap
consists of a 4X microscope objective and a large-diameter with the main frame. Experiments were performed in the two
Journal of Biomedical Optics 126007-2 December 2012 • Vol. 17(12)
Downloaded From: https://www.spiedigitallibrary.org/journals/Journal-of-Biomedical-Optics on 09 Sep 2021
Terms of Use: https://www.spiedigitallibrary.org/terms-of-useBurghardt: Measuring incidence angle for through-the-objective total internal reflection . . .
modes to address the practical concern that the image alignment
algorithm could degrade when aligning in-focus with out-of-
focus images.
The TIRF illuminator affects the light path to the objective
BFP, hence its impact on the beam displacement was assessed
with geometrical optics. Illumination is accomplished with
argon ion lasers coupled through a fiber optic or with the
beam propagating in air directly from the output coupler of the
laser. The former bypasses lens L1 and inputs directly to
the TIRF illuminator. The latter (shown in Fig. 2) is coupled
into the TIRF illuminator by L1. Figure 3 shows both pathways.
The fiber optic output is a point source placed at the focal plane
of L2 at the point intersected by the red line. This light propa-
gates to the BFP and onto the sample plane through the objective
along the red ray. L1 displaces the airborne beam from the opti-
cal axis of the TIRF illuminator. The beam follows the pathway
indicated by the blue ray diagram. Fiber optic and airborne Fig. 4 Objective axial displacement, z − z51 , translates the beam inten-
lasers have the same incidence angle. The evident divergence sity center of mass (COM) at the TIR interface through, ρ~ − ρ~51 , on the
of blue and red rays causes a relative displacement of the TIR aqueous side of the coverslip. Axial objective translation is expressed
beams at the sample plane. We conducted experiments using relative to its position in Frame 51 at the center of the axial saw-tooth
trajectory shown in Fig. 2. Beam intensity COM is calculated using
either source and could not discern visually the relative displa-
Eq. (2) and from the image of the fluorescent nanospheres collected
cement of the TIR beams. Displacement of the airborne beam by by the objective.
L1 translation using a micrometer, or identical displacement of
the fiber optic point source by another micrometer, produced
similar curves calibrating micrometer setting to incidence angle. where θ is the incidence angle and ρ~j the intensity center of mass
Figure 4 shows two parallel paths the incident TIR beam
(COM) in the sample plane in the j’th frame.
takes in the gap between objective and coverslip. The parallel A 512 × 512 pixel intensity array, cj ði; kÞ, where i corre-
beams leave the objective from two axial positions with the sponds to pixels in the y-dimension and k to pixels in the x-
net displacement, zj − z51 , indicated where subscripts j and dimension relative to the camera, represents the fluorescent
51 refer to the j’th and 51st frame. The 51st frame is half spheres image in frame j under TIR illumination. The intensity
way through the sawtooth pattern in Fig. 2. Objective axial dis- COM,
placement causes translation of the beam in the lateral plane P
indicated by ρ~j − ρ~51 for p i;k fi; kgcj ði; kÞ
ρ~j ¼ P ; (2)
M cj ði; kÞ
i;k
8 for p ¼ 16 μm∕pixel, M ¼ objective magnification ¼ 100, and
< −j~ρj − ρ~ 51 j for zj − z51 < 0
fi; kg the position vector on the camera chip. Equation (2) is
ðzj − z51 Þ tan θ ¼ 0 for zj ¼ z51 ; (1)
: used to compute j~ρj − ρ~51 j from cj ði; kÞ while zj − z51 is the
þj~ρj − ρ~51 j for zj − z51 > 0
readout from the piezo nanopositioner moving the objective.
Fig. 3 Ray diagram for the Olympus TIRF illuminator (TI) and adjacent optical elements in the excitation beam. Illumination by the factory installed
fiber optic bypasses lens L1 placing the point source of the fiber tip at the focal plane of L2 with light pathway indicated by the red line. The airborne
laser is coupled to the TI via L1 with focal length f 1 . L1 is displaced distance h from the optical axis of the TIRF illuminator. The beam follows the
pathway indicated in the blue ray diagram. L1 displacement, h, produces a focused beam at the BFP with height hi and magnification given by the ratio
of focal lengths, f 3 ∕f 2 . The objective is shown with focal length f o . Field stop, FS, controls the lateral size of the illuminated region at the focal plane of
the objective.
Journal of Biomedical Optics 126007-3 December 2012 • Vol. 17(12)
Downloaded From: https://www.spiedigitallibrary.org/journals/Journal-of-Biomedical-Optics on 09 Sep 2021
Terms of Use: https://www.spiedigitallibrary.org/terms-of-useBurghardt: Measuring incidence angle for through-the-objective total internal reflection . . .
Fig. 5 The j~ρj − ρ~51 j versus zj -z51 plot for 1 ≤ j ≤ 100 collected frames
in a mode 2 scanning experiment. The line fitted to the curve has tan θ
for slope and incidence angle θ ¼ 70 0.1 deg.
Figure 5 indicates representative data for a mode 2 experiment
with the j~ρj − ρ~51 j versus zj − z51 plot for 1 ≤ j ≤ 100 col-
lected frames. The fitted line to the curve has tan θ for slope
giving an incidence angle of 70.1 0.1 deg. Experiments
performed in the two scanning modes address the practical
concern that COM estimation could degrade for an out-of-
focus image.
Fig. 6 (a) Incidence angle (θ) versus beam displacement in mm aver-
3 Results aging data from six experiments using airborne illumination or fiber
optic illumination. (b) Penetration depth of the evanescent field calcu-
Figure 6(a) indicates incidence angle versus beam displacement lated using Eq. (3) and the incidence angle measured in A. Parameters
in mm averaging data from six experiments using airborne illu- used in Eq. (3) are: λ ¼ 514.5 nm, ng ¼ 1.516, and nw ¼ 1.334.
mination (three experiments) and fiber optic illumination (three
experiments). Three experiments used the objective/camera syn-
chronous translation mode (mode 1) and three experiments the suggests that starting the calibration from maximum incidence
objective only translation mode (mode 2). There was no evident may be better practice.
performance difference related to the illumination method or Figure 6(b) shows the calculated penetration depth,
scanning mode. Invariance under scanning modes 1 or 2 sug- λ 1
gests the intensity COM is accurately approximated using d¼ qffiffiffiffiffiffiffiffiffiffiffiffiffiffiffiffiffiffiffiffiffiffiffiffiffiffiffiffi ; (3)
Eq. (2) whether the image is in- or out-of-focus, and that the 4π n2 sin2 θ − n2
g w
image alignment algorithm is adequate for alignment of an out-
of-focus image with its in-focus counterpart. Data in Fig. 6(a) for λ the incidence light wavelength (514.5 nm) in air, ng and nw
also indicates the ratio of focal lengths for lenses L2 and L3 in the refractive indices of glass and water (1.516 and 1.334), and θ
the TI (Fig. 3), f 3 ∕f 2 ≈ 0.9. Focal lengths f 2 and f 3 are several from Fig. 6(a).1 It suggests penetration depth of ∼60 nm is
cm long. achievable with the 100× 1.49 NA Olympus TIRF objective.
Error bars indicate standard error of the mean for n ¼ 6.
Beam displacement is the distance from the optical axis to
the TIR beam where they intersect the BFP. The critical and 4 Discussion
maximum beam displacements are 1.58 and 1.77 mm corre- Illuminated volume minimization enhances emission source loca-
sponding to incidence angles of 61.6 (θc ) and 79.4 deg, respec- lization and background light rejection, both critically important
tively. Experiments were performed by adjusting the in widefield microscopy. TIRF microscopy utilizes an evanescent
illuminating source just past θc incidence with visual validation field to selectively illuminate a sample within ∼100 nm of the
of TIR by observing the light streak in the interface plane at θc TIR interface usually located at the coverslip-sample contact.
incidence completely disappear as we adjusted incidence Through-the-objective TIRF is widely used for this application
beyond θc . We see from Fig. 6(a) that this point is ∼4 deg due to its simple implementation on infinity-corrected optics
beyond θc . At maximum beam displacement and beyond, and reliable performance. Atomic force microscopy combined
emitted light intensity diminished as the illuminating beam with through-the-objective TIRF enabled the direct detection
exceeded the objective output aperture. The visual validation of the exponentially decaying evanescent field using a fluorescent
of TIR may not be as reliable a starting point for calibration marker.9,10 Mattheyses and Axelrod measured the evanescent
as the maximum incidence judging by error estimates. It field axial profile and penetration depth by imaging index-
Journal of Biomedical Optics 126007-4 December 2012 • Vol. 17(12)
Downloaded From: https://www.spiedigitallibrary.org/journals/Journal-of-Biomedical-Optics on 09 Sep 2021
Terms of Use: https://www.spiedigitallibrary.org/terms-of-useBurghardt: Measuring incidence angle for through-the-objective total internal reflection . . .
matched low refractive index spherical beads.4 They also showed essentially the TIRF illuminator in Figs. 2 and 3, need calibra-
that with through-the-objective TIRF, fractional contributions of tion in the field. In this context, the incidence angle calibration is
evanescent and scattered light on the low refractive index side of preferable to other methods because it depends only on micro-
the interface surface contributes ∼90% and ∼10% of the total scope characteristics that do not change for a particular objective
intensity. The ratio of scattering versus evanescent intensity is regardless of interface or sample optical characteristics. Hence,
probably smaller for prism-based TIRF. Both atomic force micro- absolute calibration of the TIRF system should be easier, more
scopy and spherical bead-imaging evanescent field calibration accurate, and less expensive using incidence angle rather than
methods are elegant and practical; however, they must be re- evanescent field profile.
applied to each situation in which basic optical characteristics
of the TIR interface or sample change. Acknowledgments
The approach described here measures the incidence angle of
This work was supported by NIH grants R01AR049277 and
the illuminating beam. This characterization is independent of
R01HL095572 and by the Mayo Foundation.
the optical characteristics of the TIR interface and sample in
the evanescent field but depends mainly on objective NA and
potentially other geometrical constraints related to the illuminat- References
ing beam profile. In our case, the substitution of the airborne
1. M. Born and E. Wolf, “Basic properties of the electromagnetic field,” in
laser beam for the factory installed fiber optic coupling was Principles of Optics, pp. 1–70, Pergamon Press, Oxford (1975).
shown not to affect incidence angle, hence it will not impact 2. A. L. Stout and D. Axelrod, “Evanescent field excitation of
the evanescent field, although this conclusion could be surmised fluorescence by epi-illumination microscopy,” Appl. Opt. 28(24),
from the ray diagram in Fig. 3. Refractive indices of materials 5237–5242 (1989).
are often difficult to know absolutely because they depend on 3. E. H. Hellen and D. Axelrod, “Fluorescence emission at dielectric and
temperature, moisture content, and other parameters that all metal-film interfaces,” J. Opt. Soc. Am B 4(3), 337–350 (1987).
4. A. Mattheyses and D. Axelrod, “Direct measurement of the evanescent
must be matched to the situation of interest. Additionally, bio-
field profile produced by objective-based total internal reflection fluor-
logical matter is heterogeneous such that refractive index escence,” J. Biomed. Opt. 11(1), 014006 (2006).
depends on spatial position in the sample. These factors will 5. D. Axelrod, “Cell-substrate contacts illuminated by total internal reflec-
impact the evanescent field but not incidence angle. tion fluorescence,” J. Cell Biol. 89(1), 141–145 (1981).
A color-corrected TIRF objective should produce the same 6. T. P. Burghardt, A. P. Hipp, and K. Ajtai, “Around-the-objective total
incidence angle for different illumination wavelengths, while internal reflection fluorescence microscopy,” Appl. Opt. 48(32),
penetration depth [Eq. (3)] will change as it depends explicitly 6120–6131 (2009).
7. D. Axelrod, “Total internal reflection fluorescence microscopy in cell
and implicitly (from ng and nw ) on wavelength. However, lack biology,” Traffic 2(11), 764–774 (2001).
of color corrected optics in the TIRF illuminator may yet impart 8. D. Axelrod and G. M. Omann, “Combinatorial microscopy,” Nat. Rev.
wavelength dependence in the incidence angle calibration. Mol. Cell Biol. 7(12), 944–952 (2006).
An absolute calibration of a TIRF objective could be stated as 9. A. Sarkar, R. B. Robertson, and J. M. Fernandez, “Simultaneous atomic
the incidence angle versus beam displacement, as in Fig. 6(a). force microscope and fluorescence measurements of protein unfolding
This information is already coded in the objective NA because using a calibrated evanescent wave,” Proc. Natl. Acad. Sci. 101(35),
12882–12886 (2004).
incidence angle and beam displacement are related by the sine 10. M. S. Kellermayer et al., “Spatially and temporally synchronized atomic
condition (excluding Herschel condition obeying optics). None- force and total internal reflection fluorescence microscopy for imaging
theless, real TIRF instruments rely on micrometers and relay and manipulating cells and biomolecules,” Biophys. J. 91(7),
lenses to position the laser beam at the BFP. These devices, 2665–2677 (2006).
Journal of Biomedical Optics 126007-5 December 2012 • Vol. 17(12)
Downloaded From: https://www.spiedigitallibrary.org/journals/Journal-of-Biomedical-Optics on 09 Sep 2021
Terms of Use: https://www.spiedigitallibrary.org/terms-of-useYou can also read