Development of Well-Porous Structured Leavened Food Product from Rice-based Composite Flour - Journals
←
→
Page content transcription
If your browser does not render page correctly, please read the page content below
Rathnayake et al./ Vidyodaya Journal of Science Vol. 24 No. 01 (2021) 21-30

 Development of Well-Porous Structured Leavened Food Product from
                    Rice-based Composite Flour
                   H.A. Rathnayake1, S.B. Navaratne1* and C.M. Navaratne2
          1
           Department of Food Science and Technology, University of Sri Jayewardenepura,
                                        Nugegoda, Sri Lanka
      2
        Department of Agricultural Engineering, University of Ruhuna, Kamburupitiya, Sri Lanka

                    Date Received: 09-03-2021                  Date Accepted: 12-04-2021

Abstract
        Well-porous structured leavened food products with a proper texture have a high demand in the
dynamic food market. Hence, the current study was focused to formulate a leavened food product with a
proper porous and better-textured crumb using rice-based composite flour (CF). Nine CF samples were
prepared according to Taguchi’s orthogonal array by taking three variables (corn flour, finger millet
flour, green gram flour) at three levels (0, 5%, 10%). Nine dough samples were prepared from each CF
sample and subjected to fermentation and gelatinization under 1 kg/cm2 initial air pressure condition.
Results revealed that crumb sample prepared from CF4 (Rice: Wheat: Corn: Green gram, 50:40:5:5)
showed higher crumb volume, specific volume, lower bulk density and better crumb cellular structure
properties which did not significantly different (p>0.05) to CF1 (Rice: Wheat, 50:50). Further, CF4
imparted to have the lowest crumb hardness, gumminess and chewiness. Thus, CF4 was selected as the
best CF sample, which yielded a leavened food product with better textural and structural properties.
Keywords: composite flour, fermentation, porous-crumb structure, rice flour, Taguchi’s orthogonal
          array

1. Introduction
        Due to the increasing lifestyle diseases and nutritional concern, demand for the novel and healthy
foods are increasing (Patil et al., 2016). Thus, the application of composite flour in developing leavened-
baked food products using alternative flours to wheat flour has gained a huge interest in the global food
industry (Menon et al., 2015). The term “composite flour” is defined by Seibel (2011) as “a mixture of
flours from tubers rich in starch and/or flours rich in protein and/or cereals, with or without incorporating
wheat flour”. Generally, rice, corn, sorghum, finger millet, buckwheat are the frequently applied grains
in substituting wheat flour for the development of leavened-baked products. Among them, rice flour is
highly consumed due to its hypoallergenic properties, low sodium content, pale appearance, and trivial
flavour (Mancebo et al., 2015; Wu et al., 2019). Further, Rice (Oryza sativa L.) is the staple food of more
than half of the world population and is the second most-consumed cereal in the world (Cho et al., 2019).
         Corn (Zea mays L.), is one of the most commonly consumed cereal crops throughout the world
and it contributes to produce over billion tons of yield annually throughout the globe (Sun et al., 2019).
Corn is a highly nutritious cereal crop, is rich in dietary fibre, vitamins, minerals, essential amino acids
along with functional elements such as phenolics, flavonoids, anthocyanin, β‐carotene, and lutein (Zhang
et al., 2016; Julianti et al., 2017; Sun et al., 2019). Finger millet (Eleusine coracana L.) is a nutritious
small-seeded coarse cereal that contains a considerable amount of protein (with essential amino
__________________________________________________
*Correspondence: sbnava@sci.sjp.ac.lk
Tel: +94 775095610
© University of Sri Jayewardenepura
                                                                                                          21
acids), dietary fibre, minerals (especially calcium, iron, phosphorus), and vitamin (including pro-vitamin
A and vitamin B) (Devani et al., 2016; Patil et al., 2016; Thorat and Ramachandran, 2016). Due to the
higher phenolic content in finger millet grains, it has a cholesterol-lowering capability along with the
ability to regulate blood glucose homeostasis. Hence, finger millet flour is a commonly applied
constituent in composite flour mixes as a functional food ingredient in developing a variety of food
products including soup mixes, noodles, pasta products, and bakery products, particularly bread and
biscuit (Devani et al., 2016; Patil et al., 2016). Green gram (Vigna radiate) is a protein-rich legume and
is known as one of the cheapest and the richest sources of plant protein (Pasha et al., 2011). Further,
Green gram contains essential fatty acids, vitamins (B1 and B2), minerals (Phosphorous, Calcium, Iron),
and antioxidant properties (Pasha et al., 2011; Rajiv et al., 2012; Shukla et al., 2016).
However, little work has been reported in the literature regarding the evaluation of functional
flour properties and porous crumb structural properties of leavened food products prepared from
composite flour out of rice flour, wheat flour, corn flour, finger millet flour, and green gram flour. Under
this circumstance, the current study was conducted with a view to expanding the utilization of rice flour,
corn flour, finger millet flour, and green gram flour in developing leavened food products. Thus,
composite flour samples were prepared according to Taguchi’s orthogonal array while using rice flour
as the major ingredient (50%) along with the other grain flours. Crumb samples were prepared out of
composite flour samples and fermentation and gelatinisation of them were carried out under slightly high
initial air pressure condition. Prepared crumb samples were subjected to evaluate textural and structural
properties; in order to select the best composite flour sample.
2. Materials and Methods
2.1 Materials
Certified paddy was obtained from Rice Research and Development Institute Bathalegoda, Sri
Lanka. Corn, Finger millet, Green gram, and other major ingredients for crumb sample preparation such
as wheat flour, bakers’ yeast, salt, sugar, and shortening were purchased from local reputed supermarkets
in Colombo, Sri Lanka.
2.2 Preparation of rice flour
Paddy was cleaned, de-husked and polished. Thereafter, polished rice grains were cleaned and
subjected to heat-moisture treatment as per the method described by Navaratne (2015). The treated rice
grains were soaked in cold water (25±2° C) for 4 hours followed by grinding (National, MX-110PN,
Japan). The ground rice flour was dried (Leader-GPME350SSVISS080, UK) at 55±1°C for 4 hours and
sieved using 180 µm sieve (Endecotts©, Minor 200, United Kingdom).
2.3 Preparation of corn flour
Corn grains were cleaned and soaked in 0.5% SMS solution (25±2° C) for 8 hours. The well-
soaked grains were washed thoroughly with pure water and placed in a freezer at -17±2° C (Hisense©,
FC-40DD4SA, China) for 8 hours. The frozen grains were soaked again in water (25±2o C) for 8 hours
followed by freezing for another 8 hours. Finally, the grains were thawed and ground (National©, MX-
110PN, Japan). The ground corn flour was dried (Leader-GPME350SSVISS080©, UK) at 55±1o C for
6 hours and sieved using the 180 µm sieve.
2.4 Preparation of finger millet flour
Finger millet grains were cleaned and soaked in water at 25±2° C for 6 hours followed by drying
at 60±5° C for 4 hours using a rotary dryer. Well-dried grains were ground with a disintegrator (Bio-
base, HSD-80, China) and passed through the 180 µm sieve.
22Rathnayake et al./ Vidyodaya Journal of Science Vol. 24 No. 01 (2021) 21-30
2.5 Preparation of green gram flour
Green gram grains were cleaned and soaked in water at 25±2° C for 3 hours followed by drying
at 60±5° C for 8 hours using a rotary dryer. Well-dried grains were ground (Bio-base©, HSD-80, China)
and passed through the 180 µm sieve.
2.6 Preparation of composite flour according to Taguchi’s orthogonal array
Nine rice-based composite flour samples were prepared according to the statistical design of
Taguchi’s orthogonal array (L9 design) using three variables namely corn flour, finger millet flour, and
green gram flour at three levels (0%, 5%, 10%; for 100g flour basis) as given in Table 1.
Table 1: Nine composite flour samples according to Taguchi’s orthogonal array (L9 design).
Abbreviation of
Rice flour Wheat flour Corn Finger Millet Green gram
Composite flour
(%) (%) flour (%) flour (%) flour (%)
samples
CF1 50 50 0 0 0
CF2 50 40 0 5 5
CF3 50 30 0 10 10
CF4 50 40 5 0 5
CF5 50 30 5 5 10
CF6 50 35 5 10 0
CF7 50 30 10 0 10
CF8 50 35 10 5 0
CF9 50 25 10 10 5
2.7 Preparation of crumb samples
Gelatinised crumb samples were prepared using the nine CF samples by performing the
fermentation and gelatinisation at a slightly high air pressure condition (1 kg/cm2 initial air pressure)
according to the method described by Rathnayake et al. (2019).
2.8 Evaluation of functional flour properties of nine CF samples
Water absorption capacity (WAC) and oil absorption capacity (OAC) of the nine CF samples
were determined according to the method described by Chandra et al. (2015) with slight modifications.
Therein, approximately 1.00±0.002 g (Axis analytical balance, ALN220, Poland) of each CF was
dispersed in 10.00 mL distilled water (for WAC) and refined vegetable oil (for OAC) at 28±2° C for 30
minutes. Thereafter, the paste was centrifuged (Hermle labortechnik gmbh©, Universal Centrifuge, Z
306, Germany) at 3,000 rpm for 10 minutes and the supernatant was weighed. WAC was calculated as
grams of water bound per one gram of CF. OAC was calculated as grams of oil bound per gram of CF.
2.9 Evaluation of crumb physical properties
(a) Volume, specific volume and bulk density
Gelatinised crumb samples were cooled at room temperature (29±2° C, 69% RH) for 25 minutes.
Thereafter, volume (cm3), specific volume (cm3/g), and bulk density (g/cm3) of the crumb samples were
evaluated following the seed displacement method (AACC International, 2000; Aplevicz et al., 2013).
(b) Texture profile analysis
Texture profiles of the nine crumb samples were analysed using CT3 texture profile analyser
concerning 20.00±1 mm sample height, 25 mm diameter probe (TA11/1,000), two compression cycles,
50% penetration depth, 5 g trigger load, 1 mm/s test speed, and 4,500 g load cell. Thereafter, Hardness
23(g), Springiness (mm), Cohesiveness, Gumminess (g), and Chewiness (mJ) of the crumb samples were
assessed using Brookfield Texture ProCT Software TA-CT-PAD-AY.
(c) Crumb cellular structure properties (Image analysis)
Approximately, 3.00±0.5 mm thick slices of the nine crumb samples (30 slices from each) were
scanned (flatbed scanner, Canon Lide-120) under the resolution of 300 dpi and saved in JPEG format.
Porosity (%), Cell density (number of cells per unit area cm2), Average cell area (cm2), Cell circularity,
Solidity, and Fractal dimension (following box-counting method) of the scanned images were evaluated
using ImageJ software following the steps described by Pérez-Nieto et al. (2010).
2.10 Statistical analysis
The data obtained from the study were statistically analysed (at 95% confidence level) according
to one-way ANOVA (followed by Tukey sample comparison) using Minitab 17 statistical software. All
the samples and treatments were replicated thrice and the relevant graphs were drawn using Microsoft
Excel 2013.
3. Results and Discussion
3.1 Functional flour properties of nine CF samples
Flour hydration properties namely water absorption capacity (WAC) and oil absorption capacity
(OAC) of the nine composite flour samples are given in plot “A” and plot “B” respectively of Figure 1.
WAC is an important functional property for baking applications as well as for bulking and
consistency of a final product (Amandikwa et al., 2015). According to plot “A” in Figure 1, WAC of
CF1 (rice flour: wheat flour, 50:50 ratio) is the lowest, and the addition of different proportions of corn,
finger millet, and green gram flours to the rice and wheat flour mix considerably affected to the WAC of
the flour samples. However, WAC values of CF2, CF4, CF6, CF7, and CF8 are not significantly different
(p>0.05) to the WAC of CF1. Oladunmoye et al. (2010) and Chandra and Samsher (2013) have also
observed that the WAC of wheat flour is lower than that of rice flour, corn flour, and green gram flour.
Hallén et al. (2004) have also stated that if the flour sample contained a higher percentage of protein, the
WAC of the flour mix is getting higher. Because, protein can absorb water up to 200% of its weight
while carbohydrates can absorb water only up to 15% of its weight (Akubor and Ukwuru, 2003). As per
the results shown in plot “A” in Figure 1, composite flour samples of CF3, CF5, and CF9 have high
WAC values, and these values are significantly higher (pRathnayake et al./ Vidyodaya Journal of Science Vol. 24 No. 01 (2021) 21-30
According to the results given in Table 2, CF4 sample imparted to have a higher crumb volume,
specific volume, and a lower bulk density compared to the other crumb samples that contained corn,
finger millet, and green gram flours.
A
B
Figure 1: Hydration properties of composite flour samples; (A) Water absorption capacity, (B) Oil
absorption capacity. (Bar values are represented as mean±SD of replicates; mean values in the same
plot with different superscripts are significantly different at 0.05 significant level).
Amandikwa et al. (2015) have stated that if higher the WAC of a flour sample, the weight of the
final product gets increased, resulting to have a lower specific volume. According to the current study,
CF9 and CF3 samples demonstrated the highest (1.931±0.020 g/g) and the second-highest (1.878±0.011
g/g) WAC values respectively. So also, as per the results given in Table 2, the crumb sample prepared
from CF9 has the lowest crumb volume, specific volume, and the highest bulk density compared to the
other eight crumb samples. Moreover, the crumb sample prepared from CF3 also shows lower crumb
specific volume and higher bulk density values, however; these values are not significantly different
(p>0.05) to the same parameters of the crumb sample prepared from CF9.
25Table 2: Volume, specific volume, and bulk density of crumb samples prepared from the nine
composite flour samples.
Composite Crumb volume Specific volume Bulk density
flour (cm3) (cm3/g) (g/cm3)
samples
CF1 60.459±0.541a 2.162±0.028a 0.463±0.006f
CF2 53.540±1.269bc 1.908±0.062bcd 0.525±0.017cde
CF3 48.607±0.470e 1.735±0.021ef 0.576±0.007ab
CF4 55.740±1.730b 2.010±0.119ab 0.499±0.019ef
CF5 49.793±1.362de 1.775±0.055cdef 0.563±0.018bc
CF6 48.828±0.585e 1.754±0.040def 0.570±0.013bc
CF7 50.544±0.328cde 1.809±0.025cde 0.553±0.002bcd
CF8 53.190±1.910bcd 1.945±0.065bc 0.515±0.017de
CF9 43.857±1.442f 1.613±0.061f 0.621±0.013a
*Results are represented as mean±SD of replicates; mean values in the same column with different
superscripts are significantly different at 0.05 significant level.
Texture Profile Analysis (TPA) is an imitative test that is similar to what goes within the human
mouth (Rosenthal, 1999) and it is an important parameter for evaluating the effect of different CF on
developing a textured product. When following the instrumental texture profile analysis, texture profile
attributes are calculated based on the compression curve of force versus time plot, where, peak force of
the first compression cycle represents the hardness (g) of the product. The density that continues
throughout the chewing is considered as the gumminess (g) and the energy required to chew the sample
to make it ready for swallowing (depending on the gumminess and springiness) is referred to as the
chewiness (mJ) (Patil et al., 2016; Rathnayake et al., 2018).
Table 3: Texture profile analysis of crumb samples prepared from the nine composite flour samples.
Composite
Springiness
flour Hardness (g) Cohesiveness Gumminess (g) Chewiness (mJ)
(mm)
samples
CF1 1305.000±104.600e 9.767±0.299bcd 0.570±0.037a 740.200±44.000de 70.640±3.560c
CF2 1901.700±206.900cd 9.373±0.168d 0.530±0.013b 1132.800±69.400c 104.000±7.040b
CF3 2962.000±165.000ab 9.370±0.119d 0.475±0.017e 1629.700±108.800a 140.220±14.010
a
CF4 1299.200±151.400e 10.009±0.176ab 0.537±0.018b 643.700±32.600e 82.460±7.770 bc
CF5 2137.600±101.100c 9.637±0.231bcd 0.485±0.017de 1025.600±100.500c 96.890±18.760b
c
CF6 1798.000±99.600d 9.425±0.268cd 0.590±0.008a 1036.660±24.990c 95.860±5.840 bc
CF7 2747.000±191.800b 9.875±0.202b 0.507±0.010bcd 1431.500±53.700b 138.000±3.690a
CF8 1695.900±127.600d 10.357±0.248a 0.519±0.011bc 835.400±31.600c 95.100±13.300b
c
CF9 3205.000±210.800a 9.814±0.107bc 0.490±0.016cde 1580.100±49.100a 157.260±18.240
*Results are represented as mean±SD of replicates; mean values in the same column with adifferent
superscripts are significantly different at 0.05 significant level.
According to the results of TPA given in Table 3, the crumb sample prepared from CF4 shows
better crumb textural properties with the lowest crumb hardness, gumminess, and chewiness values
compared to all the other crumb samples which contained corn, finger millet, and green gram flour. Since,
the crumb samples prepared from CF4 and CF8 having the highest springiness values, these two samples
indicate a comparatively higher ability of recoverability after withdrawing the compressive force.
Saha et al. (2011) have observed, with the reduction of wheat flour percentage of a composite
flour sample, the cohesiveness of the crumb samples getting lower due to the reduced gluten plasticity.
The results of the current study (Table 3) are also in agreement with that observation, because composite
26Rathnayake et al./ Vidyodaya Journal of Science Vol. 24 No. 01 (2021) 21-30
flour samples namely CF3, CF5, CF7, and CF9 having comparatively lower percentages of wheat flour
than the other composite flour samples. Hence, these samples contributed to develop crumbs with lower
cohesiveness values.
According to the digital image analysis, a well-developed porous crumb structure can be
identified by high porosity along with a finer and a regular gas cell structure (Lassoued et al., 2008). Cell
density is an indication of a finer crumb cellular structure and it can be evaluated by the total number of
cells detected over a total measured area (Che Pa et al., 2013).
Even though the crumb samples prepared from CF3 and CF9 having the highest cell density,
these two samples show significantly low (p0.05) from the same values of the crumb sample prepared
from CF1. Moreover, the crumb sample prepared from CF4 has the second-lowest FD value compared
to the rest of the eight crumb samples. Thus, these observations indicate that the crumb sample prepared
from CF4 sample contributed to develop simpler and smoother grey-level images with more circular and
solid gas cells.
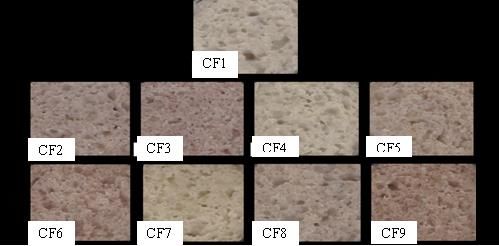
Figure 2. Scanned images of the crumb samples prepared from the nine composite flour samples.
27Table 4: Cellular structure properties (Image analysis) of the crumb samples prepared from nine
composite flour samples.
Composite
Cell density Porosity Average cell Cell Fractal
flour Solidity
(cell/cm2) (%) area (cm2) circularity dimension
samples
CF1 24.486±1.017f 30.791±1.991bc 0.013±0.002ab 0.506±0.020ab 0.730±0.021a 1.659±0.031c
CF2 30.797±2.319cd 30.244±1.554cd 0.010±0.001cd 0.474±0.020c 0.689±0.011cd 1.696±0.030ab
CF3 38.507±2.623a 28.375±1.940de 0.007±0.001d 0.444±0.023d 0.670±0.013d 1.710±0.023ab
CF4 26.576±2.176ef 31.846±2.011abc 0.012±0.002bc 0.512±0.015a 0.726±0.013a 1.689±0.019b
CF5 28.102±3.048e 32.888±3.062a 0.012±0.002bc 0.464±0.020cd 0.686±0.018cd 1.714±0.015ab
CF6 33.023±2.601bc 32.948±2.152abc 0.010±0.002cd 0.446±0.017d 0.674±0.013d 1.722±0.022a
CF7 25.409±1.309f 33.607±1.492a 0.015±0.002a 0.487±0.022bc 0.713±0.016ab 1.700±0.022ab
CF8 28.330±2.436de 32.610±2.457abc 0.012±0.002bc 0.479±0.028c 0.701±0.020bc 1.712±0.027ab
CF9 35.398±2.229b 27.740±2.462e 0.008±0.001d 0.464±0.017cd 0.681±0.010d 1.705±0.029ab
*Results are represented as mean±SD of replicates; mean values in the same column with different
superscripts are significantly different at 0.05 significant level.
4. Conclusion
Different CF mixtures would differently affect on the flour functional properties and the
development of well-porous structured leavened food products with better crumb textural and structural
properties. All the composite flour samples exhibited a stronger affinity for oil rather than water. CF4
(Rice: wheat: corn: green gram flours with the ratio of 50:40:5:5) was selected as the best flour
combination as this flour mixture imparted to develop a leavened food product with a higher gas retention
capacity and better crumb textural and cellular structural properties.
Acknowledgment
Research Council, University of Sri Jayewardenepura, Sri Lanka for funding the project [Grant
number: ASP/01/RE/SCI/2019/12] and the Department of Food Science and Technology, University of
Sri Jayewardenepura, Sri Lanka for providing laboratory facilities.
References
AACC International, 2000. Standard 10-05.Approved Methods of American Association of Cereal
Chemists, (10th ed). The Association: St. Paul, MN.
Akubor, P.I. and Ukwuru, M.U., 2003. Functional properties and biscuit making potential of soybean
and cassava flour blends. Plant foods for human nutrition, 58:1-12.
Amandikwa, C., Iwe, M.O., Uzomah, A. and Olawuni, A.I., 2015. Physico-chemical properties of wheat-
yam flour composite bread. Nigerian Food Journal, 33:12-17.
Aplevicz, K.S., Ogliari, P.J. and Sant’Anna, E.S., 2013. Influence of fermentation time on characteristics
of sourdough bread. Brazilian Journal of Pharmaceutical Sciences, 49:233-239.
Chandra, S. and Samsher, 2013. Assessment of functional properties of different flours. African Journal
of Agricultural Research, 8:4849-4852.
Chandra, S., Singh, S. and Kumari, D., 2015. Evaluation of functional properties of composite flours and
sensorial attributes of composite flour biscuits. Journal of Food Science and Technology,
52:3681-3688.
Cho, S.H., Lee, B.H. and Eun, J.B., 2019. Physicochemical properties of dry- and semi-wet-milled rice
flours after fermentation by Lactobacillus amylovorus. Journal of Cereal Science, 85:15-19.
Crowley, P., Grau, H. and Arendt, E.K., 2000. Influence of additives and mixing time on crumb grain
characteristics of wheat bread. Cereal Chemistry, 77:370-375.
28Rathnayake et al./ Vidyodaya Journal of Science Vol. 24 No. 01 (2021) 21-30
Devani, B.M., Jani, B.L., Kapopara, M.B., Vyas, D.M. and Ningthoujam, M.D., 2016. Study on quality
of white bread enriched with finger millet flour. International Journal of Agriculture,
Environment and Biotechnology, 9:903-907.
Hallén, E., Ibanoǧlu, Ş. and Ainsworth, P., 2004. Effect of fermented/germinated cowpea flour addition
on the rheological and baking properties of wheat flour. Journal of Food Engineering, 63:177-
184.
Iwe, M.O., Onyeukwu, U. and Agiriga, A.N., 2016. Proximate, functional and pasting properties of
FARO 44 rice, African yam bean and brown cowpea seeds composite flour. Cogent Food &
Agriculture, 2:1142409.
Julianti, E., Rusmarilin, H. and Yusraini, E., 2017. Functional and rheological properties of composite
flour from sweet potato, maize, soybean and xanthan gum. Journal of the Saudi Society of
Agricultural Sciences, 16:171-177.
Lassoued, N., Babin, P., Della Valle, G., Devaux, M.F. and Réguerre, A.L., 2008. Baked product texture:
correlations between instrumental and sensory characterization using Flash Profile. Journal of
Cereal Science, 48:133-143.
Mancebo, C.M., Merino, C., Martínez, M.M. and Gómez, M., 2015. Mixture design of rice flour, maize
starch and wheat starch for optimization of gluten free bread quality. Journal of Food Science
and Technology, 52:6323-6333.
Menon, L., Majumdar, S.D. and Ravi, U., 2015. Development and analysis of composite flour bread.
Journal of food science and technology, 52:4156-65.
Navaratne, S.B., 2015. Manual Technology of rice bread making. University of Sri Jayewardenepura.
Oladunmoye, O.O., Akinoso, R. and Olapade, A.A., 2010. Evaluation of some physical-chemical
properties of Wheat, Cassava, Maize and Cowpea flours for bread making. Journal of Food
Quality, 33:693-708.
Pasha, I., Rashid, S., Anjum, F.M., Sultan, M.T., Qayyum, M.N. and Saeed, F., 2011. Quality evaluation
of wheat-mungbean flour blends and their utilization in baked products. Pakistan Joural of
Nutrition, 10:388-392.
Patil, S.S., Rudra, S.G., Varghese, E. and Kaur, C., 2016. Effect of extruded finger millet (Eleusine
coracan L.) on textural properties and sensory acceptability of composite bread. Food Bioscience,
14:62-69.
Pérez-Nieto, A., Chanona-Pérez, J.J., Farrera-Rebollo, R.R., Gutiérrez-López, G.F., Alamilla-Beltrán, L.
and Calderón-Domínguez, G., 2010. Image analysis of structural changes in dough during baking.
LWT. Food Science and Technology, 43:535-543.
Rajiv, J., Soumya, C., Indrani, D. and Venkateswara Rao, G., 2012. Influence of green gram flour
(phaseolus aureus) on the rehology, microstructure and quality of cookies. Journal of Texture
Studies, 43:350-360.
Rathnayake, H.A., Navaratne, S.B. and Navaratne, C.M., 2018. Porous crumb structure of leavened
baked products. International Journal of Food Science, Volume2018:15 pages.
Rathnayake, H.A., Navaratne, S. and Navaratne, C., 2019. Improving porous crumb structure of rice-
related leavened food products by fermentation and gelatinization at slightly higher air pressure
conditions. Journal of Texture Studies, 50:564-570.
Rosenthal, A. 1999. Relation between instrumental and sensory measures of food texture. Food Texture:
Measurement and Perception,1-17.
Saha, S., Gupta, A., Singh, S.R.K., Bharti, N., Singh, K.P., Mahajan, V. and Gupta, H.S., 2011.
Compositional and varietal influence of finger millet flour on rheological properties of dough and
quality of biscuit. LWT. Food Science and Technology, 44:616-621.
Seibel, W., 2011. 16 Composite flours. Future of Flour, 193-198. www.muehlenchemie.de/ downloads-
future-of-flours/fof_kap_16.pdf. Accessed 21 August 2017.
29Shukla, R.N., Mishra, A.A. and Gautam, A.K., 2016. Development of protein enriched biscuit fortified
with green gram flour. Food Science Research Journal, 7:112-118.
Sun, H., Ju, Q., Ma, J., Chen, J., Li, Y., Yuan, Y., Hu, Y., Fujita, K. and Luan, G., 2019. The effects of
extruded corn flour on rheological properties of wheat‐based composite dough and the bread
quality. Food Science and Nutrition, 7:2977-2985.
Thorat, S.S. and Ramachandran, P., 2016. Effect of finger millet flour on rheological properties of wheat
dough for the preparation of bread. International Journal of Food and Nutritional Science, 5:74-
81.
Wu, T., Wang, L., Li, Y., Qian, H., Liu, L., Tong, L. and Zhou, X., 2019. Effect of milling methods on
the properties of rice flour and gluten-free rice bread. LWT. Food Science and Technology,
108:137-144.
Zhang, X., Chen, Y., Zhang, R., Zhang, Y., Luo, Y., Xu, S., Liu, J., Xue, J. and Guo, D., 2016. Effects
of extrusion treatment on physicochemical properties and in vitro digestion of pregelatinized high
amylose maize flour. Journal of Cereal Science, 68:108-115.
30You can also read